. 2013 Sep-Oct;110(1-2):145-52.
doi: 10.1016/j.ymgme.2013.07.011. Epub 2013 Jul 19.

Mitochondrial respiratory chain disease discrimination by retrospective cohort analysis of blood metabolites

Affiliations

Mitochondrial respiratory chain disease discrimination by retrospective cohort analysis of blood metabolites

Colleen Clarke et al. Mol Genet Metab. 2013 Sep-Oct.

Abstract

Diagnosing primary mitochondrial respiratory chain (RC) dysfunction has long relied on invasive tissue biopsies, since no blood-based biomarker has been shown to have sufficiently high sensitivity and specificity across the myriad of individual clinical presentations. We sought to determine whether cohort-level evaluation of commonly obtained blood analytes might reveal consistent patterns to discriminate a heterogenous group of primary mitochondrial RC disease subjects both from control individuals and from subjects with pyruvate dehydrogenase deficiency.

Methods: Following IRB approval, 62 biochemical analyte concentrations or ratios were retrospectively analyzed in three well-defined and intentionally heterogeneous subject cohorts reflective of clinical practice: [1] Primary mitochondrial disease (n=19); [2] pyruvate dehydrogenase deficiency (n=4); and [3] controls (n=27). Blood analyte categories included comprehensive chemistry profile, creatine kinase, lipoprotein profile, lactate, pyruvate, and plasma amino acid profile. Non-parametric analyses were used to compare the median of each analyte level between cohorts.

Results: Disease cohorts differed significantly in their median levels of triglycerides, lactate, pyruvate, and multiple individual plasma amino acids. Primary mitochondrial disease was significantly discriminated at the cohort level from pyruvate dehydrogenase deficiency by greater pyruvate and alanine elevation in pyruvate dehydrogenase deficiency, as well as significantly increased branched chain amino acid (BCAA) levels and increased ratios of individual BCAAs to glutamate in mitochondrial disease. In addition, significant elevation of median blood triglyceride level was seen in the primary mitochondrial disease cohort.

Conclusions: Blood metabolite profile analysis can discriminate a heterogeneous cohort of primary mitochondrial disease both from controls and from pyruvate dehydrogenase deficiency. Elevated BCAA levels, either absolutely or when considered relative to the level of glutamate, are common metabolic sequelae of primary mitochondrial RC disease. Prospective study is needed to validate observed plasma metabolite alterations as a potential biomarker of disease both in larger cohorts and at the individual subject level.

Keywords: BCAAs; Branched chain amino acids; CK; Metabolites; PC; PDH; PDHc; Primary human mitochondrial disease; Pyruvate dehydrogenase deficiency; RC; branched chain amino acids; creatine kinase; pyruvate carboxylase; pyruvate dehydrogenase; pyruvate dehydrogenase complex; respiratory chain.


Conflict of interest statement

Competing Interest Statement: The authors have no competing interests to declare.

Figures

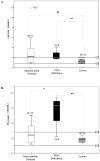
Figure 1
Figure 1. Blood lactate (A) and pyruvate (B) median concentrations in mitochondrial disease, PDHc deficiency, and control cohorts
Box plots depict results of analyses from median of all replicate values for each analyte per subject in each clinical cohort. The length of the box represents 25th to 75th percentile inter-quartile range, interior horizontal line represents median, and vertical lines issuing from the box extend to minimum and maximum values of the analysis variable. Values of upper and lower reference range bounds are indicated with horizontal black lines. Outlier values are indicated by an open circle and subject identifier, with detailed subject information per Supp File 1. N indicates number of subjects on whom laboratory data was available from each cohort. Statistical significance is indicated by #, p < 0.10; *, p < 0.05; and **, p < 0.01 as determined by non-parametric Mann-Whitney U test.
Figure 2
Figure 2. Plasma alanine and branched chain amino (BCAA) median concentrations in mitochondrial disease, PDHc deficiency, and control cohorts. (A) Alanine
Median plasma alanine was significantly elevated in both the mitochondrial disease (p = 0.006) and the PDHc deficiency cohort (p = 0.044) relative to controls. (B) Valine. Median plasma valine levels were within the reference range for all cohorts, except for two outliers in the mitochondrial disease cohort (Subject 1007 had FBXL4-based severe complex I–III deficiency with multi-systemic disease including chronic lactic acidosis and Subject 1097 died in infancy of Leigh syndrome with severe complex IV deficiency). However, valine was significantly increased in the mitochondrial disease cohort relative to PDHc deficiency cohort (p = 0.002), and was significantly decreased in the PDHc deficiency cohort relative to controls (p = 0.019). (C) Leucine. Median plasma leucine levels were elevated in the mitochondrial disease cohort above the upper limit of the reference range and relative to controls (p = 0.067), but significantly decreased in the PDHc deficiency cohort relative to both the mitochondrial disease cohort (p = 0.002) and controls (p = 0.044). (D) Isoleucine. Median plasma isoleucine levels were within the reference range for all cohorts, with marginally significant elevation in the mitochondrial disease cohort relative to controls (p = 0.056) and significant reduction in the PDHc deficiency cohort relative to the mitochondrial disease cohort (p = 0.047). Throughout all panels, box plot component interpretation is same as indicated in Fig 1 legend. Statistical significance is indicated by #, p < 0.10; *, p < 0.05; and **, p < 0.01 as determined by Mann-Whitney U test.
Figure 3
Figure 3. Ratio of cohort means for amino acids relative to glutamate, as well as ratio of alanine relative to either lysine or sum of phenylalanine and tyrosine, in mitochondrial disease and control cohorts
Bars convey the mean cohort ratio values for each individual amino acid ratio. A consistently higher mean ratio was observed for each of the respective amino acids to glutamate, as well as for the alanine-dependent ratios, in the mitochondrial disease cohort relative to controls.
Figure 4
Figure 4. Plasma triglyceride elevation in mitochondrial disease cohorts. (A) Percent change in median blood lipoprotein analytes by cohort
Plasma triglyceride median levels were significantly increased by 89% in the mitochondrial disease relative to control cohort (p = 0.02). Total and LDL cholesterol levels showed a non-significant increase in the mitochondrial disease cohort relative to controls. Numbers indicate percent change between cohort medians for each analyte relative to controls. Up and down arrows convey increase or decrease, respectively, relative to controls. *, p < 0.05 as determined by Mann-Whitney U test. (B) Plasma triglyceride boxplots by cohort. Median plasma triglyceride elevation exceeded the upper limit of the control range in the mitochondrial disease cohort. Box plot component interpretation is same as indicated in Fig 1 legend. *, p < 0.05 as determined by Mann-Whitney U test.

References

    1. Haas RH, Parikh S, Falk MJ, Saneto RP, Wolf NI, Darin N, Cohen BH. Mitochondrial disease: a practical approach for primary care physicians. Pediatrics. 2007;120:1326–1333. - PubMed
    1. Mordekar SR, Guthrie P, Bonham JR, Olpin SE, Hargreaves I, Baxter PS. The significance of reduced respiratory chain enzyme activities: clinical, biochemical and radiological associations. Eur J Paediatr Neurol. 2006;10:78–82. - PubMed
    1. Falk MJ. In: MITO 101 – Genetic Counseling for Mitochondrial Disease. Parikh S, DiMauro S, editors. United Mitochondrial Disease Foundation; 2008.
    1. Haas RH, Parikh S, Falk MJ, Saneto RP, Wolf NI, Darin N, Wong LJ, Cohen BH, Naviaux RK. The in-depth evaluation of suspected mitochondrial disease. Molec Genet Metab. 2008;94:16–37. - PMC - PubMed
    1. Rotig A. Genetic bases of mitochondrial respiratory chain disorders. Diab Metab. 2010;36:97–107. - PubMed

Publication types