. 2013 Sep 7;58(17):5851-66.
doi: 10.1088/0031-9155/58/17/5851. Epub 2013 Aug 6.

A mechanically coupled reaction-diffusion model for predicting the response of breast tumors to neoadjuvant chemotherapy

Affiliations

A mechanically coupled reaction-diffusion model for predicting the response of breast tumors to neoadjuvant chemotherapy

Jared A Weis et al. Phys Med Biol. .

Abstract

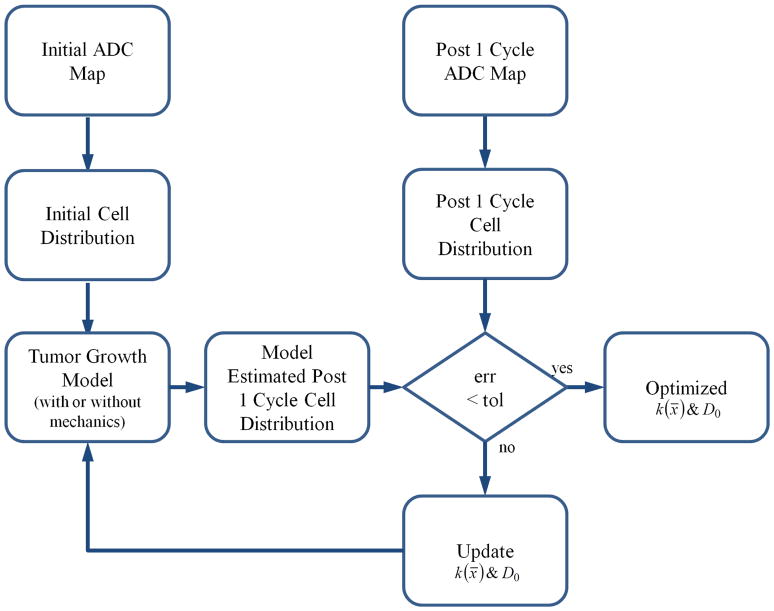
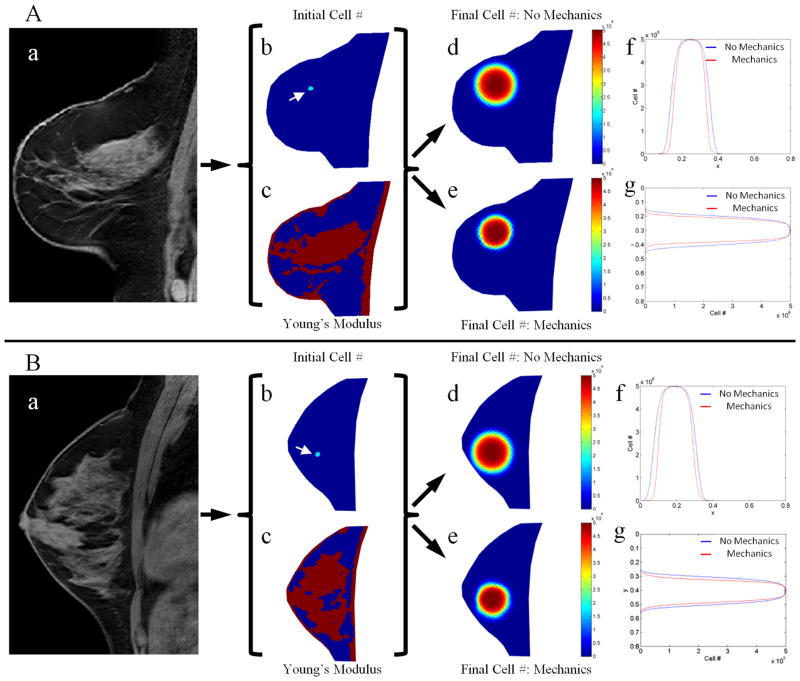
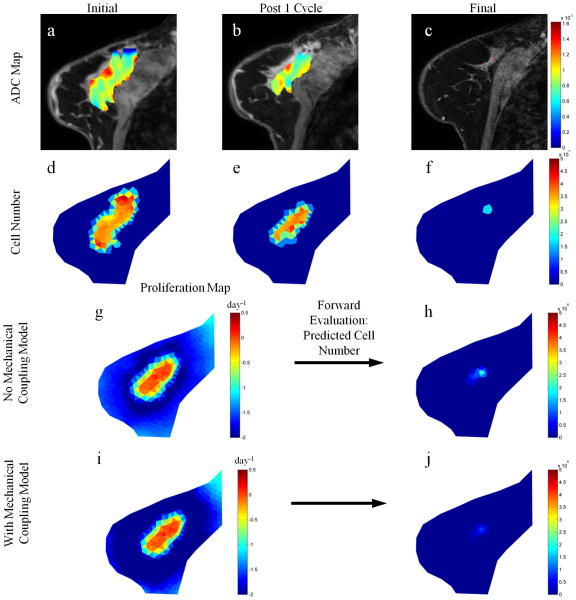
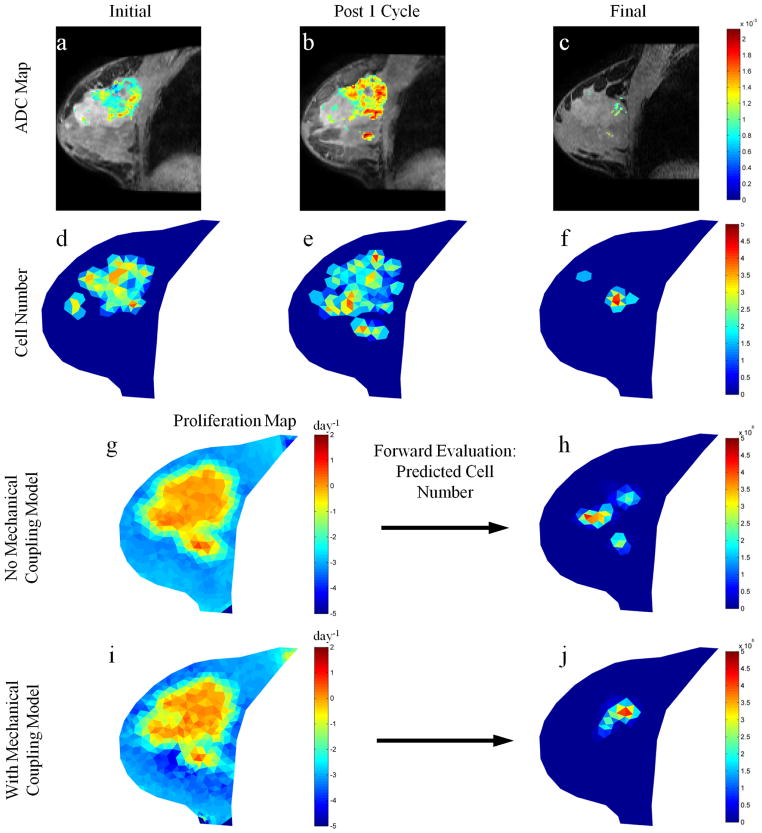
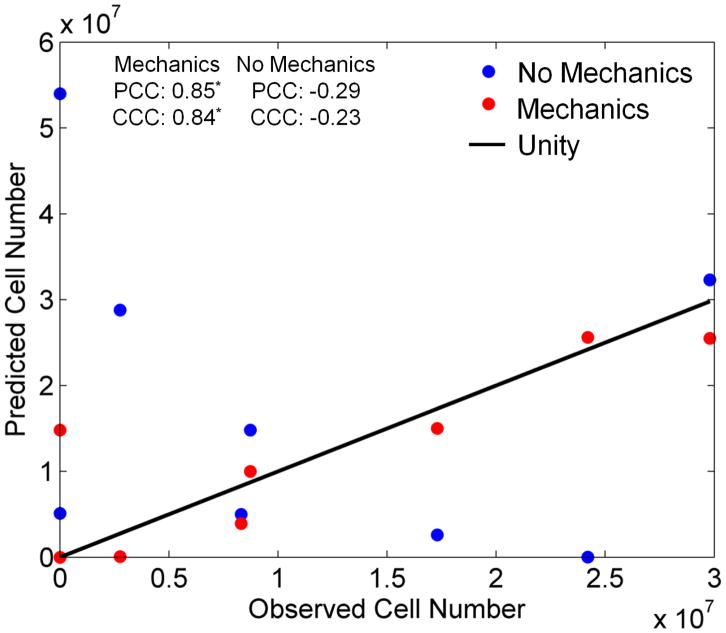
There is currently a paucity of reliable techniques for predicting the response of breast tumors to neoadjuvant chemotherapy. The standard approach is to monitor gross changes in tumor size as measured by physical exam and/or conventional imaging, but these methods generally do not show whether a tumor is responding until the patient has received many treatment cycles. One promising approach to address this clinical need is to integrate quantitative in vivo imaging data into biomathematical models of tumor growth in order to predict eventual response based on early measurements during therapy. In this work, we illustrate a novel biomechanical mathematical modeling approach in which contrast enhanced and diffusion weighted magnetic resonance imaging data acquired before and after the first cycle of neoadjuvant therapy are used to calibrate a patient-specific response model which subsequently is used to predict patient outcome at the conclusion of therapy. We present a modification of the reaction-diffusion tumor growth model whereby mechanical coupling to the surrounding tissue stiffness is incorporated via restricted cell diffusion. We use simulations and experimental data to illustrate how incorporating tissue mechanical properties leads to qualitatively and quantitatively different tumor growth patterns than when such properties are ignored. We apply the approach to patient data in a preliminary dataset of eight patients exhibiting a varying degree of responsiveness to neoadjuvant therapy, and we show that the mechanically coupled reaction-diffusion tumor growth model, when projected forward, more accurately predicts residual tumor burden at the conclusion of therapy than the non-mechanically coupled model. The mechanically coupled model predictions exhibit a significant correlation with data observations (PCC = 0.84, p < 0.01), and show a statistically significant >4 fold reduction in model/data error (p = 0.02) as compared to the non-mechanically coupled model.


Figures

Figure 1
Figure 1
Inverse modeling approach for characterizing tumor cell growth parameters. The initial and post one cycle ADC maps of the tumor are used to assign the tumor cell distributions at these time points as described by Eq. (2). Utilizing the tumor cell growth model either with or without mechanical coupling, a model estimated tumor cell distribution is compared to the observed distribution at the post 1 cycle time point. Levenberg-Marquardt optimization is then used to reconstruct a map of proliferation, k(), and the tumor cell diffusion coefficient, D0, iteratively until the model/data error is minimized below a preset tolerance. These parameters are then used to project the model forward in time to estimate tumor cellularity at a final time point.
Figure 2
Figure 2
Simulations of tumor growth with and without mechanical coupling for two different healthy subjects (Panels A and B). Tumor growth was simulated by using a T1 image (a) to seed a tumor at the initial time point (b, white arrows), generating a Young’s modulus map (c) by segmenting adipose (blue voxels) and fibroglandular tissue (red voxels), assuming growth parameters, and then projecting the model forward in time to a final time point either using a model without mechanical coupling (d) or with mechanical coupling (e). Horizontal (f) and vertical (g) line profiles through the center of the simulated tumor shows the spatial distribution of tumor cell number for both models, highlighting areas of restricted cell diffusion in the mechanics coupled model in areas of higher tissue elasticity.
Figure 3
Figure 3
Parameter reconstruction and forward model evaluation for a responsive tumor. ADC maps (for voxels satisfying the DCE-MRI enhancement threshold criteria) overlaid on T1 structural images at initial (a), post one cycle (b), and final (c) time points are converted to cell number distributions at respective time points (d–f). Parameter optimization between initial and post one cycle time points using a model without mechanical coupling, as described in Figure 1, is used to reconstruct tumor cell diffusion coefficient and a map of proliferation (g) which is used to predict the final cell number (h). This process is repeated for the model with mechanical coupling (i and j). The predicted final cell number for the model with mechanical coupling (j) is shown to have excellent agreement with the observed final cell number (f).
Figure 4
Figure 4
Parameter reconstruction and forward model evaluation for a non-responsive tumor. ADC maps (for voxels satisfying the DCE-MRI enhancement threshold criteria) overlaid on T1 structural images at initial (a), post one cycle (b), and final (c) time points are converted to cell number distributions at respective time points (d–f). Parameter optimization between initial and post one cycle time points using a model without mechanical coupling, as described in Figure 1, is used to reconstruct tumor cell diffusion coefficient and a map of proliferation (g) which is used to predict the final cell number (h). This process is repeated for the model with mechanical coupling (i and j). The predicted final cell number for the model with mechanical coupling (j) is shown to have better agreement with the observed final cell number (f).
Figure 5
Figure 5
Comparison of the observed and predicted total tumor cell number for each patient at the final point for the mechanics coupled (red circles) and non-mechanics coupled (blue circles) models. The line of unity is represented by the black line. The mechanics coupled model is shown to have better agreement with the observed cell number than the traditional non-mechanics coupled reaction-diffusion tumor growth model.

References

    1. Anderson AW, Xie J, Pizzonia J, Bronen RA, Spencer DD, Gore JC. Effects of cell volume fraction changes on apparent diffusion in human cells. Magn Reson Imaging. 2000;18:689–95. - PubMed
    1. Atuegwu NC, Arlinghaus LR, Li X, EBW, Chakravarthy AB, Yankeelov TE. Parameterizing the Logistic Model of Tumor Growth by DW-MRI and DCE-MRI to Predict Breast Tumor Cellularity During Neoadjuvant Chemotherapy. 19th Annual Meeting of ISMRM.2012a. - PMC - PubMed
    1. Atuegwu NC, Arlinghaus LR, Li X, Welch EB, Chakravarthy BA, Gore JC, Yankeelov TE. Integration of diffusion-weighted MRI data and a simple mathematical model to predict breast tumor cellularity during neoadjuvant chemotherapy. Magn Reson Med. 2011;66:1689–96. - PMC - PubMed
    1. Atuegwu NC, Colvin DC, Loveless ME, Xu L, Gore JC, Yankeelov TE. Incorporation of diffusion-weighted magnetic resonance imaging data into a simple mathematical model of tumor growth. Phys Med Biol. 2012b;57:225–40. - PMC - PubMed
    1. Barr RG. Real-Time Ultrasound Elasticity of the Breast Initial Clinical Results. Ultrasound Quarterly. 2010;26:61–6. - PubMed

Publication types