

Diffusion MRI of the developing cerebral cortical gray matter can be used to detect abnormalities in tissue microstructure associated with fetal ethanol exposure
- PMID: 23921100
- PMCID: PMC3815979
- DOI: 10.1016/j.neuroimage.2013.07.068
Diffusion MRI of the developing cerebral cortical gray matter can be used to detect abnormalities in tissue microstructure associated with fetal ethanol exposure
Abstract
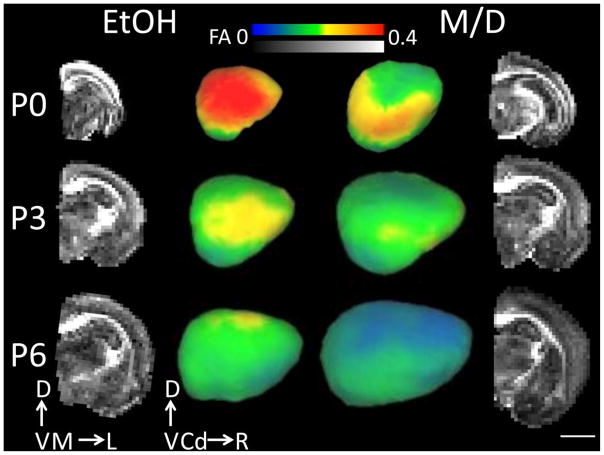
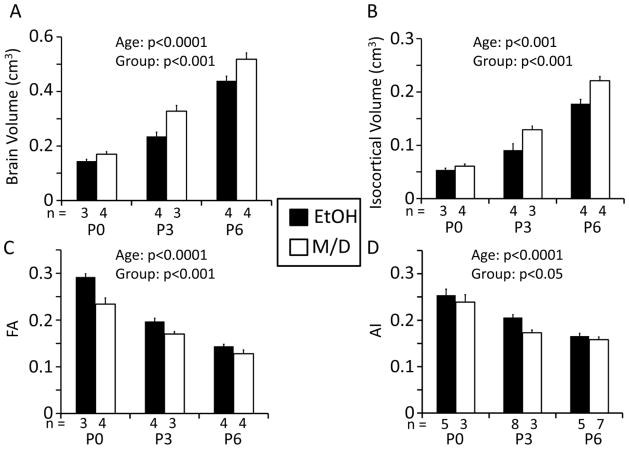
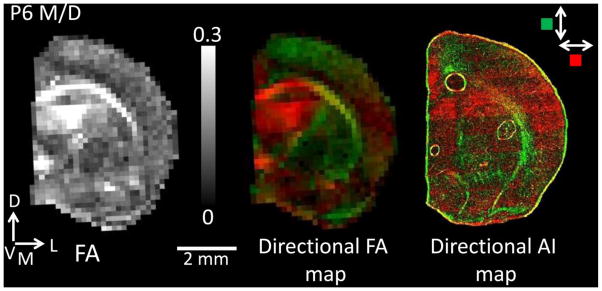
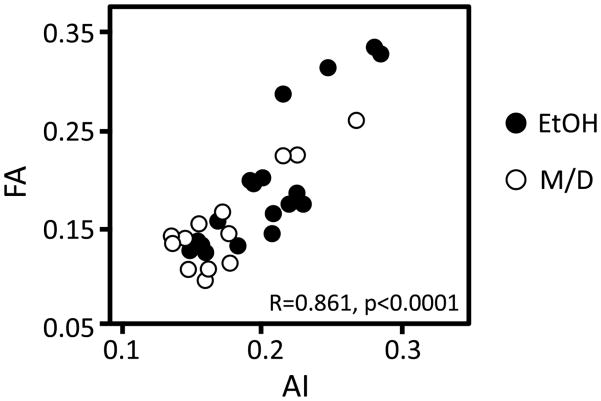
Fetal alcohol spectrum disorders (FASDs) comprise a wide range of neurological deficits that result from fetal exposure to ethanol (EtOH), and are the leading cause of environmentally related birth defects and mental retardation in the western world. One aspect of diagnostic and therapeutic intervention strategies that could substantially improve our ability to combat this significant problem would be to facilitate earlier detection of the disorders within individuals. Light microscopy-based investigations performed by several laboratories have previously shown that morphological development of neurons within the early-developing cerebral cortex is abnormal within the brains of animals exposed to EtOH during fetal development. We and others have recently demonstrated that diffusion MRI can be of utility for detecting abnormal cellular morphological development in the developing cerebral cortex. We therefore assessed whether diffusion tensor imaging (DTI) could be used to distinguish the developing cerebral cortices of ex vivo rat pup brains born from dams treated with EtOH (EtOH; 4.5 g/kg, 25%) or calorie-matched quantities of maltose/dextrin (M/D) throughout gestation. Water diffusion and tissue microstructure were investigated using DTI (fractional anisotropy, FA) and histology (anisotropy index, AI), respectively. Both FA and AI decreased with age, and were higher in the EtOH than the M/D group at postnatal ages (P)0, P3, and P6. Additionally, there was a significant correlation between FA and AI measurements. These findings provide evidence that disruptions in cerebral cortical development induced by EtOH exposure can be revealed by water diffusion anisotropy patterns, and that these disruptions are directly related to cerebral cortical differentiation.
© 2013.
Figures
Similar articles
-
The influence of fetal ethanol exposure on subsequent development of the cerebral cortex as revealed by magnetic resonance imaging.Alcohol Clin Exp Res. 2013 Jun;37(6):924-32. doi: 10.1111/acer.12051. Epub 2013 Feb 26. Alcohol Clin Exp Res. 2013. PMID: 23442156 Free PMC article.
-
Persistent myelin abnormalities in a third trimester-equivalent mouse model of fetal alcohol spectrum disorder.Alcohol Clin Exp Res. 2022 Jan;46(1):77-86. doi: 10.1111/acer.14752. Epub 2021 Dec 15. Alcohol Clin Exp Res. 2022. PMID: 34825395 Free PMC article.
-
Folding, But Not Surface Area Expansion, Is Associated with Cellular Morphological Maturation in the Fetal Cerebral Cortex.J Neurosci. 2017 Feb 22;37(8):1971-1983. doi: 10.1523/JNEUROSCI.3157-16.2017. Epub 2017 Jan 9. J Neurosci. 2017. PMID: 28069920 Free PMC article.
-
Using diffusion anisotropy to study cerebral cortical gray matter development.J Magn Reson. 2018 Jul;292:106-116. doi: 10.1016/j.jmr.2018.04.011. Epub 2018 Apr 26. J Magn Reson. 2018. PMID: 29705039 Free PMC article. Review.
-
The role of diffusion tensor imaging and fractional anisotropy in the evaluation of patients with idiopathic normal pressure hydrocephalus: a literature review.Neurosurg Focus. 2016 Sep;41(3):E12. doi: 10.3171/2016.6.FOCUS16192. Neurosurg Focus. 2016. PMID: 27581308 Review.
Cited by
-
Association of War Zone-Related Stress With Alterations in Limbic Gray Matter Microstructure.JAMA Netw Open. 2022 Sep 1;5(9):e2231891. doi: 10.1001/jamanetworkopen.2022.31891. JAMA Netw Open. 2022. PMID: 36112375 Free PMC article.
-
Repeated mild traumatic brain injury results in long-term white-matter disruption.J Cereb Blood Flow Metab. 2014 Apr;34(4):715-23. doi: 10.1038/jcbfm.2014.6. Epub 2014 Jan 29. J Cereb Blood Flow Metab. 2014. PMID: 24473478 Free PMC article.
-
Novel Detection of Placental Insufficiency by Magnetic Resonance Imaging in the Nonhuman Primate.Reprod Sci. 2018 Jan;25(1):64-73. doi: 10.1177/1933719117699704. Epub 2017 Mar 23. Reprod Sci. 2018. PMID: 28330415 Free PMC article.
-
Recent advancements in diffusion MRI for investigating cortical development after preterm birth-potential and pitfalls.Front Hum Neurosci. 2015 Jan 21;8:1066. doi: 10.3389/fnhum.2014.01066. eCollection 2014. Front Hum Neurosci. 2015. PMID: 25653607 Free PMC article. Review.
-
Alterations in the whole brain network organization after prenatal ethanol exposure.Eur J Neurosci. 2020 May;51(10):2110-2118. doi: 10.1111/ejn.14653. Epub 2020 Jan 11. Eur J Neurosci. 2020. PMID: 31855302 Free PMC article.
References
-
- Astley SJ, Aylward EH, Carmichael-Olson H, Kerns K, Brooks A, Coggins TE, Davies J, Dorn S, Gendler B, Jirikowic T, Kraegel P, Maravilla K, Richards T. Magnetic Resonance Imaging Outcomes From a Comprehensive Magnetic Resonance Study of Children With Fetal Alcohol Spectrum Disorders. Alcoholism: Clinical and Experimental Research. 2009;33(10):1671–1689. - PMC - PubMed
-
- Bock AS, Olavarria JF, Leigland LA, Taber EN, Jespersen SN, Kroenke CD. Diffusion Tensor Imaging Detects Early Cerebral Cortex Abnormalities in Neuronal Architecture Induced by Bilateral Neonatal Enucleation: An Experimental Model in the Ferret. Frontiers in Systems Neuroscience. 2010;4:1–11. - PMC - PubMed
-
- Bockhorst KH, Narayana PA, Liu R, Ahobila-Vijjula P, Ramu J, Kamel M, Wosik J, Bockhorst T, Hahn H, Hasan KM, Perez-Polo JR. Early Postnatal Development of Rat Brain: In Vivo Diffusion Tensor Imaging. Journal of Neuroscience Research. 2008;86:1520–1528. - PubMed
-
- Budde MD, Frank JA. Examining Brain Microstructure Using Structure Tensor Analysis of Histological Sections. Neuro Image. 2012;63(1):1–10. - PubMed
Publication types
MeSH terms
Grants and funding
- P51 OD011092/OD/NIH HHS/United States
- P51 RR000163/RR/NCRR NIH HHS/United States
- K01 RR000163/RR/NCRR NIH HHS/United States
- T32AA00746/AA/NIAAA NIH HHS/United States
- R01 NS070022/NS/NINDS NIH HHS/United States
- P30NS061800/NS/NINDS NIH HHS/United States
- R01NS070022/NS/NINDS NIH HHS/United States
- P30 NS061800/NS/NINDS NIH HHS/United States
- R01AA021981/AA/NIAAA NIH HHS/United States
- P50RR000163/RR/NCRR NIH HHS/United States
- T32 AG023477/AG/NIA NIH HHS/United States
- R01 AA021981/AA/NIAAA NIH HHS/United States
LinkOut - more resources
Full Text Sources
Other Literature Sources
Medical
Research Materials
