. 2013 Jul;123(7):2907-20.
doi: 10.1172/JCI67841. Epub 2013 Jun 10.

Metabolic stress regulates cytoskeletal dynamics and metastasis of cancer cells

Affiliations

Metabolic stress regulates cytoskeletal dynamics and metastasis of cancer cells

M Cecilia Caino et al. J Clin Invest. 2013 Jul.

Abstract

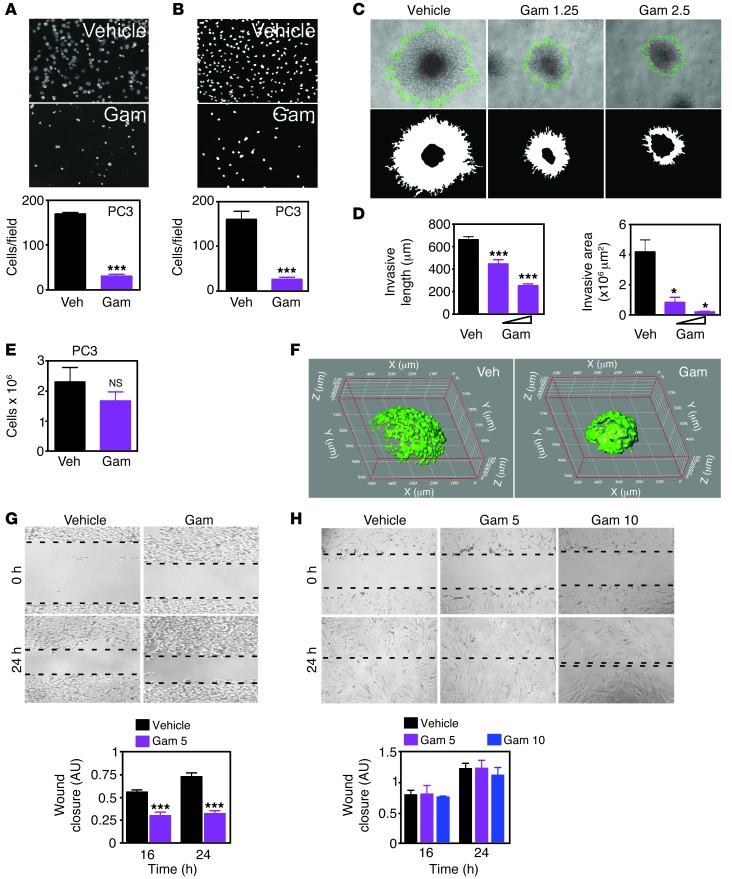
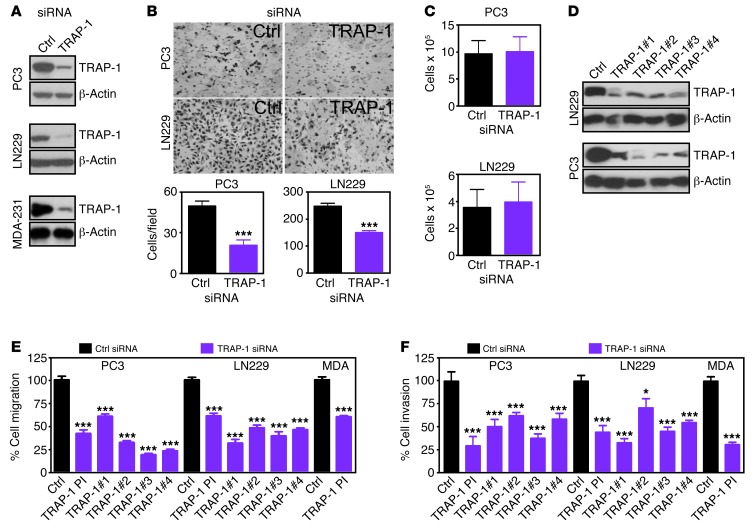
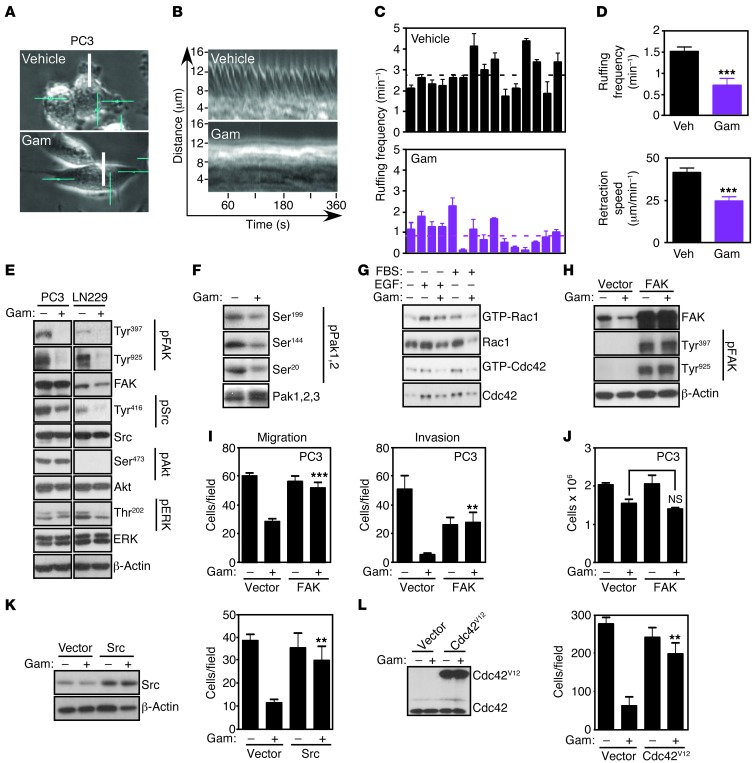
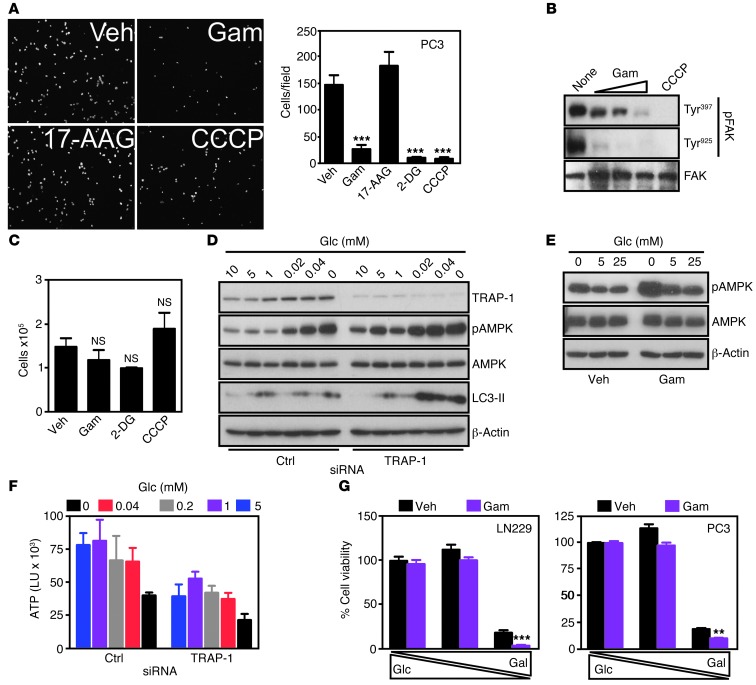
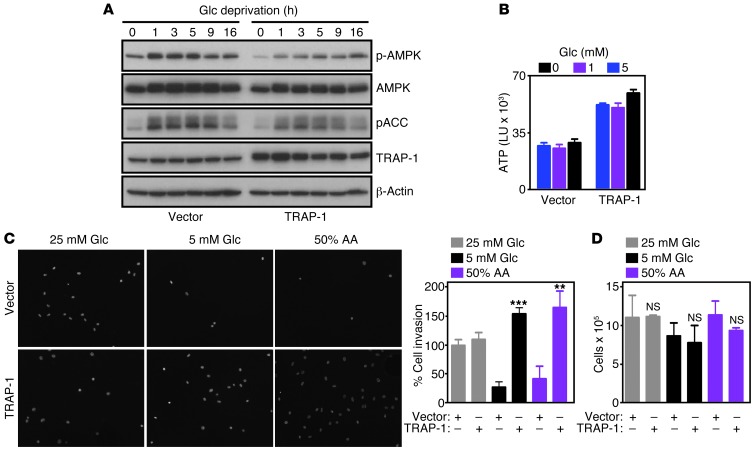
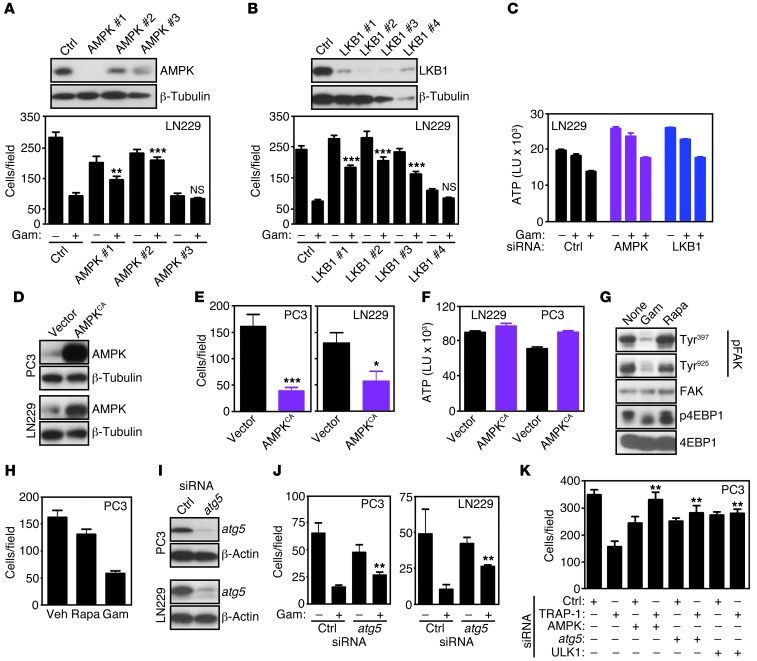
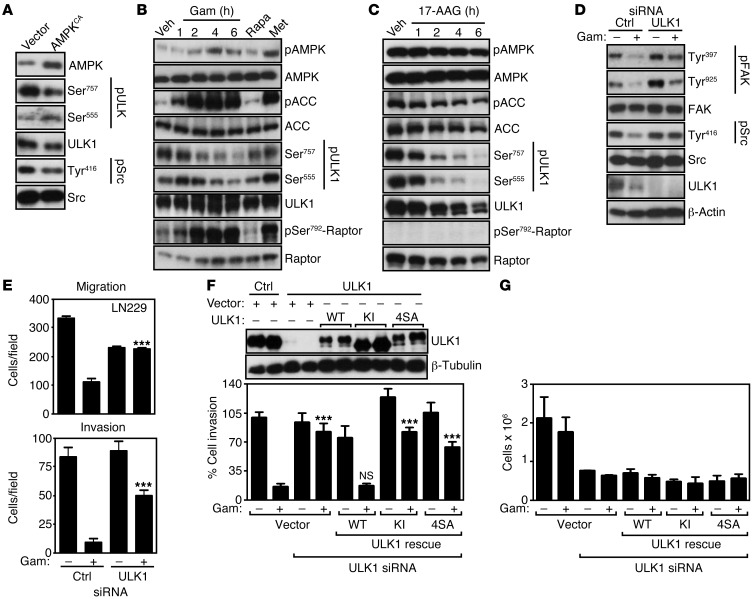
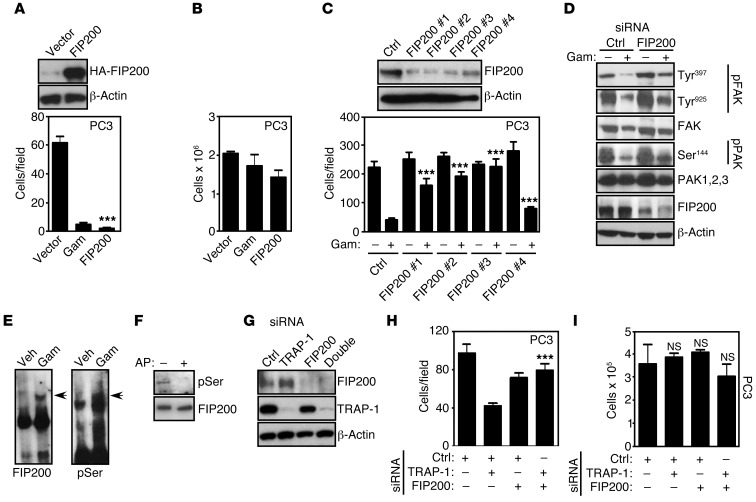
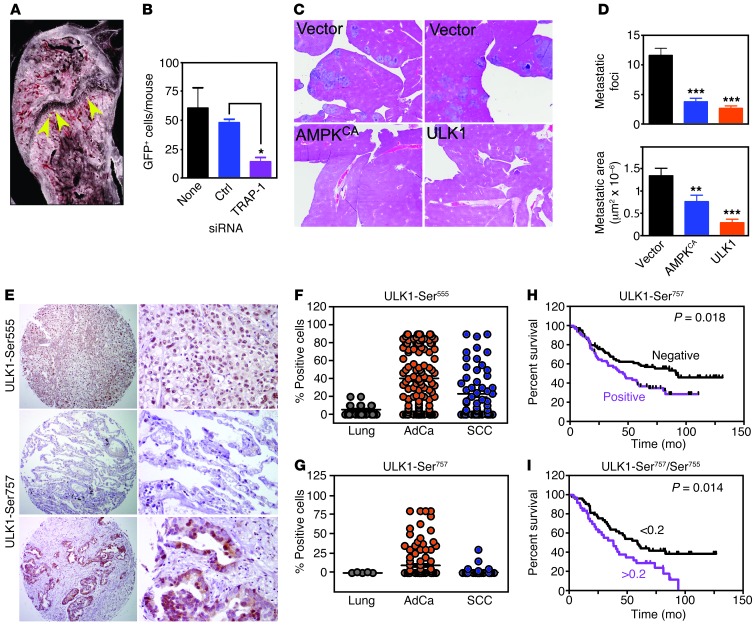
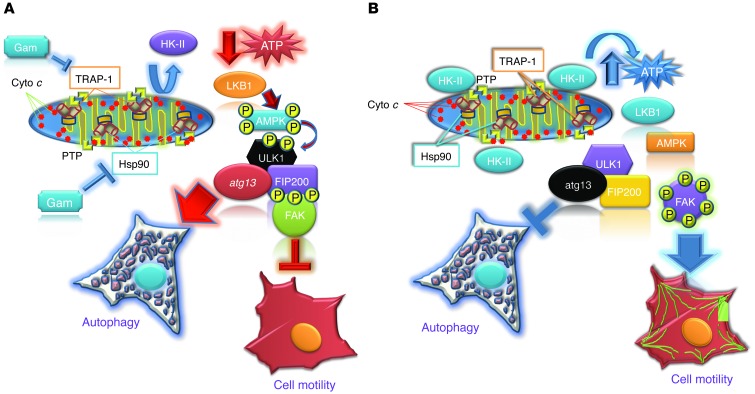
Metabolic reprogramming is an important driver of tumor progression; however, the metabolic regulators of tumor cell motility and metastasis are not understood. Here, we show that tumors maintain energy production under nutrient deprivation through the function of HSP90 chaperones compartmentalized in mitochondria. Using cancer cell lines, we found that mitochondrial HSP90 proteins, including tumor necrosis factor receptor-associated protein-1 (TRAP-1), dampen the activation of the nutrient-sensing AMPK and its substrate UNC-51-like kinase (ULK1), preserve cytoskeletal dynamics, and release the cell motility effector focal adhesion kinase (FAK) from inhibition by the autophagy initiator FIP200. In turn, this results in enhanced tumor cell invasion in low nutrients and metastatic dissemination to bone or liver in disease models in mice. Moreover, we found that phosphorylated ULK1 levels were correlated with shortened overall survival in patients with non-small cell lung cancer. These results demonstrate that mitochondrial HSP90 chaperones, including TRAP-1, overcome metabolic stress and promote tumor cell metastasis by limiting the activation of the nutrient sensor AMPK and preventing autophagy.


Figures

Figure 1
Figure 1. Gamitrinib inhibition of tumor cell motility.
(A and B) Gamitrinib-treated (Gam) (5 μM) PC3 cells were analyzed for cell migration (A) or invasion (B). Mean ± SEM (n = 3), ***P < 0.0001. (C and D) 3D organotypic LN229 spheroids treated with vehicle or Gamitrinib (1.25–2.5 μM) were analyzed by phase contrast microscopy (C, top), and mask-inverted images (C, bottom) were used to quantify the length and area between the core and the invasive cores (D). Mean ± SEM (n = 3), *P = 0.0171–0.0295; ***P < 0.0001. Original magnification, ×20 (A and B); ×4 (C). (E) PC3 cells were treated with vehicle or Gamitrinib as in A and B and analyzed for cell proliferation by direct cell counting. Mean ± SEM (n = 3). (F) LN229 spheroids were stained with calcein-AM (live cells, green) and Topro-3 (dead cells, blue) and analyzed by 2-photon microscopy. Original magnification, ×20. (G) PC3 cells were treated with vehicle or Gamitrinib (5 μM) and analyzed in a wound-closure assay after 16 or 24 hours. Representative micrographs (top) and quantification of cell motility (bottom) are shown. The leading front of cell migration is indicated by dotted lines. Mean ± SEM (n = 3), ***P < 0.0001–0.0004. Original magnification, ×5. (H) The experimental conditions are the same as in G except that normal human MRC-5 lung fibroblasts treated with vehicle or 2 concentrations of Gamitrinib (5–10 μM) were analyzed in a wound-closure assay after 16 or 24 hours. Original magnification, ×10.
Figure 2
Figure 2. Mitochondrial chaperone TRAP-1 regulation of tumor cell motility.
(A and B) The indicated tumor cell lines were transfected with control nontargeting (Ctrl) or TRAP-1–directed pooled siRNA and analyzed by Western blotting (A) or cell migration (B). Top panels, phase contrast microscopy. Bottom panels, quantification of cell migration. Mean ± SEM (n = 3). ***P < 0.0001. Original magnification, ×20. (C) The indicated tumor cell types were transfected with control siRNA or siRNA directed to TRAP-1 and analyzed for cell proliferation by direct cell counting. Mean ± SEM (n = 3). (D) The indicated tumor cell lines were transfected with control nontargeting siRNA or individual siRNA sequences to TRAP-1 and analyzed by Western blotting. (E and F) The indicated tumor cell types were transfected with control siRNA, individual siRNA sequences (nos. 1–4) to TRAP-1, or pooled siRNA (Pl) to TRAP-1 and analyzed for cell migration (E) or invasion (F) after 6 or 16 hours, respectively. Mean ± SEM (n = 3). *P = 0.031; ***P < 0.0001.
Figure 3
Figure 3. Cellular requirements of mitochondrial Hsp90-directed tumor cell migration.
(A) Representative images from video sequences of FBS-stimulated PC3 cells treated with vehicle or Gamitrinib (5 μM) and analyzed by real-time quantification of membrane ruffling (lamellipodia growth and retraction) by stroboscopic imaging. Scale bars: 16.2 μm length. (B) Stroboscopic images representing an area of analysis (white line in A) for the indicated time intervals. (C) Quantification of membrane ruffling frequency. Each bar corresponds to an individual cell. Broken lines, average values. (D) Average ruffling frequency (top), and quantification of speed of lamellipodia retraction in μm/min (bottom). Mean ± SEM (n = 15). ***P < 0.0001. (E and F) Tumor cells treated with (+) or without (–) Gamitrinib (5 μM) were analyzed by Western blotting. p, phosphorylated. (G) Serum-starved A549 cells were stimulated with EGF (100 ng/ml, 2 minutes) or FBS (10%, 5 minutes), treated with (+) or without (–) Gamitrinib (5 μM), and analyzed for GTP-bound Rac1 or Cdc42. (H) PC3 cells were transfected with vector or cDNA encoding FAK and analyzed by Western blotting. p, phosphorylated. (I and J), PC3 cells transfected as in (H) and treated with (+) or without (–) Gamitrinib (5 μM) were analyzed for cell migration (left) or invasion (right) (I), or cell proliferation (J). Mean ± SEM (n = 3), ***P < 0.0001. (K and L) PC3 cells were transfected with vector or cDNAs encoding Src (K) or constitutively active Cdc42V12 mutant (L) and analyzed by Western blotting (left) or cell migration (right) in the presence (+) or absence (–) of Gamitrinib. Mean ± SEM (n = 3). **P = 0.0094.
Figure 4
Figure 4. Metabolic stress control of tumor cell invasion.
(A) PC3 cells were treated with Gamitrinib (5 μM), 17-AAG (5 μM), or CCCP (12.5 μM, or 2-DG (25 mM) and analyzed for cell invasion. Left, representative image of stained nuclei. Right, quantification. Mean ± SEM (n = 3). ***P < 0.0001. Original magnification, ×20. (B) PC3 cells were treated with Gamitrinib (1.25–5 μM) or CCCP (12.5 μM) and analyzed by Western blotting. (C) PC3 cells were treated as in A and analyzed for cell proliferation. Mean ± SEM (n = 3). (D) LN229 cells were transfected with control siRNA or TRAP-1–directed siRNA and analyzed by Western blotting with or without glucose (Glc). (E) LN229 cells were treated with vehicle or Gamitrinib (5 μM) and analyzed by Western blotting with or without glucose. (F) LN229 cells were transfected with control or TRAP-1–directed siRNA and analyzed for ATP production in the presence of the indicated concentrations of glucose. LU, luciferase units. Mean ± SEM (n = 3). (G) LN229 (left) or PC3 (right) cells were treated with vehicle or Gamitrinib (5 μM), and analyzed for cell viability. Bars correspond to conditions of 100% glucose/0% galactose (Gal); 50% glucose/50% galactose, or 0% glucose/100% galactose. Mean ± SEM (n = 3), **P = 0.0018; ***P = 0.0007.
Figure 5
Figure 5. Metabolic stress control of cell motility.
(A) NIH3T3 fibroblasts were transfected with vector or TRAP-1 cDNA, and analyzed by Western blotting. (B) The experimental conditions are as in A except that control or TRAP-1–transfected cells were analyzed for ATP production at the indicated glucose concentrations. LU, luciferase units. Mean ± SEM (n = 3). (C) NIH3T3 fibroblasts transfected as in A were analyzed by DAPI staining of invading cells under the indicated conditions. Right, quantification of cell invasion. Mean ± SEM (n = 3). **P = 0.0029; ***P < 0.0001. (D) NIH3T3 fibroblasts transfected as in A were analyzed for cell proliferation. Mean ± SEM (n = 3). Original magnification, ×20.
Figure 6
Figure 6. LKB1/AMPK regulation of tumor cell motility.
(A and B) LN229 cells were transfected with individual siRNA sequences to AMPK (A) or LKB1 (B) and analyzed by Western blotting (top), cell migration (A), or invasion (B) with (+) or without (–) Gamitrinib (5 μM). Mean ± SEM (n = 3). **P = 0.0011; ***P < 0.0001. (C) LN229 cells were transfected with control siRNA or individual siRNA sequences to AMPK or LKB1 and analyzed for ATP production with (+) or without (–) Gamitrinib (5–10 μM). Mean of replicates of a representative experiment out of at least 3 independent determinations. (D and E) Tumor cell types transfected with control or constitutively active AMPK (AMPKCA) cDNA were analyzed by Western blotting (D) or cell invasion (E). Mean ± SEM (n = 3). *P = 0.0295; ***P < 0.001. (F) The experimental conditions are as in D, except that transfected LN229 or PC3 cells were analyzed for ATP production. Mean ± SEM (n = 3). (G and H) PC3 cells were treated with rapamycin (Rapa, 0.1 μM) or Gamitrinib (5 μM), and analyzed by Western blotting for differential phosphorylation of the indicated kinases (G) or cell migration after 6 hours (H). Mean ± SEM (n = 3). (I and J) The indicated tumor cell lines were transfected with control siRNA or atg5-directed siRNA and analyzed by Western blotting (I) or cell invasion (J). Mean ± SEM (n = 3). **P < 0.001. (K) PC3 cells were transfected with control nontargeting siRNA or TRAP-1–directed siRNA alone or in combination with siRNA sequences directed to AMPK, atg5, or ULK1 and analyzed for cell migration. Mean ± SEM (n = 3). **P = 0.0022.
Figure 7
Figure 7. ULK1 control of tumor cell motility.
(A) PC3 cells were transfected with vector or constitutively active AMPK cDNA (AMPKCA) and analyzed by Western blotting for changes in phosphorylation of the indicated kinases. (B) PC3 cells were treated with vehicle, rapamycin (0.1 μM for 1 hour), metformin (5 mM for 6 hours), or Gamitrinib (5 μM for the indicated time intervals) and analyzed by Western blotting. (C) PC3 cells were treated with 17-AAG (5 μM) for the indicated time intervals and analyzed by Western blotting. (D) PC3 cells transfected with control or ULK1-directed siRNA were treated with (+) or without (–) Gamitrinib (5 μM) and analyzed by Western blotting for differential phosphorylation of the indicated kinases. (E) LN229 cells were transfected as in D and analyzed for cell migration (top) or invasion (bottom) in the presence (+) or absence (–) of Gamitrinib. Mean ± SEM (n = 3). ***P < 0.0001. (F) PC3 cells transfected with control siRNA or ULK1-directed siRNA were reconstituted with siRNA-insensitive WT ULK1, KI ULK1, or non-AMPK phosphorylatable ULK1 (4SA) cDNA and analyzed by Western blotting (top) or cell invasion (bottom). Mean ± SEM (n = 3). ***P < 0.0001. (G) The experimental conditions are as in F, except that transfected and reconstituted PC3 cells were analyzed for cell proliferation by direct cell counting. Mean ± SEM (n = 3).
Figure 8
Figure 8. FIP200 regulation of tumor cell motility.
(A) PC3 cells were transfected with vector or FIP200 cDNA and analyzed by Western blotting (top) or cell invasion (bottom). Mean ± SEM (n = 3). ***P < 0.0001. (B) PC3 cells transfected as in A were analyzed for cell proliferation by direct cell counting. Mean ± SEM (n = 3). (C) PC3 cells were transfected with control siRNA or the indicated individual siRNA sequences to FIP200 and analyzed by Western blotting (top) or cell invasion (bottom) in the presence (+) or absence (–) of Gamitrinib. Mean ± SEM (n = 3). ***P < 0.0001. (D) PC3 cells were transfected with control siRNA or FIP200-directed siRNA and analyzed by Western blotting in the presence (+) or absence (–) of Gamitrinib. (E) PC3 cells were treated with vehicle or Gamitrinib (5 μM) and analyzed for gel mobility shift by Western blotting using antibodies to FIP200 (left) or pan-phosphorylated Ser residues (right). Arrows, phosphorylated isotypes of FIP200. (F) FIP200 immune complexes precipitated from Gamitrinib-treated PC3 cells were incubated with (+) or without (–) alkaline phosphatase (AP) and analyzed by Western blotting. (G) PC3 cells were transfected with control siRNA, FIP200- or TRAP-1–directed siRNA alone or in combination and analyzed by Western blotting. (H and I) The PC3 cells transfected as in G were analyzed for cell migration (H) or cell proliferation by direct cell counting (I). Mean ± SEM (n = 3). ***P < 0.0001.
Figure 9
Figure 9. Metabolic control of metastasis.
(A) Representative image of single GFP-labeled breast AdCa MDA-231 cells (arrows) lodged near the growth cartilage of the femora and tibiae of inoculated CB17 SCID mice. Original magnification, ×100 (left). (B) Quantification of bone homing of GFP-labeled MDA-231 cells transfected with control siRNA or TRAP-1–directed siRNA. Mean ± SEM (5 animals/group). *P = 0.034. None, untransfected cells. (C) Representative histologic image of livers from animals injected intrasplenically with H460 cells transfected with vector, AMPKCA or ULK1 cDNA. Original magnification, ×1. (D) Quantification of number of metastatic foci (top) and metastatic surface area (bottom) per each condition tested. Mean ± SEM (3–4 animals/group). ***P < 0.0001; **P = 0.009. (E) Representative images of immunohistochemical expression of ULK1-Ser555 or ULK1-Ser757 in NSCLC TMA sections. Middle panels, representative sections of normal lung weakly positive (<10% stained cells) for ULK1-Ser757 expression. Original magnification, ×50 (left panels); ×200 (right panels). (F and G) Summary of ULK1-Ser555 (F) or ULK1-Ser757 (G) immunoreactivity in NSCLC patients. The analysis parameters are as follows: (F) ULK1-Ser555, n = 173; positive, 98 (AdCa), 40 (SCC); negative, 20 (AdCa), 15 (SCC); (G) ULK1-Ser757 (cytosolic reactivity), n = 178; positive, 38 (AdCa), 5 (SCC); negative, 83 (AdCa), 52 (SCC). (H and I) Kaplan-Meier survival curves of NSCLC patients according to expression of Ser757-phosphorylated ULK1 (H) or differential ratio (cutoff, 0.2) of Ser757/Ser555- phosphorylated ULK1 (I).
Figure 10
Figure 10. Schematic representation of bioenergetics stress control of tumor cell motility.
(A) Inhibition of mitochondrial Hsp90-directed protein folding by Gamitrinib induces a bioenergetics imbalance due to detachment of HK-II from the mitochondrial outer membrane. In turn, this results in decreased ATP production, activation of the energy sensor LKB-1-AMPK kinase cascade, and AMPK-dependent phosphorylation of ULK1, a component of the upstream autophagy initiator complex. Active ULK1 mediates phosphorylation and activation of FIP200, which in turn inhibits FAK-directed tumor cell motility and metastasis. (B) Despite limited nutrient availability, mitochondrial Hsp90s maintain HK-II tethered to the organelle outer membrane and potentially maintain a residual mitochondrial oxidative phosphorylation capacity. In turn, energy produced under these conditions is sufficient to prevent activation of LKB1/AMPK signaling, blocking the formation of a phosphorylation-dependent, active ULK1-FIP200-atg13 complex. This prevents the initiation of autophagy and releases FAK from the inhibitory effect of phosphorylated FIP200, promoting cell motility and metastasis. PTP, permeability transition pore; cyto c, cytochrome c.

Similar articles

Cited by

References

    1. Kroemer G, Pouyssegur J. Tumor cell metabolism: cancer’s Achilles’ heel. Cancer Cell. 2008;13(6):472–482. doi: 10.1016/j.ccr.2008.05.005. - DOI - PubMed
    1. Buchakjian MR, Kornbluth S. The engine driving the ship: metabolic steering of cell proliferation and death. Nat Rev Mol Cell Biol. 2010;11(10):715–727. doi: 10.1038/nrm2972. - DOI - PubMed
    1. Koppenol WH, Bounds PL, Dang CV. Otto Warburg’s contributions to current concepts of cancer metabolism. Nat Rev Cancer. 2011;11(5):325–337. doi: 10.1038/nrc3038. - DOI - PubMed
    1. Vander Heiden MG, Cantley LC, Thompson CB. Understanding the Warburg effect: the metabolic requirements of cell proliferation. Science. 2009;324(5930):1029–1033. doi: 10.1126/science.1160809. - DOI - PMC - PubMed
    1. Gordan JD, et al. HIF-alpha effects on c-Myc distinguish two subtypes of sporadic VHL-deficient clear cell renal carcinoma. Cancer Cell. 2008;14(6):435–446. doi: 10.1016/j.ccr.2008.10.016. - DOI - PMC - PubMed

Publication types

MeSH terms