

HDAC3 is essential for DNA replication in hematopoietic progenitor cells
- PMID: 23921131
- PMCID: PMC3696547
- DOI: 10.1172/JCI60806
HDAC3 is essential for DNA replication in hematopoietic progenitor cells
Abstract
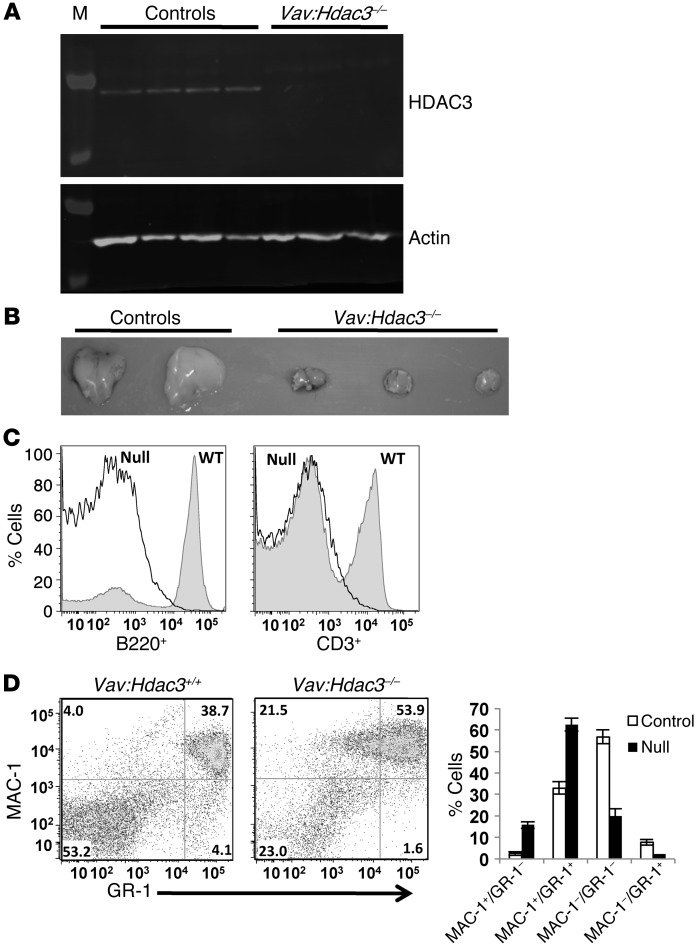
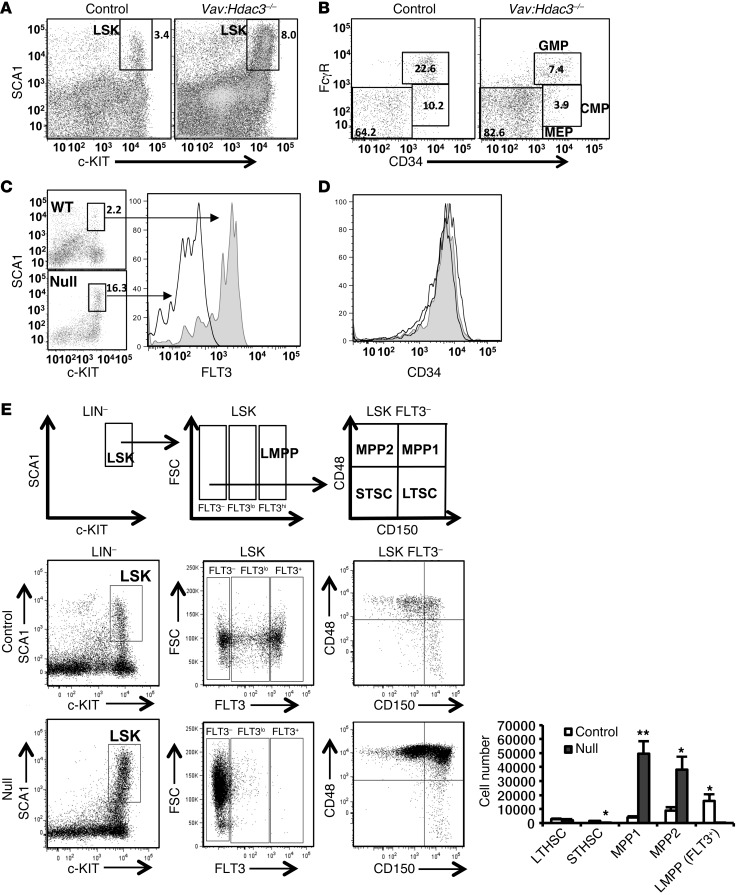
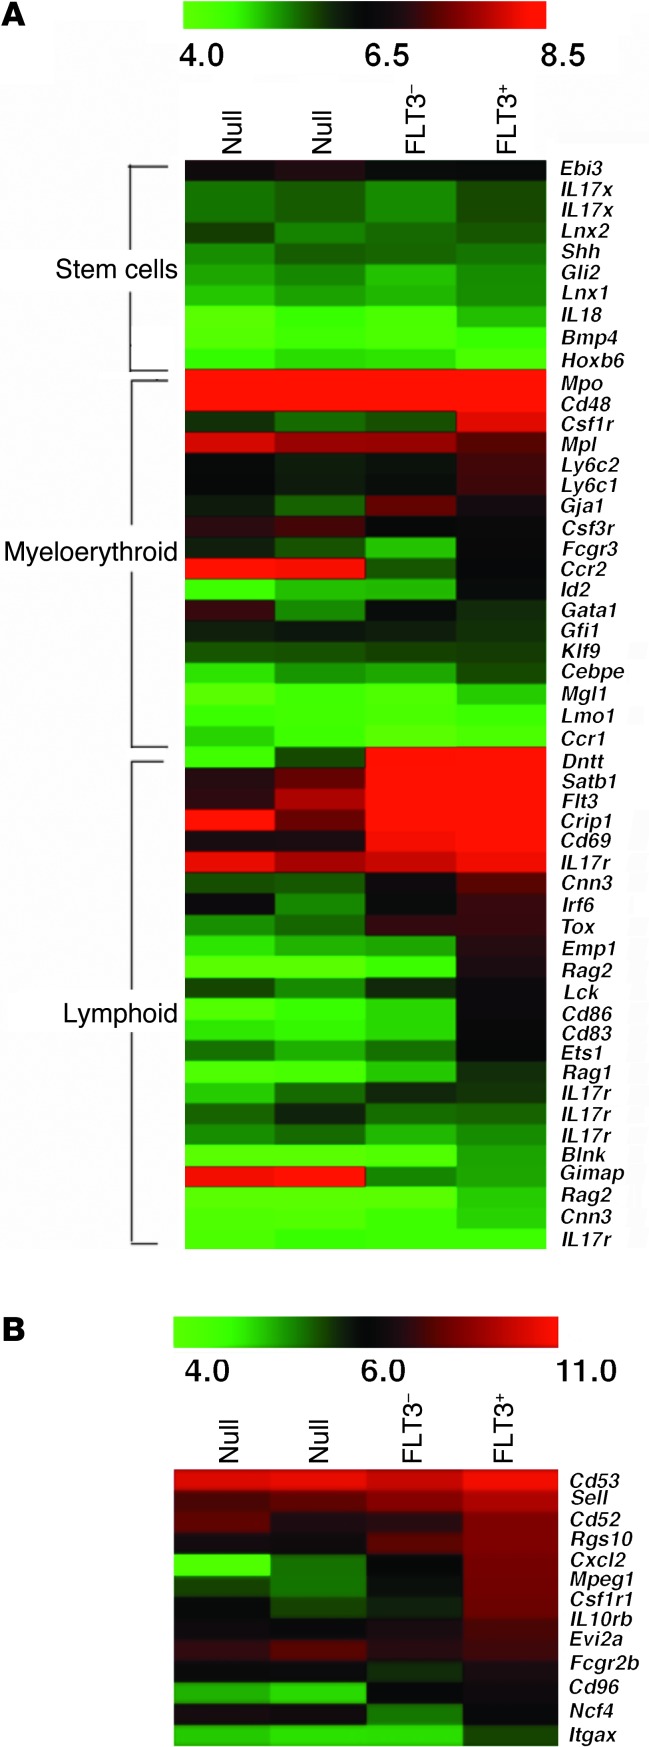
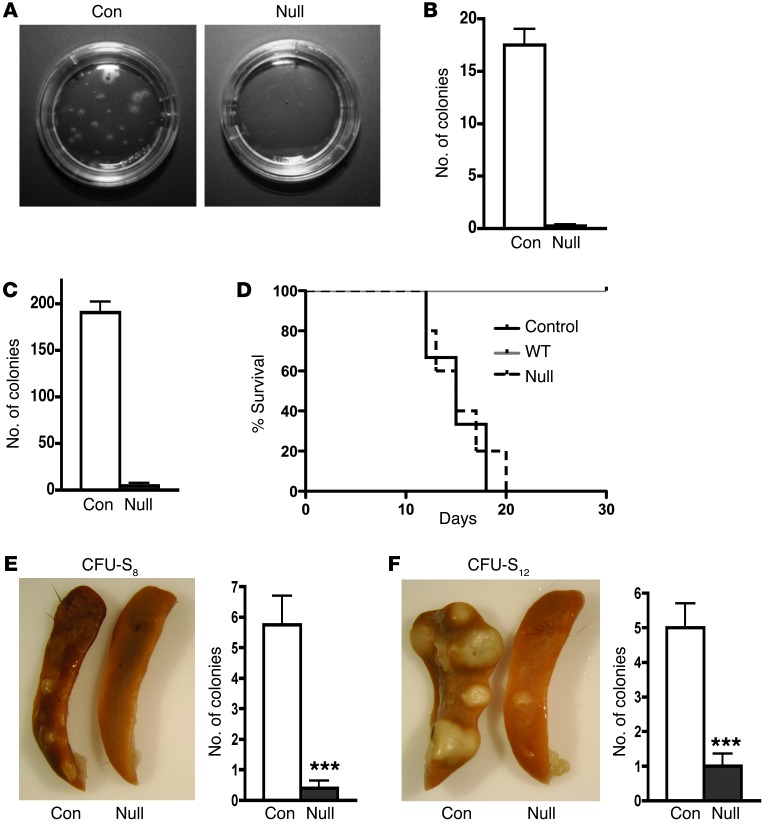
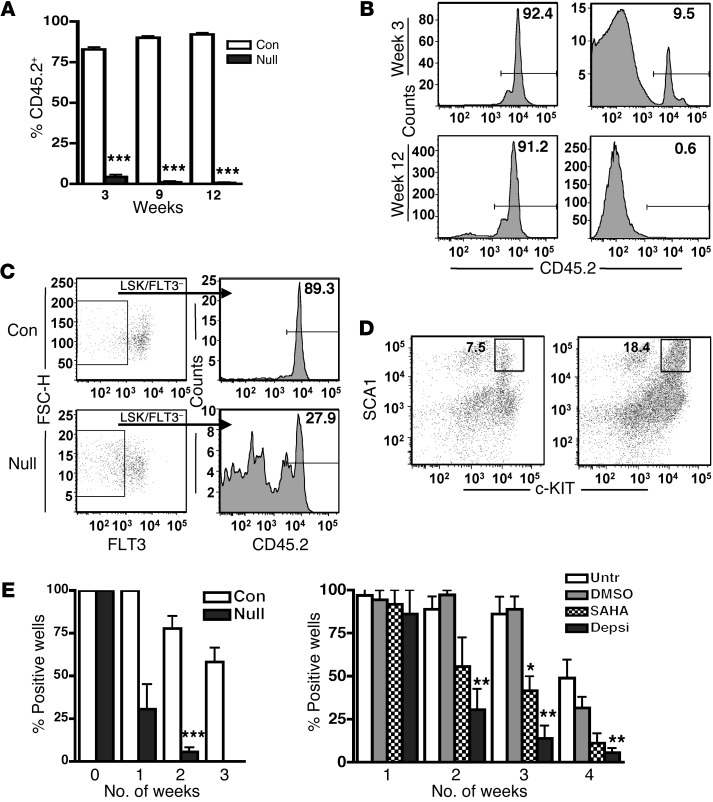
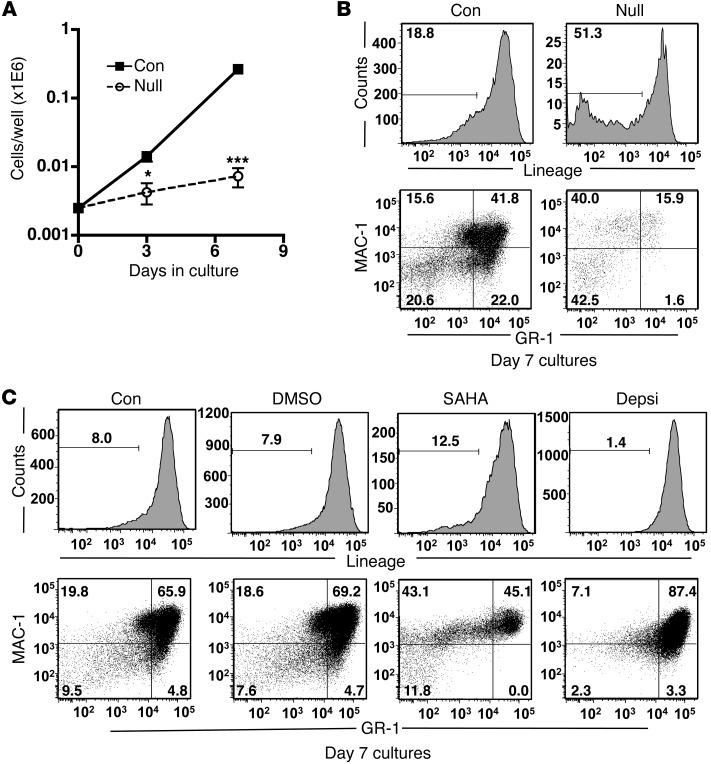
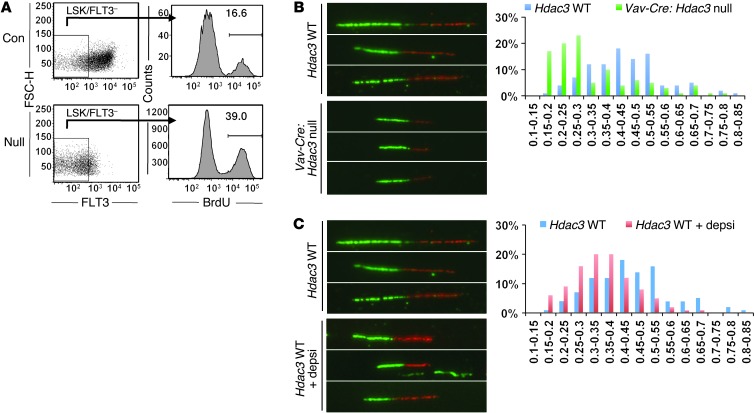
Histone deacetylase 3 (HDAC3) contributes to the regulation of gene expression, chromatin structure, and genomic stability. Because HDAC3 associates with oncoproteins that drive leukemia and lymphoma, we engineered a conditional deletion allele in mice to explore the physiological roles of Hdac3 in hematopoiesis. We used the Vav-Cre transgenic allele to trigger recombination, which yielded a dramatic loss of lymphoid cells, hypocellular bone marrow, and mild anemia. Phenotypic and functional analysis suggested that Hdac3 was required for the formation of the earliest lymphoid progenitor cells in the marrow, but that the marrow contained 3-5 times more multipotent progenitor cells. Hdac3(-/-) stem cells were severely compromised in competitive bone marrow transplantation. In vitro, Hdac3(-/-) stem and progenitor cells failed to proliferate, and most cells remained undifferentiated. Moreover, one-third of the Hdac3(-/-) stem and progenitor cells were in S phase 2 hours after BrdU labeling in vivo, suggesting that these cells were impaired in transit through the S phase. DNA fiber-labeling experiments indicated that Hdac3 was required for efficient DNA replication in hematopoietic stem and progenitor cells. Thus, Hdac3 is required for the passage of hematopoietic stem/progenitor cells through the S phase, for stem cell functions, and for lymphopoiesis.
Figures
Similar articles
-
Histone deacetylases differentially regulate the proliferative phenotype of mouse bone marrow stromal and hematopoietic stem/progenitor cells.Stem Cell Res. 2016 Jul;17(1):170-80. doi: 10.1016/j.scr.2016.07.001. Epub 2016 Jul 2. Stem Cell Res. 2016. PMID: 27394013
-
Histone Deacetylase 3 Deletion in Mesenchymal Progenitor Cells Hinders Long Bone Development.J Bone Miner Res. 2017 Dec;32(12):2453-2465. doi: 10.1002/jbmr.3236. Epub 2017 Sep 18. J Bone Miner Res. 2017. PMID: 28782836 Free PMC article.
-
The epigenetic regulator CXXC finger protein 1 is essential for murine hematopoiesis.PLoS One. 2014 Dec 3;9(12):e113745. doi: 10.1371/journal.pone.0113745. eCollection 2014. PLoS One. 2014. PMID: 25470594 Free PMC article.
-
Deacetylase activity of histone deacetylase 3 is required for productive VDJ recombination and B-cell development.Proc Natl Acad Sci U S A. 2017 Aug 8;114(32):8608-8613. doi: 10.1073/pnas.1701610114. Epub 2017 Jul 24. Proc Natl Acad Sci U S A. 2017. PMID: 28739911 Free PMC article.
-
Hematopoietic Multipotent Progenitors and Plasma Cells: Neighbors or Roommates in the Mouse Bone Marrow Ecosystem?Front Immunol. 2021 Apr 15;12:658535. doi: 10.3389/fimmu.2021.658535. eCollection 2021. Front Immunol. 2021. PMID: 33936091 Free PMC article. Review.
Cited by
-
BRPF1 is essential for development of fetal hematopoietic stem cells.J Clin Invest. 2016 Sep 1;126(9):3247-62. doi: 10.1172/JCI80711. Epub 2016 Aug 8. J Clin Invest. 2016. PMID: 27500495 Free PMC article.
-
Histone deacetylase 3 controls a transcriptional network required for B cell maturation.Nucleic Acids Res. 2019 Nov 18;47(20):10612-10627. doi: 10.1093/nar/gkz816. Nucleic Acids Res. 2019. PMID: 31586401 Free PMC article.
-
The NCOR-HDAC3 co-repressive complex modulates the leukemogenic potential of the transcription factor ERG.Nat Commun. 2023 Sep 21;14(1):5871. doi: 10.1038/s41467-023-41067-2. Nat Commun. 2023. PMID: 37735473 Free PMC article.
-
Targeting DNA Repair and Chromatin Crosstalk in Cancer Therapy.Cancers (Basel). 2021 Jan 20;13(3):381. doi: 10.3390/cancers13030381. Cancers (Basel). 2021. PMID: 33498525 Free PMC article. Review.
-
In vivo screening characterizes chromatin factor functions during normal and malignant hematopoiesis.Nat Genet. 2023 Sep;55(9):1542-1554. doi: 10.1038/s41588-023-01471-2. Epub 2023 Aug 14. Nat Genet. 2023. PMID: 37580596 Free PMC article.
References
Publication types
MeSH terms
Substances
Grants and funding
- P30 CA068485/CA/NCI NIH HHS/United States
- F30 HL093993/HL/NHLBI NIH HHS/United States
- R01-CA109355/CA/NCI NIH HHS/United States
- F32 CA138091/CA/NCI NIH HHS/United States
- P30DK58404/DK/NIDDK NIH HHS/United States
- R01-CA64140/CA/NCI NIH HHS/United States
- R01 CA164605/CA/NCI NIH HHS/United States
- F30HL093993/HL/NHLBI NIH HHS/United States
- R01-CA164605/CA/NCI NIH HHS/United States
- P30CA68485/CA/NCI NIH HHS/United States
- T32 CA009582/CA/NCI NIH HHS/United States
- 5F32HL090259/HL/NHLBI NIH HHS/United States
- P30 DK058404/DK/NIDDK NIH HHS/United States
- R01 CA136933/CA/NCI NIH HHS/United States
- R01 CA109355/CA/NCI NIH HHS/United States
- T32 ES007028/ES/NIEHS NIH HHS/United States
- 5 T32 CA009582-25/CA/NCI NIH HHS/United States
- F32 HL090259/HL/NHLBI NIH HHS/United States
- 1F32CA138091/CA/NCI NIH HHS/United States
- R01 CA064140/CA/NCI NIH HHS/United States
LinkOut - more resources
Full Text Sources
Other Literature Sources
Medical
Molecular Biology Databases
Miscellaneous
