

Slow oscillations of KATP conductance in mouse pancreatic islets provide support for electrical bursting driven by metabolic oscillations
- PMID: 23921138
- PMCID: PMC3798703
- DOI: 10.1152/ajpendo.00046.2013
Slow oscillations of KATP conductance in mouse pancreatic islets provide support for electrical bursting driven by metabolic oscillations
Abstract
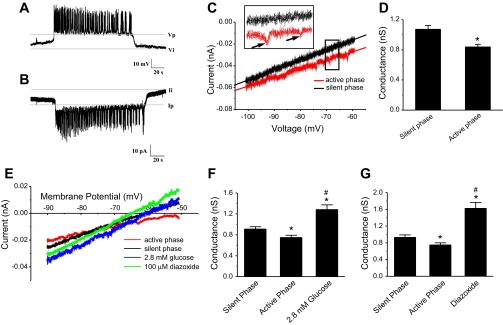
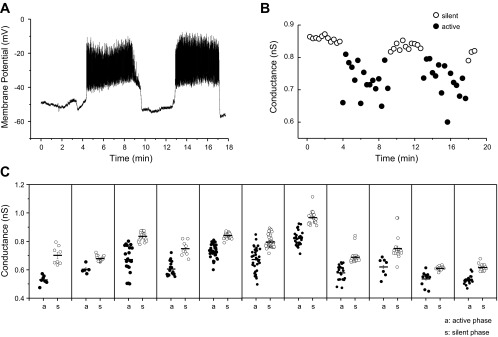
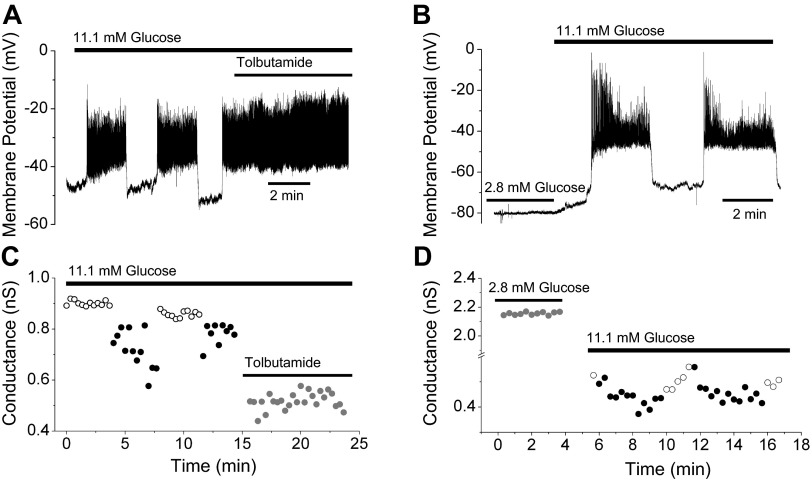
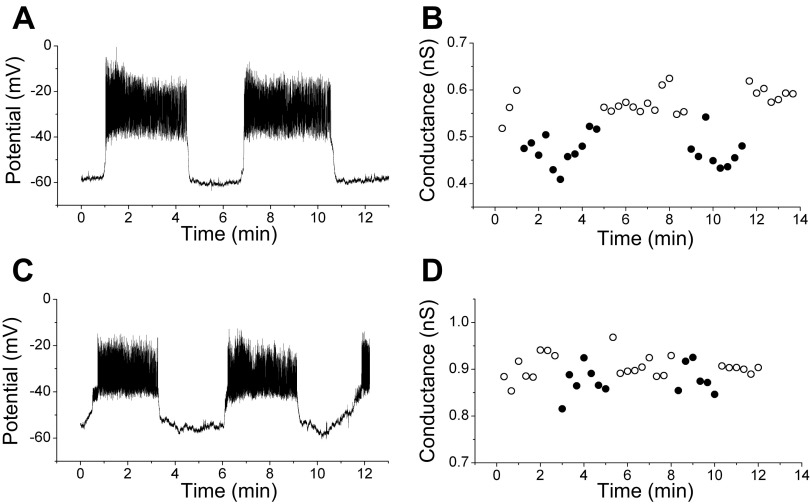
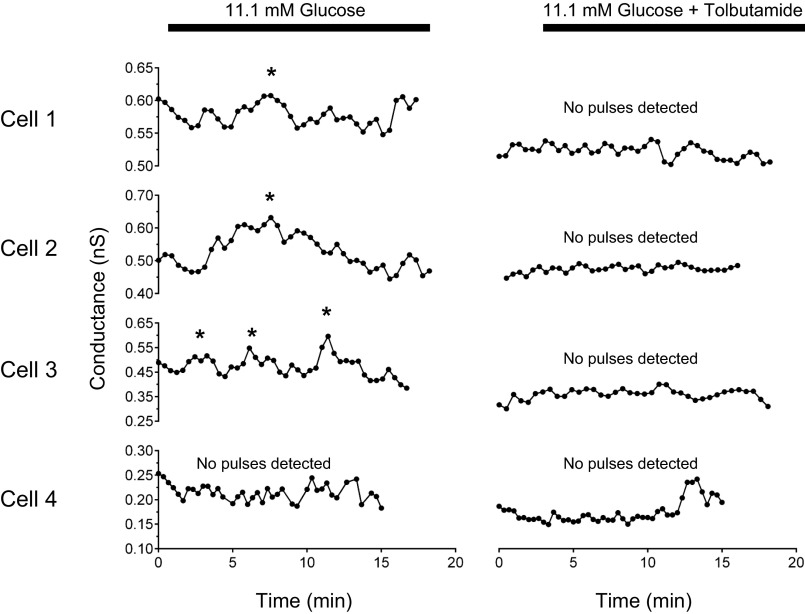
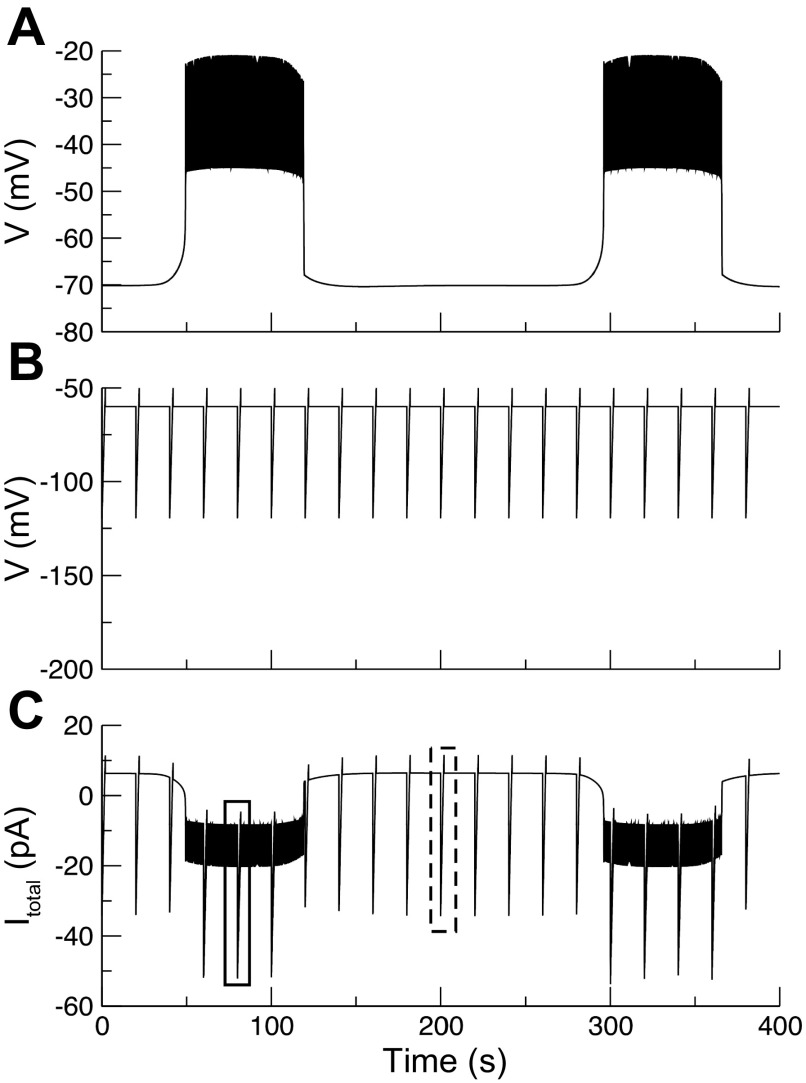
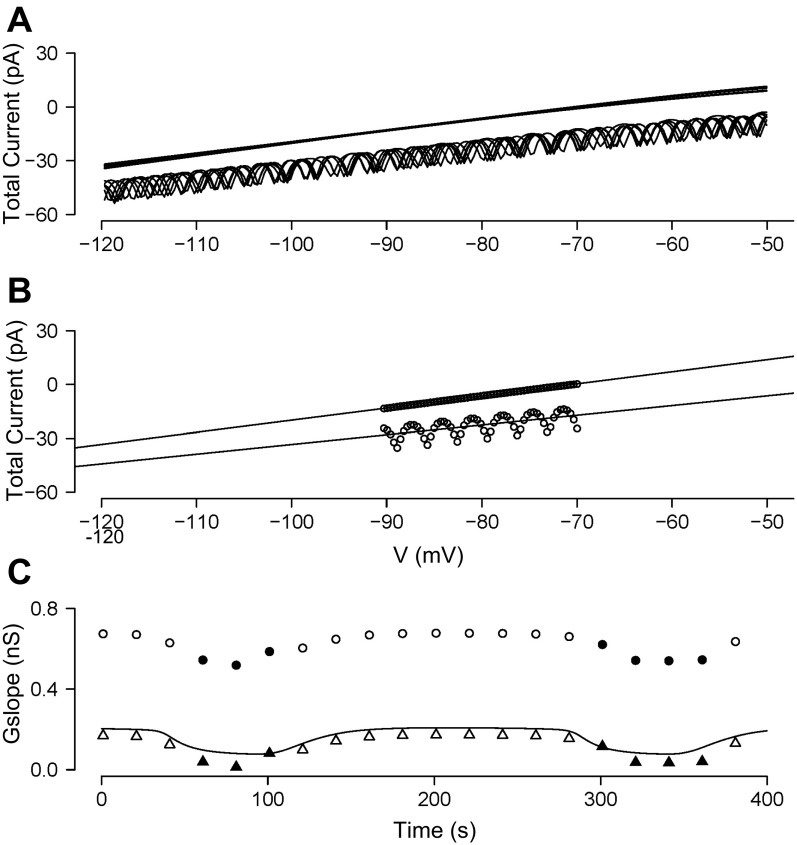
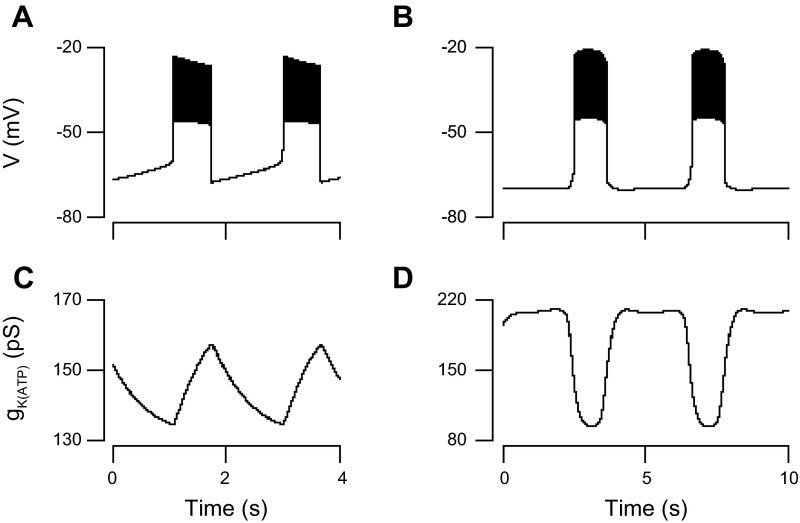
We used the patch clamp technique in situ to test the hypothesis that slow oscillations in metabolism mediate slow electrical oscillations in mouse pancreatic islets by causing oscillations in KATP channel activity. Total conductance was measured over the course of slow bursting oscillations in surface β-cells of islets exposed to 11.1 mM glucose by either switching from current clamp to voltage clamp at different phases of the bursting cycle or by clamping the cells to -60 mV and running two-second voltage ramps from -120 to -50 mV every 20 s. The membrane conductance, calculated from the slopes of the ramp current-voltage curves, oscillated and was larger during the silent phase than during the active phase of the burst. The ramp conductance was sensitive to diazoxide, and the oscillatory component was reduced by sulfonylureas or by lowering extracellular glucose to 2.8 mM, suggesting that the oscillatory total conductance is due to oscillatory KATP channel conductance. We demonstrate that these results are consistent with the Dual Oscillator model, in which glycolytic oscillations drive slow electrical bursting, but not with other models in which metabolic oscillations are secondary to calcium oscillations. The simulations also confirm that oscillations in membrane conductance can be well estimated from measurements of slope conductance and distinguished from gap junction conductance. Furthermore, the oscillatory conductance was blocked by tolbutamide in isolated β-cells. The data, combined with insights from mathematical models, support a mechanism of slow (∼5 min) bursting driven by oscillations in metabolism, rather than by oscillations in the intracellular free calcium concentration.
Keywords: ATP-sensitive potassium channels; insulin; islets; oscillations.
Figures
Similar articles
-
Oscillations in K(ATP) conductance drive slow calcium oscillations in pancreatic β-cells.Biophys J. 2022 Apr 19;121(8):1449-1464. doi: 10.1016/j.bpj.2022.03.015. Epub 2022 Mar 15. Biophys J. 2022. PMID: 35300967 Free PMC article.
-
Calcium and glycolysis mediate multiple bursting modes in pancreatic islets.Biophys J. 2004 Nov;87(5):3074-87. doi: 10.1529/biophysj.104.049262. Epub 2004 Sep 3. Biophys J. 2004. PMID: 15347584 Free PMC article.
-
Phase Analysis of Metabolic Oscillations and Membrane Potential in Pancreatic Islet β-Cells.Biophys J. 2016 Feb 2;110(3):691-699. doi: 10.1016/j.bpj.2015.12.029. Biophys J. 2016. PMID: 26840733 Free PMC article.
-
Metabolic and electrical oscillations: partners in controlling pulsatile insulin secretion.Am J Physiol Endocrinol Metab. 2007 Oct;293(4):E890-900. doi: 10.1152/ajpendo.00359.2007. Epub 2007 Jul 31. Am J Physiol Endocrinol Metab. 2007. PMID: 17666486 Review.
-
Bursting and calcium oscillations in pancreatic beta-cells: specific pacemakers for specific mechanisms.Am J Physiol Endocrinol Metab. 2010 Oct;299(4):E517-32. doi: 10.1152/ajpendo.00177.2010. Epub 2010 Jul 13. Am J Physiol Endocrinol Metab. 2010. PMID: 20628025 Free PMC article. Review.
Cited by
-
Modeling of glucose-induced cAMP oscillations in pancreatic β cells: cAMP rocks when metabolism rolls.Biophys J. 2015 Jul 21;109(2):439-49. doi: 10.1016/j.bpj.2015.06.024. Biophys J. 2015. PMID: 26200880 Free PMC article.
-
Upregulation of an inward rectifying K+ channel can rescue slow Ca2+ oscillations in K(ATP) channel deficient pancreatic islets.PLoS Comput Biol. 2017 Jul 27;13(7):e1005686. doi: 10.1371/journal.pcbi.1005686. eCollection 2017 Jul. PLoS Comput Biol. 2017. PMID: 28749940 Free PMC article.
-
Pulsatile insulin secretion, impaired glucose tolerance and type 2 diabetes.Mol Aspects Med. 2015 Apr;42:61-77. doi: 10.1016/j.mam.2015.01.003. Epub 2015 Jan 28. Mol Aspects Med. 2015. PMID: 25637831 Free PMC article. Review.
-
Type 2 Diabetes-Associated K+ Channel TALK-1 Modulates β-Cell Electrical Excitability, Second-Phase Insulin Secretion, and Glucose Homeostasis.Diabetes. 2015 Nov;64(11):3818-28. doi: 10.2337/db15-0280. Epub 2015 Aug 3. Diabetes. 2015. PMID: 26239056 Free PMC article.
-
Oscillations in K(ATP) conductance drive slow calcium oscillations in pancreatic β-cells.Biophys J. 2022 Apr 19;121(8):1449-1464. doi: 10.1016/j.bpj.2022.03.015. Epub 2022 Mar 15. Biophys J. 2022. PMID: 35300967 Free PMC article.
References
-
- Ashcroft FM, Rorsman P. Electrophysiology of the pancreatic β-cell. Prog Biophys Mol Biol 54: 87–143, 1989 - PubMed
Publication types
MeSH terms
Substances
Grants and funding
LinkOut - more resources
Full Text Sources
Other Literature Sources
Miscellaneous