

Diet reduction to requirements in obese/overfed ewes from early gestation prevents glucose/insulin dysregulation and returns fetal adiposity and organ development to control levels
- PMID: 23921140
- PMCID: PMC3798706
- DOI: 10.1152/ajpendo.00117.2013
Diet reduction to requirements in obese/overfed ewes from early gestation prevents glucose/insulin dysregulation and returns fetal adiposity and organ development to control levels
Abstract
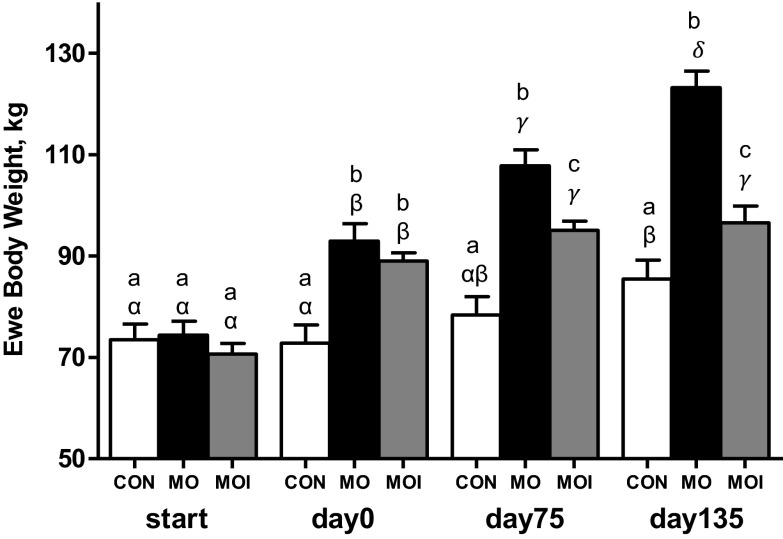
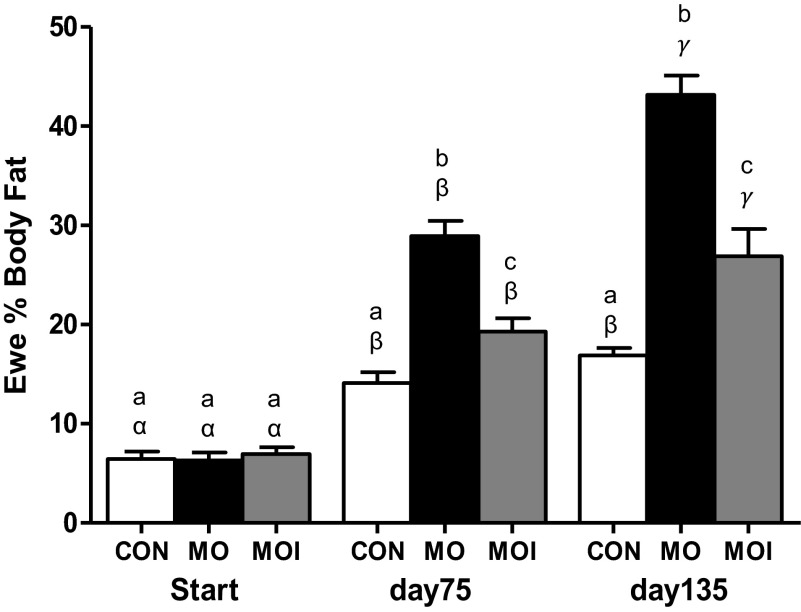
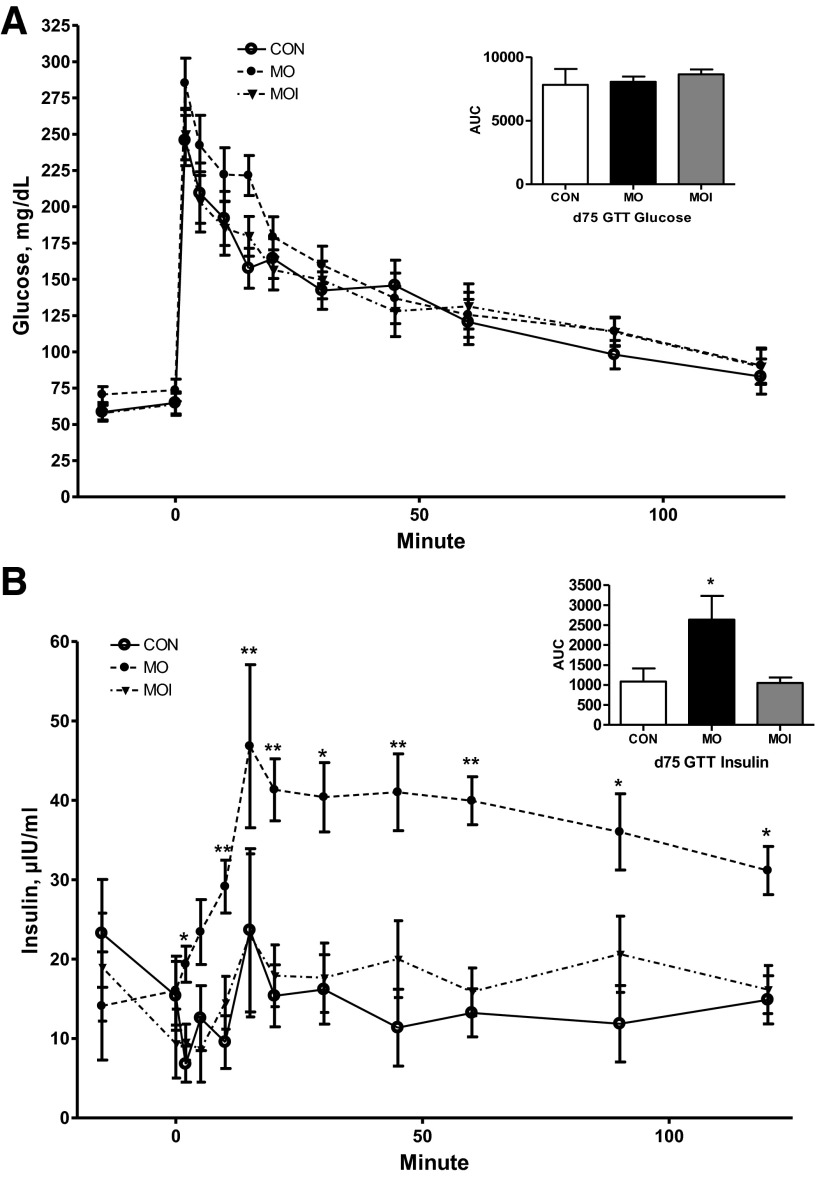
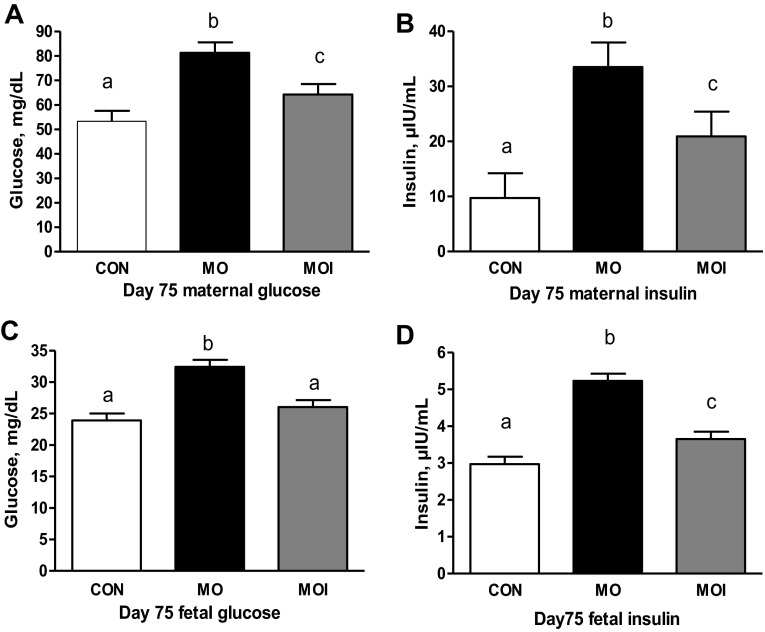
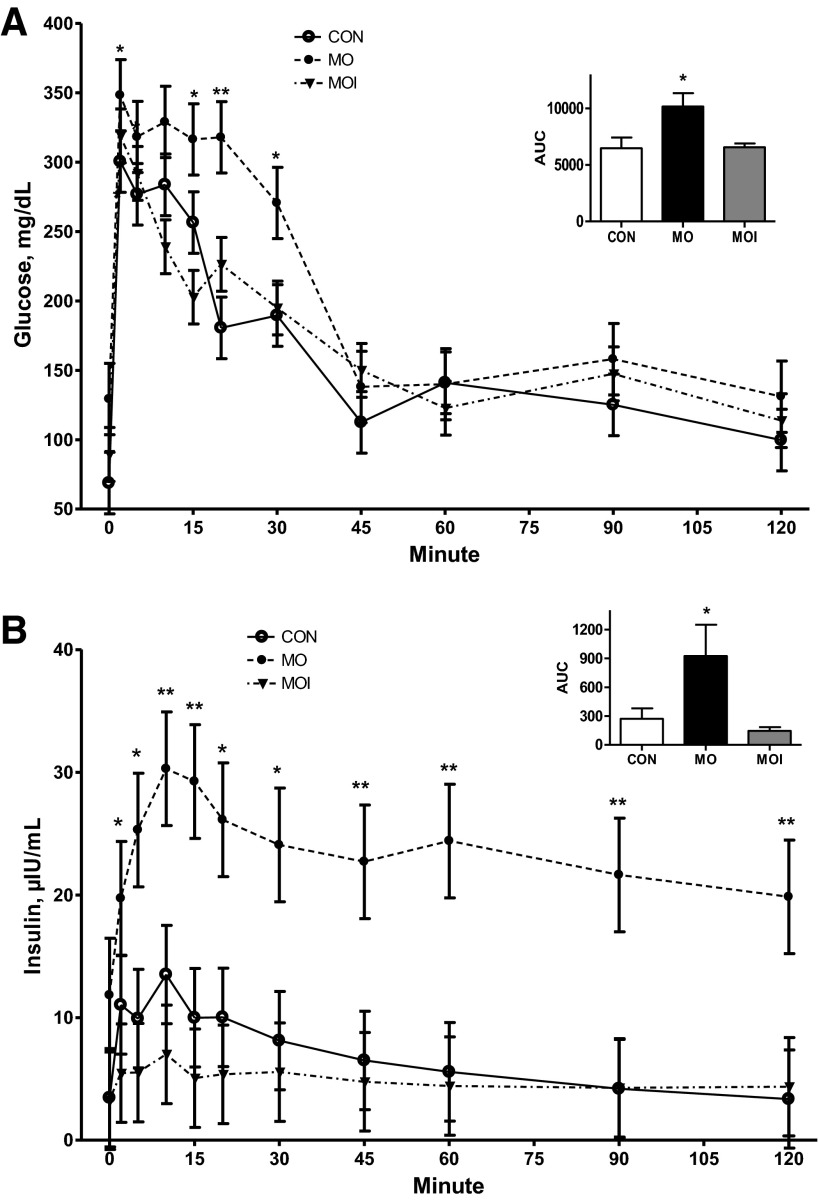
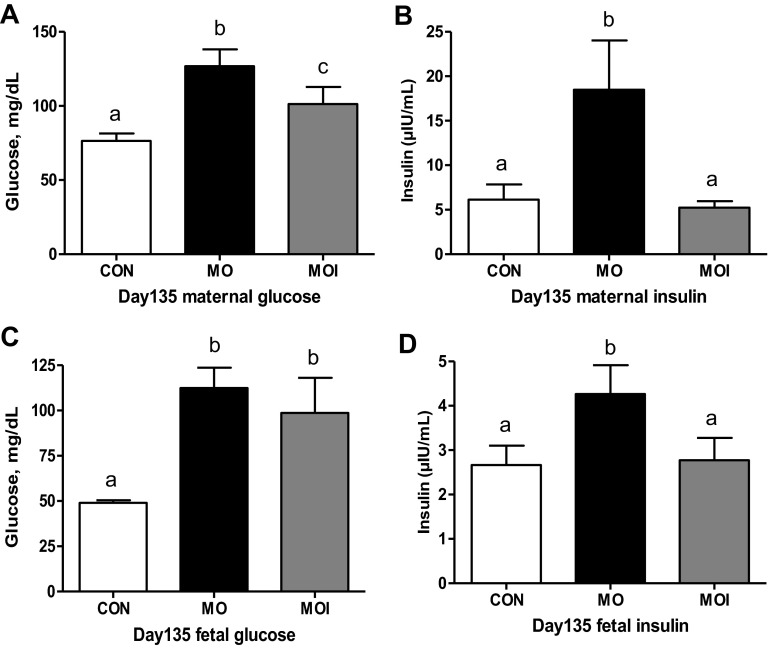
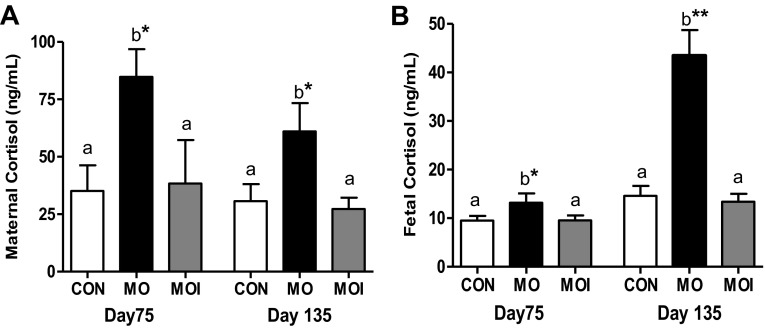
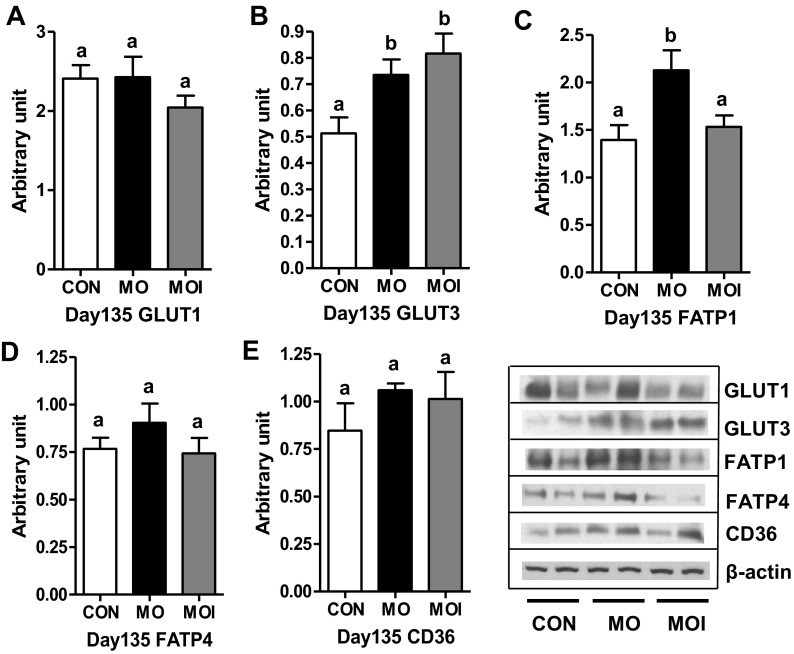
Obesity at conception and excess gestational weight gain pose significant risks for adverse health consequences in human offspring. This study evaluated the effects of reducing dietary intake of obese/overfed ewes beginning in early gestation on fetal development. Sixty days prior to conception, ewes were assigned to a control diet [CON: 100% of National Research Council (NRC) recommendations], a diet inducing maternal obesity (MO: 150% of NRC recommendations), or a maternal obesity intervention diet (MOI: 150% of NRC recommendations to day 28 of gestation, then 100% NRC) until necropsy at midgestation (day 75) or late (day 135) gestation. Fetal size and weight, as well as fetal organ weights, were greater (P < 0.05) at midgestation in MO ewes than those of CON and MOI ewes. By late gestation, whereas fetal size and weight did not differ among dietary groups, cardiac ventricular weights and wall thicknesses as well as liver and perirenal fat weights remained elevated in fetuses from MO ewes compared with those from CON and MOI ewes. MO ewes and fetuses exhibited elevated (P < 0.05) plasma concentrations of triglycerides, cholesterol, insulin, glucose, and cortisol at midgestation compared with CON and MOI ewes and fetuses. In late gestation, whereas plasma triglycerides and cholesterol, insulin, and cortisol remained elevated in MO vs. CON and MOI ewes and fetuses, glucose concentrations were elevated in both MO and MOI fetuses compared with CON fetuses, which was associated with elevated placental GLUT3 expression in both groups. These data are consistent with the concept that reducing maternal diet of obese/overfed ewes to requirements from early gestation can prevent subsequent alterations in fetal growth, adiposity, and glucose/insulin dynamics.
Keywords: dietary intervention; fetal growth and metabolism; maternal obesity.
Figures
Similar articles
-
Different levels of overnutrition and weight gain during pregnancy have differential effects on fetal growth and organ development.Reprod Biol Endocrinol. 2010 Jun 24;8:75. doi: 10.1186/1477-7827-8-75. Reprod Biol Endocrinol. 2010. PMID: 20576133 Free PMC article.
-
Maternal obesity upregulates fatty acid and glucose transporters and increases expression of enzymes mediating fatty acid biosynthesis in fetal adipose tissue depots.J Anim Sci. 2012 Jul;90(7):2201-10. doi: 10.2527/jas.2011-4343. Epub 2012 Jan 20. J Anim Sci. 2012. PMID: 22266999
-
Multigenerational impact of maternal overnutrition/obesity in the sheep on the neonatal leptin surge in granddaughters.Int J Obes (Lond). 2015 Apr;39(4):695-701. doi: 10.1038/ijo.2014.190. Epub 2014 Oct 30. Int J Obes (Lond). 2015. PMID: 25354845 Free PMC article.
-
The placental exposome: placental determinants of fetal adiposity and postnatal body composition.Ann Nutr Metab. 2013;63(3):208-15. doi: 10.1159/000355222. Epub 2013 Oct 8. Ann Nutr Metab. 2013. PMID: 24107818 Review.
-
Neurodevelopmental Programming of Adiposity: Contributions to Obesity Risk.Endocr Rev. 2024 Mar 4;45(2):253-280. doi: 10.1210/endrev/bnad031. Endocr Rev. 2024. PMID: 37971140 Free PMC article. Review.
Cited by
-
The Impact of Maternal Body Composition and Dietary Fat Consumption upon Placental Lipid Processing and Offspring Metabolic Health.Nutrients. 2020 Oct 3;12(10):3031. doi: 10.3390/nu12103031. Nutrients. 2020. PMID: 33022934 Free PMC article. Review.
-
Why primate models matter.Am J Primatol. 2014 Sep;76(9):801-27. doi: 10.1002/ajp.22281. Epub 2014 Apr 10. Am J Primatol. 2014. PMID: 24723482 Free PMC article. Review.
-
Made in the Womb: Maternal Programming of Offspring Cardiovascular Function by an Obesogenic Womb.Metabolites. 2023 Jul 13;13(7):845. doi: 10.3390/metabo13070845. Metabolites. 2023. PMID: 37512552 Free PMC article. Review.
-
Expression of epigenetic machinery genes is sensitive to maternal obesity and weight loss in relation to fetal growth in mice.Clin Epigenetics. 2016 Feb 27;8:22. doi: 10.1186/s13148-016-0188-3. eCollection 2016. Clin Epigenetics. 2016. PMID: 26925174 Free PMC article.
-
Rapid Communication: Reduced maternal nutrition during early- to mid-gestation elevates newborn lamb plasma cortisol concentrations and eliminates the neonatal leptin surge.J Anim Sci. 2018 Jun 29;96(7):2640-2645. doi: 10.1093/jas/sky215. J Anim Sci. 2018. PMID: 29982763 Free PMC article.
References
-
- Alexander G, Bell AW. Quantity and calculated oxygen consumption during summit metabolism of brown adipose tissue in newborn lambs. Biol Neonate 26: 214–220, 1975 - PubMed
-
- Altomonte J, Harbaran S, Richter A, Dong H. Fat depot-specific expression of adiponectin is impaired in Zucker fatty rats. Metabolism 52: 958–963, 2003 - PubMed
-
- Anderson MS, Flowers-Ziegler J, Das UG, Hay WW, Jr, Devaskar SU. Glucose transporter protein responses to selective hyperglycemia or hyperinsulinemia in fetal sheep. Am J Physiol Regul Integr Comp Physiol 281: R1545–R1552, 2001 - PubMed
-
- Anderson MS, He J, Flowers-Ziegler J, Devaskar SU, Hay WW., Jr Effects of selective hyperglycemia and hyperinsulinemia on glucose transporters in fetal ovine skeletal muscle. Am J Physiol Regul Integr Comp Physiol 281: R1256–R1263, 2001 - PubMed
Publication types
MeSH terms
Substances
Grants and funding
LinkOut - more resources
Full Text Sources
Other Literature Sources
Medical