. 2013 Oct 1;305(7):E853-67.
doi: 10.1152/ajpendo.00251.2013. Epub 2013 Aug 6.

Acid sphingomyelinase plays a key role in palmitic acid-amplified inflammatory signaling triggered by lipopolysaccharide at low concentrations in macrophages

Affiliations

Acid sphingomyelinase plays a key role in palmitic acid-amplified inflammatory signaling triggered by lipopolysaccharide at low concentrations in macrophages

Junfei Jin et al. Am J Physiol Endocrinol Metab. .

Abstract

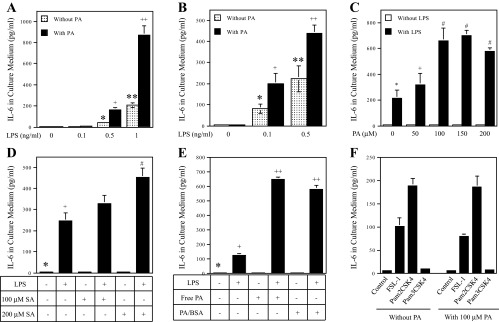
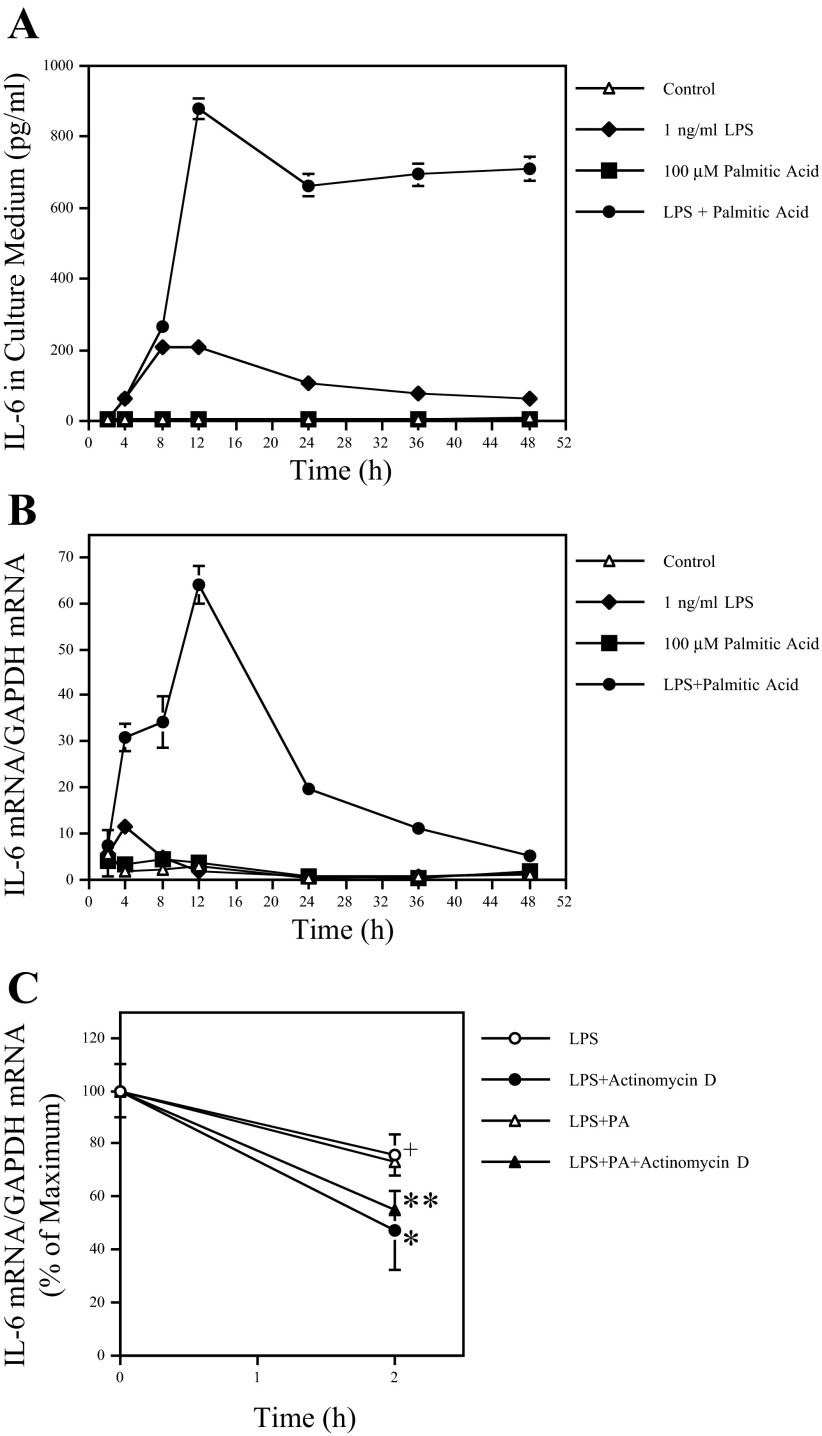
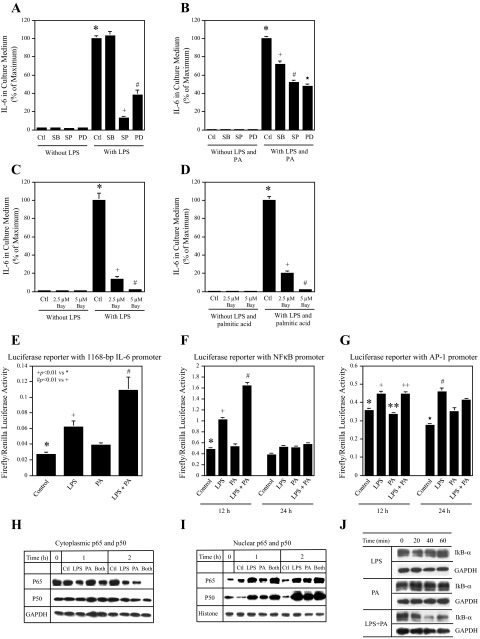
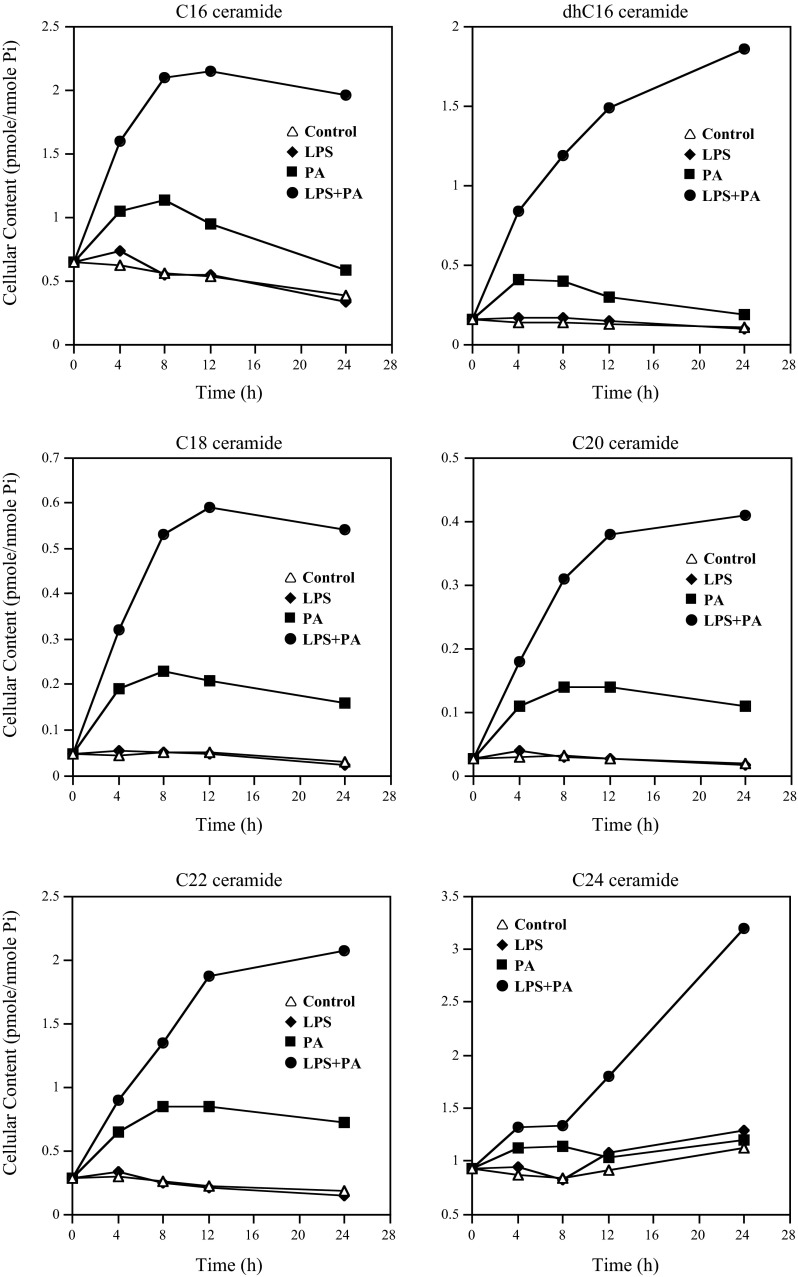
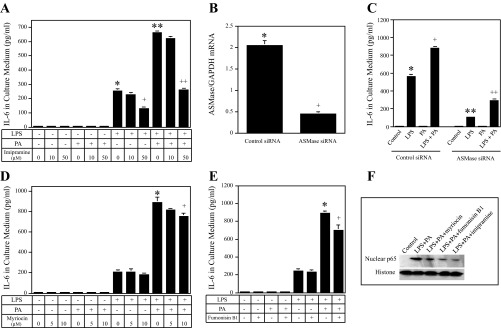
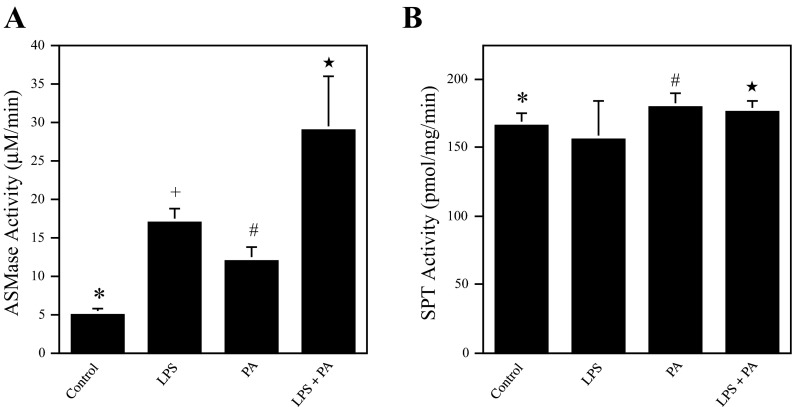
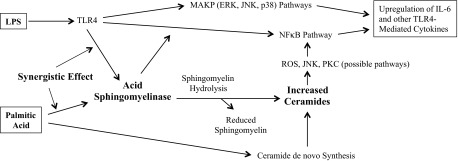
Periodontal disease is more prevalent and severe in patients with diabetes than in nondiabetic patients. In addition to diabetes, a large number of studies have demonstrated an association between obesity and chronic periodontal disease. However, the underlying mechanisms have not been well understood. Since plasma free fatty acids (FAs) are elevated in obese patients and saturated FAs such as palmitic acid (PA) have been shown to increase host inflammatory response, we sought to find out how PA interacts with lipopolysaccharide (LPS), an important pathological factor involved in periodontal disease, to enhance inflammation. We found that whereas low concentration of LPS (1 ng/ml) stimulated interleukin (IL)-6 expression in RAW 264.7 macrophages, PA further augmented it fourfold. Besides IL-6, PA amplified the stimulatory effect of LPS on a large amount of Toll-like receptor (TLR)4-mediated expression of proinflammatory signaling molecules such as IL-1 receptor-associated kinase-like 2 and proinflammatory molecules, including monocyte chemotactic protein-1 and colony-stimulating factor. We also observed that PA augmented TLR4 but not TLR2 signal, and the augmentation was mediated by nuclear factor-κB (NF-κB) pathways. To further elucidate the regulatory mechanism whereby PA amplifies LPS signal, our studies showed that PA and LPS synergistically increased hydrolysis of sphingomyelin by stimulating acid sphingomyelinase (ASMase) activity, which contributed to a marked increase in ceramide production and IL-6 upregulation. Taken together, this study has demonstrated that PA markedly augments TLR4-mediated proinflammatory signaling triggered by low concentration of LPS in macrophages, and ASMase plays a key role in the augmentation.

Keywords: fatty acid; inflammation; lipopolysaccharide; sphingomyelinase; toll-like receptor.


Figures

Fig. 1.
Fig. 1.
The effect of palmitic acid (PA) or stearic acid (SA) on LPS-stimulated IL-6 secretion from macrophages. Bars with different symbols in the bar graphs have significantly different values. A: RAW 264.7 cells were treated with different concentrations (0.1–1 ng/ml) of LPS in the absence or presence of 100 μM PA for 24 h. + and *P < 0.01; ++ and **P < 0.01. B: human monocyte-derived macrophages were treated with 0.1 or 0.5 ng/ml LPS in the absence or presence of 100 μM PA for 24 h. After treatment, IL-6 in culture medium was quantified using ELISA. + and *P < 0.01; ++ and **P < 0.01. C: RAW 264.7 cells were treated with or without 1 ng/ml LPS in the absence or presence of different concentrations of PA (50–200 μM) for 24 h. After the treatment, IL-6 in culture medium was quantified using ELISA. # and *P < 0.01; + and *P < 0.05. D: RAW 264.7 cells were treated with 1 ng/ml LPS in the absence or presence of 100 or 200 μM SA for 24 h. After treatment, IL-6 in culture medium was quantified using ELISA. + and *P < 0.01; # and *P < 0.01; # and +P < 0.01. E: the effect of bovine serum albumin (BSA)-unconjugated PA (free PA) and BSA-conjugated PA (PA/BSA) on IL-6 secretion induced by LPS. RAW 264.7 cells were treated with 1 ng/ml LPS in the absence or presence of 100 μM free or BSA-conjugated PA for 24 h. After treatment, IL-6 in in culture medium was quantified using ELISA. + and *P < 0.01; ++ and +P < 0.01. F: PA does not augment Toll-like receptor (TLR)2 signaling. RAW 264.7 cells were treated with 1 ng/ml fibroblast-stimulating ligand-1 (FSL-1) (TLR2/6 ligand), pam2CSK4 (TLR2/6 ligand), or pam3CSK4 (TLR2/1 ligand) in the absence or presence of 100 μM PA for 24 h. After treatment, IL-6 in culture medium was quantified using ELISA. The presented data (means ± SD) were from 1 of 3 experiments with similar results.
Fig. 2.
Fig. 2.
Time course of IL-6 secretion and mRNA expression by RAW 264.7 cells treated with LPS, PA, or both LPS and PA. A and B: RAW 264.7 cells were treated with 1 ng/ml LPS, 100 μM PA, or both LPS and PA for different times as indicated. At each time point, culture medium was collected and RNA isolated from cells. IL-6 in culture medium (A) and IL-6 mRNA (B) in cells were quantified using ELISA and real-time PCR, respectively. The presented data (means ± SD) were from 1 of 3 experiments with similar results. The lack of bars (SD) on some points is due to the fact that the SD was too small to be shown on the figure. C: the effect of LPS or the combination of LPS and PA on IL-6 mRNA stability. RAW 264.7 cells were treated with 1 ng/ml LPS or 1 ng/ml LPS + 100 μM PA for 12 h, followed by addition of 10 μg/ml actinomycin D. The cells were harvested 2 h after the addition of actinomycin D, and IL-6 mRNA was quantified using real-time PCR. The data presented (means ± SD) were from 1 of 2 experiments with similar results. + and *P < 0.01; * and **P > 0.05. Different symbols represent significantly different values.
Fig. 3.
Fig. 3.
The signaling pathways and transcription factors involved in LPS and PA-induced IL-6 expression. Bars with different symbols represent significantly different values. AD: the effect of pharmacological inhibitors of signaling pathways on IL-6 secretion stimulated by LPS alone or the combination of LPS and PA. RAW 264.7 cells were treated with 1 ng/ml LPS alone (A) or 1 ng/ml LPS + 100 μM PA (B) in the absence or presence of 10 μM SB-203580 (SB), an inhibitor for the p38 MAPK pthway, 10 μM SP-600125 (SP), an inhibitor for the JNK pathway, or 10 μM PD-98059 (PD), an inhibitor for the ERK pathway, for 24 h. The cells were also treated with 1 ng/ml LPS alone (C) and the combination of 1 ng/ml LPS + 100 μM PA (D) in the absence or presence of 2.5 or 5 μM Bay117085 (Bay), an inhibitor for the NF-κB pathway, for 24 h. After treatment, IL-6 in culture medium was quantified using ELISA. + and *P < 0.01; # and *P < 0.01; ★ and *P < 0.01. E: RAW 264.7 cells were transfected with plasmids (p1168huIL6P-luc+) for 24 h. The constitutively expressing renilla luciferase vectors were used as control (Ctl). After the transfection, the cells were treated with 1 ng/ml LPS, 100 μM PA, or both LPS and PA for 12 h. + and *P < 0.01; # and *P < 0.01. F and G: RAW 264.7 cells were transfected with the DNA vectors constructed with NF-κB (F) or activator protein-1 (AP-1)-binding element (G) in the promoter region and firefly luciferase reporter sequence in the presence of FuGENE HD as transfection reagent for 24 h. The constitutively expressing renilla luciferase vectors were used as control. After the transfection, the cells were treated with fresh medium containing 1 ng/ml LPS, 100 μM PA, or LPS and PA for 12 or 24 h. The NF-κB or AP-1 activity was presented as the ratio of firefly luciferase vs. renilla luciferase activity. The presented data (means ± SD) are from 1 of 2 experiments with similar results. + and *P < 0.01; # and +P < 0.01; ++ and **P < 0.1; # and ★P < 0.01. HJ: RAW 264.7 cells were treated with 1 ng/ml LPS, 100 μM PA, or both LPS and PA for the times as indicated, and cytoplasmic (H) and nuclear protein (I) were isolated and subjected to immunoblotting of p65 and p50. The cytoplasmic protein was also used for immunoblotting of IkB-α (J). Histone and GAPDH were used as nuclear and cytoplasmic control, respectively, to ensure loading of equal amount of protein for all samples to gel. The data presented are from 1 of 2 experiments with similar results.
Fig. 4.
Fig. 4.
The time courses of cellular ceramide production in response to treatment with LPS, PA, or both LPS and PA. RAW 264.7 cells had no treatment or were treated with 1 ng/ml LPS, 100 μM PA, or LPS + PA for different times as indicated, and cells were harvested at each time point and subjected to lipidomic analysis to quantify different ceramides and sphingosine. The data presented are from 1 of 2 experiments with similar results.
Fig. 5.
Fig. 5.
Composition of ceramides in RAW 264.7 cells after 12-h treatment with 1 ng/ml LPS, 100 μM PA, or both LPS and PA. The data presented in Fig. 4 were used for the analysis.
Fig. 6.
Fig. 6.
The effect of imipramine (IMP), myriocin, fumonisin B1, and acid sphingomyelinase (ASMase) knockdown on IL-6 secretion induced by LPS, PA, or both LPS and PA. Bars with different symbols in the bar graphs have significantly different values. A: RAW 264.7 cells were treated with 1 ng/ml LPS, 100 μM PA, or both LPS and PA in the absence or presence of IMP at either 10 or 50 μM for 24 h. After the treatment, IL-6 in culture medium was quantified using ELISA. + and *P < 0.01; * and **P < 0.01; ++ and **P < 0.01. B and C: RAW 264.7 cells were transfected with 200 nM ASMase or scrambled siRNA (control siRNA) for 24 h. After the transfection, ASMase knockdown by siRNA was confirmed using real-time PCR (B); the transfected cells were then treated with or without 1 ng/ml LPS, 100 μM PA, or both LPS and PA for 24 h, and IL-6 in culture medium was quantified using ELISA (C). + and *P < 0.01; ** and *P < 0.01; ++ and +P < 0.01. D and E: the effect of myriocin (serine palmitoyl-CoA transferase inhibitor) or fumonisin B1 (ceramide synthase inhibitor) on IL-6 secretion by RAW 264.7 cells treated with 1 ng/ml LPS, 100 μM PA, or both LPS and PA. RAW 264.7 cells were treated with 1 ng/ml LPS, 100 μM PA, or both LPS and PA in the absence or presence of either 5 or 10 μM myriocin (D) or 250 μM fumonisin B1 (E) for 24 h. + and *P < 0.05. F: reduction of LPS and PA-stimulated nuclear p65 level by inhibitors of ceramide synthesis and sphingomyelin hydrolysis. RAW 264.7 cells were treated with 1 ng/ml LPS and 100 μM PA in the absence or presence of 10 μM myriocin, 250 μM fumonisin B1, or 50 μM IMP for 24 h. After the treatment, nuclear protein was isolated and immunoblotting performed to detect p65, as described in materials and methods.
Fig. 7.
Fig. 7.
The effect of LPS, PA, or LPS and PA on ASMase activity (A) and serine palmitoyl-CoA transferase (SPT) activity (B). Bars with different symbols in the bar graphs have significantly different values. A: RAW 264.7 cells were treated with 1 ng/ml LPS, 100 μM PA, or LPS and PA for 4 h. After the treatment, cells were lysed and cell lysates used for ASMase activity assay. * and +, #, or ★P < 0.01; ★ and + or #P < 0.01. B: RAW 264.7 cells were treated with 1 ng/ml LPS, 100 μM PA, or LPS and PA for 4 h. After the treatment, cells were collected for SPT activity assay. * and # or ★P < 0.05.
Fig. 8.
Fig. 8.
Schematic diagram to show the proposed mechanism involved in the upregulation of IL-6 expression in RAW 264.7 macrophages by LPS and PA. ROS, reactive oxygen species.

Similar articles

Cited by

References

    1. Akira S, Kishimoto T. IL-6 and NF-IL6 in acute-phase response and viral infection. Immunol Rev 127: 25–50, 1992 - PubMed
    1. Beutler B. TLR4 as the mammalian endotoxin sensor. Curr Top Microbiol Immunol 270: 109–120, 2002 - PubMed
    1. Boden G. Obesity, insulin resistance and free fatty acids. Curr Opin Endocrinol Diabetes Obes 18: 139–143, 2011 - PMC - PubMed
    1. Bullon P, Morillo JM, Ramirez-Tortosa MC, Quiles JL, Newman HN, Battino M. Metabolic syndrome and periodontitis: is oxidative stress a common link? J Dent Res 88: 503–518, 2009 - PubMed
    1. Chaffee BW, Weston SJ. Association between chronic periodontal disease and obesity: a systematic review and meta-analysis. J Periodontol 81: 1708–1724, 2010 - PMC - PubMed

Publication types

MeSH terms

LinkOut - more resources