

Long-term exposure to a high-fat diet results in the development of glucose intolerance and insulin resistance in interleukin-1 receptor I-deficient mice
- PMID: 23921145
- PMCID: PMC3798700
- DOI: 10.1152/ajpendo.00297.2013
Long-term exposure to a high-fat diet results in the development of glucose intolerance and insulin resistance in interleukin-1 receptor I-deficient mice
Abstract
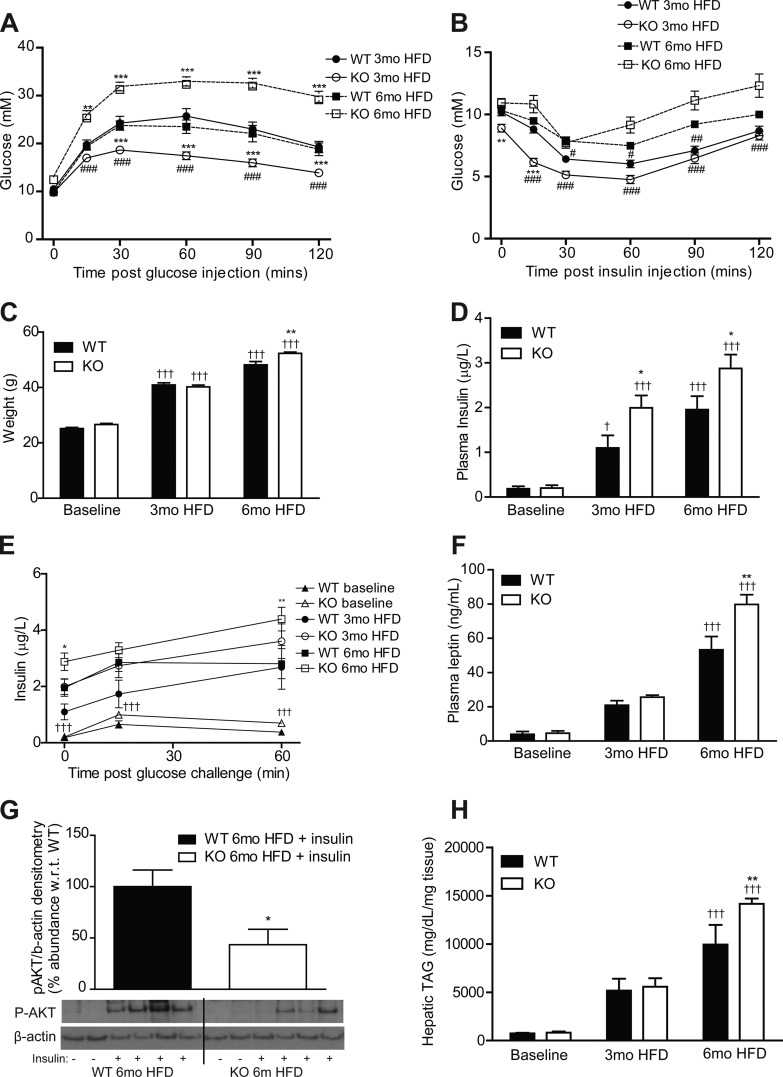
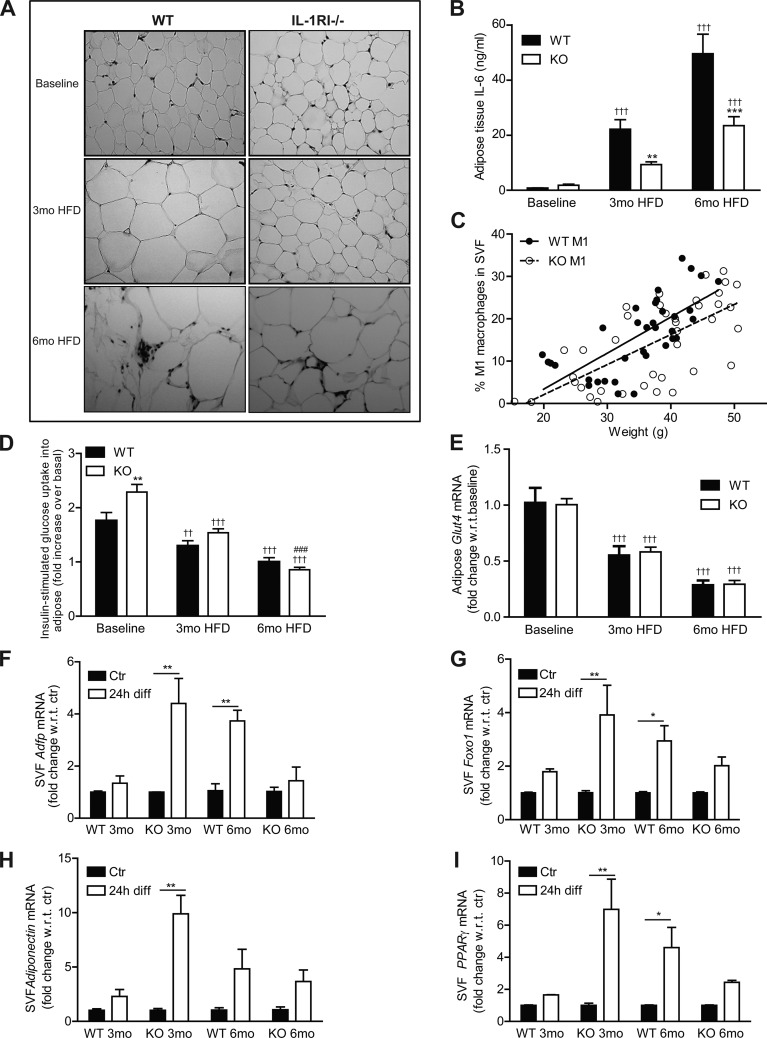
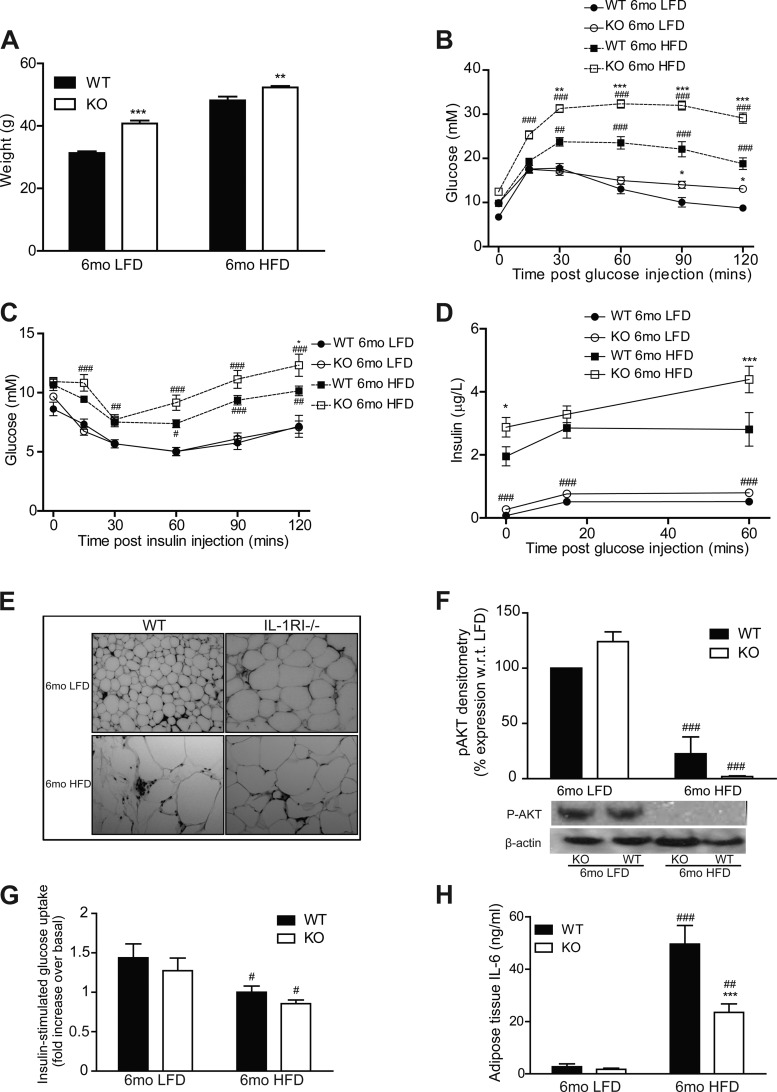
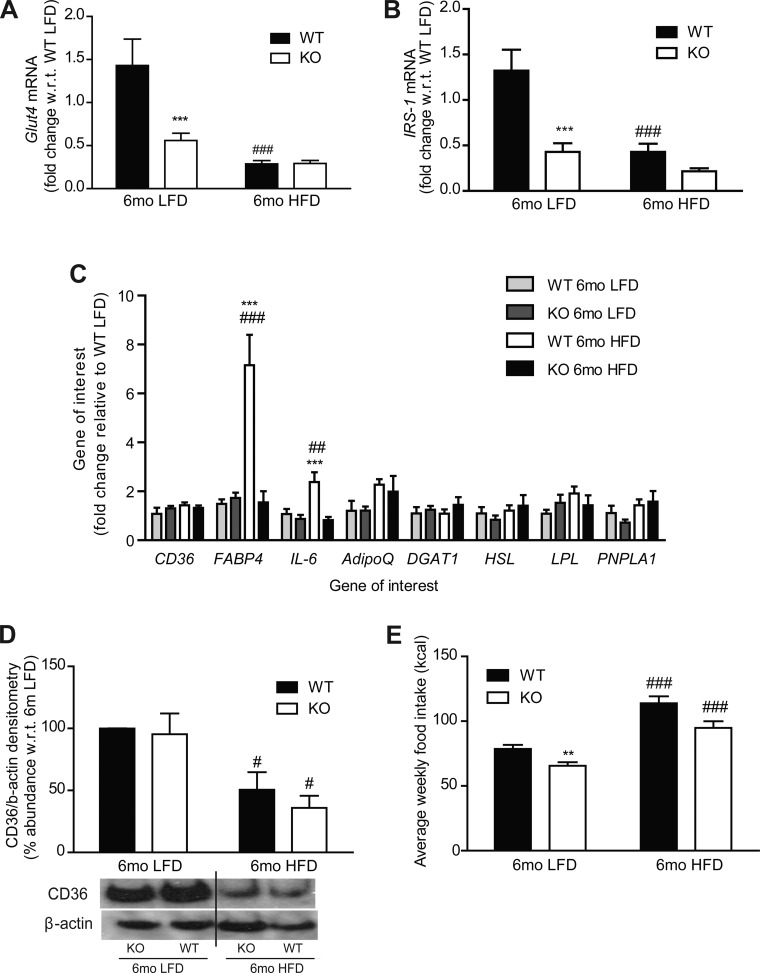
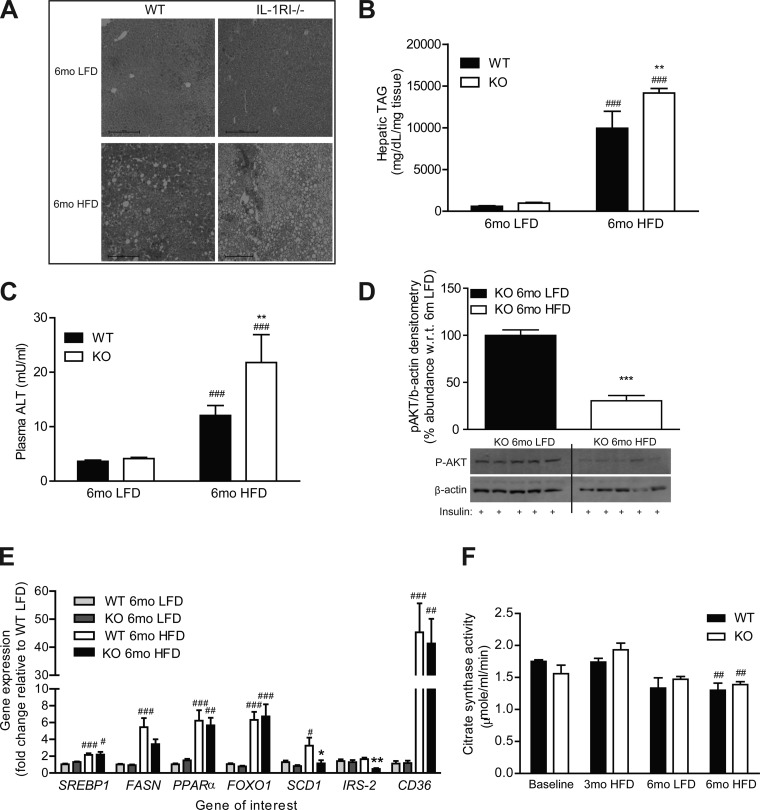
Emerging evidence has demonstrated that saturated fatty acids prime pro-IL-1β production and inflammasome-mediated IL-1β activation is critical in obesity-associated insulin resistance (IR). Nonetheless, IL-1 receptor I-deficient (IL-1RI(-/-)) mice develop mature-onset obesity despite consuming a low-fat diet (LFD). With this apparent contradiction, the present study evaluated whether IL-1RI(-/-) mice were protected against long-term (6 mo) high-fat diet (HFD)-induced IR. Male wild-type and IL-1RI(-/-) mice were fed LFD or HFD for 3 or 6 mo, and glucose and insulin tolerance tests were performed. Adipose insulin sensitivity, cytokine profiles, and adipocyte morphology were assessed. The adipogenic potential of stromal vascular fraction was determined. Hepatic lipid accumulation and insulin sensitivity were characterized. IL-1RI(-/-) mice developed glucose intolerance and IR after 6 mo HFD compared with 3 mo HFD, coincident with enhanced weight gain, hyperinsulinemia, and hyperleptinemia. The aggravated IR phenotype was associated with loss of adipose functionality, switch from adipocyte hyperplasia to hypertrophy and hepatosteatosis. Induction of adipogenic genes was reduced in IL-1RI(-/-) preadipocytes after 6 mo HFD compared with 3 mo HFD. Obese LFD-IL-1RI(-/-) mice exhibited preserved metabolic health. IL-1RI(-/-) mice develop glucose intolerance and IR after 6 mo HFD intervention. While mature-onset obesity is evident in LFD-IL-1RI(-/-) mice, the additional metabolic insult of HFD was required to drive adipose inflammation and systemic IR. These findings indicate an important interaction between dietary fat and IL-1, relevant to optimal metabolic health.
Keywords: adipose inflammation; hepatic steatosis.
Figures
Similar articles
-
Lack of interleukin-1 receptor I (IL-1RI) protects mice from high-fat diet-induced adipose tissue inflammation coincident with improved glucose homeostasis.Diabetes. 2011 Jun;60(6):1688-98. doi: 10.2337/db10-1278. Epub 2011 Apr 22. Diabetes. 2011. PMID: 21515850 Free PMC article.
-
Microbiome Transfer Partly Overrides Lack of IL-1RI Signaling to Alter Hepatic but not Adipose Tissue Phenotype and Lipid Handling following a High-Fat Diet Challenge.Mol Nutr Food Res. 2021 Jan;65(1):e2000202. doi: 10.1002/mnfr.202000202. Epub 2020 Jul 12. Mol Nutr Food Res. 2021. PMID: 32558187
-
Interleukin-1α deficiency reduces adiposity, glucose intolerance and hepatic de-novo lipogenesis in diet-induced obese mice.BMJ Open Diabetes Res Care. 2019 Oct 17;7(1):e000650. doi: 10.1136/bmjdrc-2019-000650. eCollection 2019. BMJ Open Diabetes Res Care. 2019. PMID: 31749969 Free PMC article.
-
Cardio-Metabolic Effects of High-Fat Diets and Their Underlying Mechanisms-A Narrative Review.Nutrients. 2020 May 21;12(5):1505. doi: 10.3390/nu12051505. Nutrients. 2020. PMID: 32455838 Free PMC article. Review.
-
Impact of Short-Term Lipid Overload on Whole-Body Physiology.Mol Cell Biol. 2025;45(2):47-58. doi: 10.1080/10985549.2024.2438814. Epub 2024 Dec 27. Mol Cell Biol. 2025. PMID: 39726368 Review.
Cited by
-
Pathogenesis of sarcopenia and the relationship with fat mass: descriptive review.J Cachexia Sarcopenia Muscle. 2022 Apr;13(2):781-794. doi: 10.1002/jcsm.12901. Epub 2022 Feb 2. J Cachexia Sarcopenia Muscle. 2022. PMID: 35106971 Free PMC article. Review.
-
IL-1 Receptor Contributes to the Maintenance of the Intestinal Barrier via IL-22 during Obesity and Metabolic Syndrome in Experimental Model.Microorganisms. 2024 Aug 20;12(8):1717. doi: 10.3390/microorganisms12081717. Microorganisms. 2024. PMID: 39203559 Free PMC article.
-
Inflammatory Cytokines and Antipsychotic-Induced Weight Gain: Review and Clinical Implications.Mol Neuropsychiatry. 2016 May;2(1):1-14. doi: 10.1159/000441521. Epub 2016 Jan 8. Mol Neuropsychiatry. 2016. PMID: 27606316 Free PMC article. Review.
-
Effects of the use of assisted reproductive technologies and an obesogenic environment on resistance artery function and diabetes biomarkers in mice offspring.PLoS One. 2014 Nov 11;9(11):e112651. doi: 10.1371/journal.pone.0112651. eCollection 2014. PLoS One. 2014. PMID: 25386661 Free PMC article.
-
Voluntary Exercise Can Ameliorate Insulin Resistance by Reducing iNOS-Mediated S-Nitrosylation of Akt in the Liver in Obese Rats.PLoS One. 2015 Jul 14;10(7):e0132029. doi: 10.1371/journal.pone.0132029. eCollection 2015. PLoS One. 2015. PMID: 26172834 Free PMC article.
References
-
- Brown MS, Goldstein JL. Selective versus total insulin resistance: a pathogenic paradox. Cell Metab 7: 95–96, 2008 - PubMed
-
- Chida D, Osaka T, Hashimoto O, Iwakura Y. Combined interleukin-6 and interleukin-1 deficiency causes obesity in young mice. Diabetes 55: 971–977, 2006 - PubMed
-
- Duewell P, Kono H, Rayner KJ, Sirois CM, Vladimer G, Bauernfeind FG, Abela GS, Franchi L, Nunez G, Schnurr M, Espevik T, Lien E, Fitzgerald KA, Rock KL, Moore KJ, Wright SD, Hornung V, Latz E. NLRP3 inflammasomes are required for atherogenesis and activated by cholesterol crystals. Nature 464: 1357–1361 - PMC - PubMed
-
- Febbraio MA, Rose-John S, Pedersen BK. Is interleukin-6 receptor blockade the Holy Grail for inflammatory diseases? Clin Pharmacol Ther 87: 396–398, 2010 - PubMed
Publication types
MeSH terms
Substances
Grants and funding
LinkOut - more resources
Full Text Sources
Other Literature Sources
Molecular Biology Databases