. 2013 Nov;3(11):1286-301.
doi: 10.1158/2159-8290.CD-13-0138. Epub 2013 Aug 6.

Targeting the Wnt pathway in synovial sarcoma models

Affiliations

Targeting the Wnt pathway in synovial sarcoma models

Whitney Barham et al. Cancer Discov. 2013 Nov.

Abstract

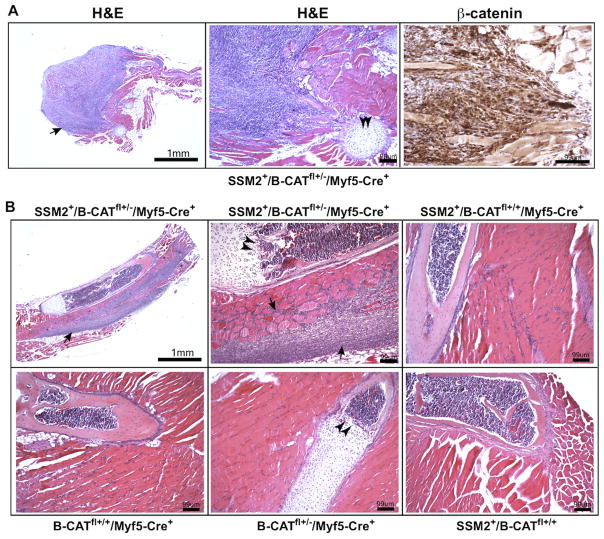
Synovial sarcoma is an aggressive soft-tissue malignancy of children and young adults, with no effective systemic therapies. Its specific oncogene, SYT-SSX (SS18-SSX), drives sarcoma initiation and development. The exact mechanism of SYT-SSX oncogenic function remains unknown. In an SYT-SSX2 transgenic model, we show that a constitutive Wnt/β-catenin signal is aberrantly activated by SYT-SSX2, and inhibition of Wnt signaling through the genetic loss of β-catenin blocks synovial sarcoma tumor formation. In a combination of cell-based and synovial sarcoma tumor xenograft models, we show that inhibition of the Wnt cascade through coreceptor blockade and the use of small-molecule CK1α activators arrests synovial sarcoma tumor growth. We find that upregulation of the Wnt/β-catenin cascade by SYT-SSX2 correlates with its nuclear reprogramming function. These studies reveal the central role of Wnt/β-catenin signaling in SYT-SSX2-induced sarcoma genesis, and open new venues for the development of effective synovial sarcoma curative agents.

Significance: Synovial sarcoma is an aggressive soft-tissue cancer that afflicts children and young adults, and for which there is no effective treatment. The current studies provide critical insight into our understanding of the pathogenesis of SYT–SSX-dependent synovial sarcoma and pave the way for the development of effective therapeutic agents for the treatment of the disease in humans.


Conflict of interest statement

Conflict of interest: The authors disclose no potential conflicts of interest.

Figures

Figure 1
Figure 1. β-catenin knockout inhibits SS tumor growth in SYT-SSX2 transgenic mice
(A) Histogram represents total number of tumors in SG1 (SSM2+/Myf5-Cre+), SG2 (SSM2+/B-CATfl+/−/Myf5-Cre+), and SG3 (SSM2+/B-CATfl+/+/Myf5-Cre+) mice. (B) Dot plot tabulating number of tumors in the SG1, SG2, and SG3 mice, with median value bar. P values compare difference significance between each pair of the experimental groups. (C) Left column: hematoxylin and eosin (H&E) staining of tumors (black arrows: blue nuclei) in the intercostal muscle (pink fibers) of SG1 (upper row, SSM2+) and one of the three SG3 (lower row, SSM2+/B-CATfl+/+) mice that developed tumors. Middle column: control mouse IgG immunostaining. Right column: β-catenin immunostaining. Control IgG and β-catenin stainings were performed on serial tumor sections present on the same slide. Scale bars of all images are 99μm. (D) β-catenin immunofluorescent staining (red) in tumors from SG1 (SSM2+) and SG3 (SSM2+/B-CATfl+/+) mice. Mouse IgG served as negative control. DAPI (blue) stains nuclei. Merged blue and red images show β-catenin nuclear localization.
Figure 2
Figure 2. Integrity of the rib musculature in SYT-SSX2 transgenic mice
(A) H&E staining (left and middle images) of an intercostal SG2 tumor (black arrow, pink muscle fibers) near the rib cartilage (black arrowheads). Right image: β-catenin immunostaining in the SG2 tumor. Scale bars on middle and right images are 99μm. (B) H&E staining of the rib musculature. Upper row, left and middle images: SG2 tumor (black arrow, blue nuclei), infiltrating muscle fibers (pink) near the rib bone/cartilage. Upper right image: normal rib musculature in a tumor-free SG3 mouse. Lower row: normal rib musculature in a β-catenin-null knockout mouse (left image), a heterozygous β-catenin knockout mouse (middle image), and a SYT-SSX2/BCAT double mutant (right image). Black arrowheads denote cartilage/bone junction. Excepting the upper left image, all displayed scale bars are 99μm.
Figure 3
Figure 3. DKK1 attenuates β-catenin nuclear localization and signaling
(A) Immunostaining of C2C12 myoblasts transduced with empty retroviral vectors: POZ and LZRS, and those expressing SYT-SSX2 and DKK1. DKK1 (green) and β-catenin (red) were detected with a specific polyclonal and monoclonal antibody, respectively. Numbers represent average percent of SYT-SSX2/DKK1-espressing cells, exhibiting nuclear β-catenin, +/− standard deviations (n=3). 500 nuclei were counted for each vector. (B) TOP-FLASH activity in SYT-SSX2-expressing C2C12 cells transduced with incremental amounts of DKK1 cDNA. Histogram represents fold activation over Vector. Error bars are standard deviations (n=3). P values were calculated relative to SYT-SSX2.
Figure 4
Figure 4. DKK1 inhibits SS tumor growth in nude mice
(A) Histogram represents ratios of TOP-FLASH (T) activity in mSS cells transfected with increasing amounts of DKK1 cDNA, over empty vector. Errors bars are standard deviation (n=3) P values were calculated relative to empty vector (T, 0). FOP-FLASH (F) was baseline activity. (B) Dot plot comparing tumor volumes in naïve, LZRS vector-, and LZRS-DKK1-infected mSS cells, with median value bars. Dunn’s post-hoc test showed significant difference between DKK1 and Naïve or Vector SS tumors. Naïve and Vector were not significantly different. Inset: immunoblot showing stable DKK1 expression in mSS cells implanted in nude mice. Equivalent amounts (100 μg) of protein lysate were loaded in each lane. Doublet reflects DKK1post-translational modification. (C) H&E staining of Naïve, Vector, or DKK1 tumors. Arrows indicate hypocellular centers. Scale bars on all images are 99μm. (D) Ki-67 (green, white arrowhead) immunoflurescent staining in Vector and DKK1 tumors. DAPI staining: double arrowheads reveal paucity of nuclei in the hypocellular centers of DKK1 tumors. Right histogram compares Ki-67 expression (counted visually) in the Vector- and DKK1 tumors. Error bars indicate standard deviations (n=3). P value was calculated relative to Vector SS.
Figure 5
Figure 5. SSTC-104 and LRP6 depletion effects on β-catenin and SS cells
(A) Left histogram shows growth of SSTC-104-treated SYO-1 cells relative to Vehicle (DMSO) after a 2- or 4-day treatment. Right histogram shows percent of SSTC-104- and Vehicle-treated cells containing nuclear β-catenin. 700 nuclei were counted in each group. Error bars represent standard deviations (n=2). P values were calculated relative to Vehicle. (B) Immunoblot of de-phosphorylated β-catenin in SSTC-104-treated SYO-1 cells. Numbers represent ratios of signal intensities over control (V=vehicle). Tubulin served as loading control. (C) β-catenin immunofluorescent staining (green) in SSTC-104-treated cells. White arrows indicate large cytoplasmic extensions with multiple intercellular junctions. Right image (high magnification) showcases β-catenin at intercellular junctions. DAPI stains nuclei. β-catenin and DAPI images were merged for co-localization. (D) Immunoblot shows LRP6 levels in SYO-1 cells transfected with LRP6 non-targeting (NT) and targeting (Si-LRP6-1 and SI-LRP6-2) siRNAs. Numbers show relative intensities (NT is 1). Tubulin served as loading control. (E) Histogram shows percent of siRNA-transfected SYO-1 cells containing nuclear β-catenin. 500 nuclei were counted in each group. Error bars represent standard deviations (n=2). P values were calculated relative to NT. (F) β-catenin immunofluorescent staining (green) in SYO-1 cells transfected with NT, Si-LRP6-1 and Si-LRP6-2 oligomers. Merged (merge) β-catenin and DAPI images show nuclear (or lack of) β-catenin. White arrowheads in Si-LRP6-1 and Si-LRP6-2 (magnified) images show neurite-like cytoplasmic protrusions connecting cells over long distances at multiple points of contact.
Figure 6
Figure 6. SSTC-104 in vivo effects in SS tumors
(A) The three histograms represent tumor volumes on the 1st, 4th and 8th day of SSTC-104 treatment. Vehicle is 15% DMSO in PBS solution. Error bars denote standard deviations. P values were calculated relative to Vehicle. (B) β-catenin immunostaining in Vehicle-treated (top row; increasing magnification) and SSTC-104-treated (middle and lower row) tumors. Double arrowheads: areas denuded of β-catenin. Single arrowheads: clear nuclei. (C) Immunofluorescent staining of β-catenin (Red) in Vehicle-treated tumors (upper row), and in the hypocellular centers of SSTC-104-treated tumors (lower row, white arrows). DAPI (not shown) and red images were merged (merge). Scale bar is 50μm (D) Histogram shows Ki-67 scores in SSTC-104- and Vehicle-treated tumors. 500 nuclei were counted in each group. Error bars represent standard deviations. P values show significance difference between each pair of groups. Lower image panel: immunofluorescent staining of Ki-67 (green) in SSTC-104- and Vehicle-treated tumors. DAPI stains nuclei. Scale bar is 50μm. (E) Upper histogram shows number of tumors detected in SSTC-104-treated Control and SSM2+/Myf5-Cre+ mice, and Vehicle-treated SSM2+/Myf5-Cre+ mice. P value was calculated relative to Vehicle. Error bars represent standard deviations. Lower histogram shows combined tumor volumes as tumor load, in SSM2+/Myf5-Cre+ mice treated with Vehicle or SSTC-104. Error bars represent standard deviations. P value was calculated relative to Vehicle.
Figure 7
Figure 7. β-catenin nuclear signaling is mediated by SYT-SSX2 N-terminal and C-terminal SSXRD
(A) Schematic of SYT-SSX2 and its deletion mutants. SXdl3 and SXdl9 lack residues 35–55 and 65–78 of the SSXRD, respectively. Lower panel: immunostaining of C2C12 myoblasts transduced with the designated retroviral vectors. POZ is empty vector. Expressed SYT-SSX2-derived proteins are HA (and FLAG)-tagged (green). POZ expresses an irrelevant small peptide that disappears with subcloning SYT-SSX2 and other cDNAs. β-catenin is visualized with a specific monoclonal antibody (red). The red and the green channels were merged (merge) for co-localization. Numbers represent average percent of HA-positive cells with nuclear β-catenin +/− standard deviation (n=3). 500 nuclei were counted for each vector. (B) Inset: FLAG immunoblot showing expression of SYT-SSX2 vectors. Histogram depicts fold increase of TOP-FLASH (T) activity with the SYT-SSX2-derived vectors relative to control vector (POZ). FOP-FLASH (F) was baseline activity; Error bars denote standard deviations; n=3. P values were calculated relative to SYT-SSX2.

References

    1. dos Santos NR, de Bruijn DR, van Kessel AG. Molecular mechanisms underlying human synovial sarcoma development. Genes Chromosomes Cancer. 2001;30:1–14. - PubMed
    1. Ladanyi M. Fusions of the SYT and SSX genes in synovial sarcoma. Oncogene. 2001;20:5755–62. - PubMed
    1. Haldar M, Randall RL, Capecchi MR. Synovial sarcoma: from genetics to genetic- based animal modeling. Clin Orthop Relat Res. 2008;466:2156–67. - PMC - PubMed
    1. Mackall CL, Meltzer PS, Helman LJ. Focus on sarcomas. Cancer Cell. 2004;2:175–8. - PubMed
    1. Naka N, Takenaka S, Araki N, Miwa T, Hasimoto N, Yoshioka K, Joyama S, Hamada KI, Tsukamoto Y, Tomita Y, Ueda T, Yoshikawa H, Itoh K. Synovial sarcoma is a stem cell malignancy. Stem Cells. 2010;28:1119–31. - PubMed

Publication types

MeSH terms

LinkOut - more resources