

Disc degeneration assessed by quantitative T2* (T2 star) correlated with functional lumbar mechanics
- PMID: 23921323
- PMCID: PMC3830665
- DOI: 10.1097/BRS.0b013e3182a59453
Disc degeneration assessed by quantitative T2* (T2 star) correlated with functional lumbar mechanics
Abstract
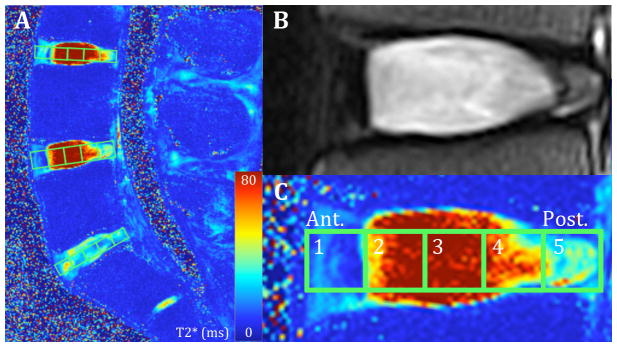
Study design: Experimental correlation study design to quantify features of disc health, including signal intensity and distinction between the annulus fibrosus and nucleus pulposus, with T2* magnetic resonance imaging (MRI) and correlate with the functional mechanics in corresponding motion segments.
Objective: Establish the relationship between disc health assessed by quantitative T2* MRI and functional lumbar mechanics.
Summary of background data: Degeneration leads to altered biochemistry in the disc, affecting the mechanical competence. Clinical routine MRI sequences are not adequate in detecting early changes in degeneration and fails to correlate with pain or improve patient stratification. Quantitative T2* relaxation time mapping probes biochemical features and may offer more sensitivity in assessing disc degeneration.
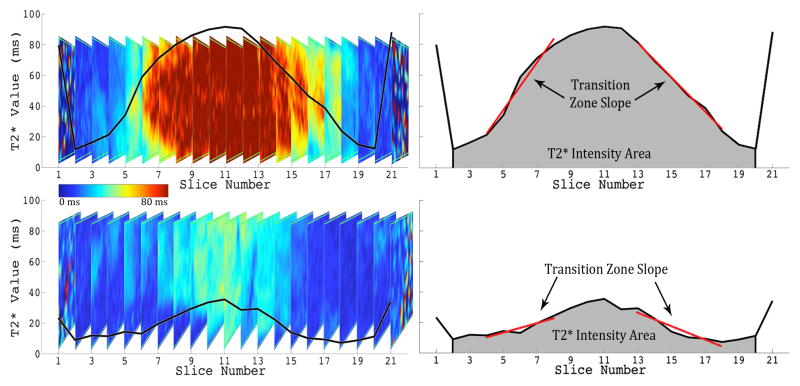
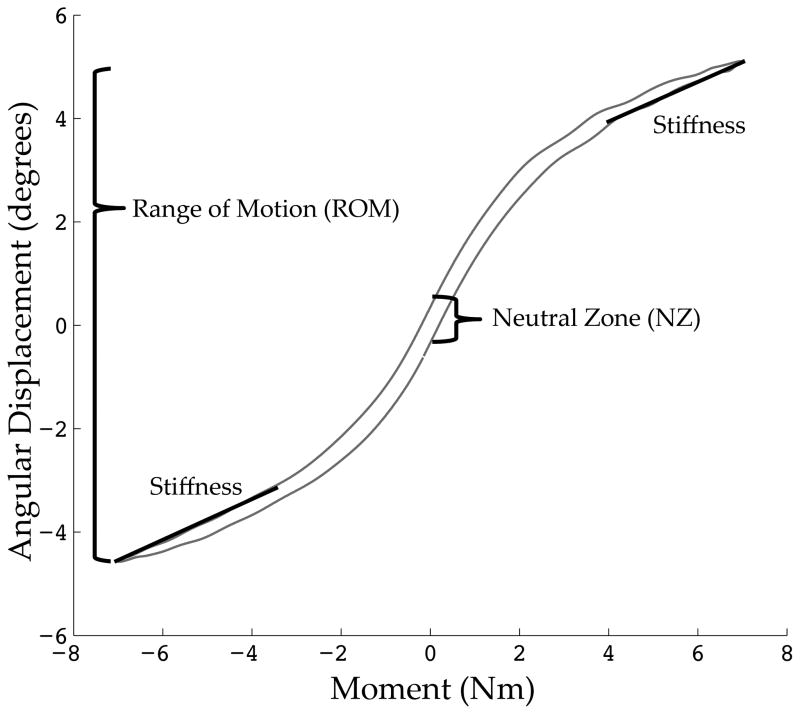
Methods: Cadaveric lumbar spines were imaged using quantitative T2* mapping, as well as conventional T2-weighted MRI sequences. Discs were graded by the Pfirrmann scale, and features of disc health, including signal intensity (T2* intensity area) and distinction between the annulus fibrosus and nucleus pulposus (transition zone slope), were quantified by T2*. Each motion segment was subjected to pure moment bending to determine range of motion (ROM), neutral zone (NZ), and bending stiffness.
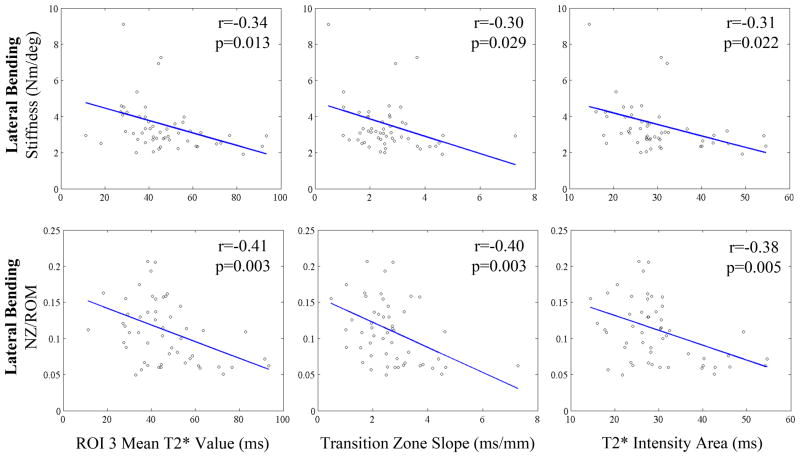
Results: T2* intensity area and transition zone slope were significantly correlated with flexion ROM (P = 0.015; P = 0.002), ratio of NZ/ROM (P = 0.010; P = 0.028), and stiffness (P = 0.044; P = 0.026), as well as lateral bending NZ/ROM (P = 0.005; P = 0.010) and stiffness (P = 0.022; P = 0.029). T2* intensity area was also correlated with lateral bending ROM (P = 0.023). Pfirrmann grade was only correlated with lateral bending NZ/ROM (P = 0.001) and stiffness (P = 0.007).
Conclusion: T2* mapping is a sensitive quantitative method capable of detecting changes associated with disc degeneration. Features of disc health quantified with T2* predicted altered functional mechanics of the lumbar spine better than traditional Pfirrmann grading. This new methodology and analysis technique may enhance the assessment of degeneration and enable greater patient stratification for therapeutic strategies.
Level of evidence: N/A.
Figures
Similar articles
-
Altered helical axis patterns of the lumbar spine indicate increased instability with disc degeneration.J Biomech. 2015 Jan 21;48(2):361-9. doi: 10.1016/j.jbiomech.2014.11.010. Epub 2014 Nov 22. J Biomech. 2015. PMID: 25481221 Free PMC article.
-
Noninvasive Assessment of Biochemical and Mechanical Properties of Lumbar Discs Through Quantitative Magnetic Resonance Imaging in Asymptomatic Volunteers.J Biomech Eng. 2017 Nov 1;139(11):1110021-7. doi: 10.1115/1.4037549. J Biomech Eng. 2017. PMID: 28779522 Free PMC article.
-
Effects of motion segment level, Pfirrmann intervertebral disc degeneration grade and gender on lumbar spine kinematics.J Orthop Res. 2016 Aug;34(8):1389-98. doi: 10.1002/jor.23232. Epub 2016 Apr 6. J Orthop Res. 2016. PMID: 26990567
-
Biomechanics of intervertebral disk degeneration.Orthop Clin North Am. 2011 Oct;42(4):487-99, vii. doi: 10.1016/j.ocl.2011.07.001. Orthop Clin North Am. 2011. PMID: 21944586 Free PMC article. Review.
-
Ageing and degenerative changes of the intervertebral disc and their impact on spinal flexibility.Eur Spine J. 2014 Jun;23 Suppl 3:S324-32. doi: 10.1007/s00586-014-3203-4. Epub 2014 Jan 31. Eur Spine J. 2014. PMID: 24482074 Review.
Cited by
-
Multi-frame biomechanical and relaxometry analysis during in vivo loading of the human knee by spiral dualMRI and compressed sensing.Magn Reson Med. 2023 Sep;90(3):995-1009. doi: 10.1002/mrm.29690. Epub 2023 May 22. Magn Reson Med. 2023. PMID: 37213087 Free PMC article.
-
Motion of Lumbar Endplate in Degenerative Lumbar Scoliosis Patients with Different Cobb Angle In Vivo: Reflecting the Biomechanics of the Lumbar Disc.Biomed Res Int. 2022 Oct 14;2022:8745683. doi: 10.1155/2022/8745683. eCollection 2022. Biomed Res Int. 2022. PMID: 36277876 Free PMC article.
-
Developments in intervertebral disc disease research: pathophysiology, mechanobiology, and therapeutics.Curr Rev Musculoskelet Med. 2015 Mar;8(1):18-31. doi: 10.1007/s12178-014-9253-8. Curr Rev Musculoskelet Med. 2015. PMID: 25694233 Free PMC article.
-
Quantifying the effect of posterior spinal instrumentation on the MRI signal of adjacent intervertebral discs.Spine Deform. 2020 Oct;8(5):845-851. doi: 10.1007/s43390-020-00139-9. Epub 2020 May 24. Spine Deform. 2020. PMID: 32449035 Free PMC article.
-
Morphological alterations of lumbar intervertebral discs in patients with adolescent idiopathic scoliosis.Spine J. 2024 Jan;24(1):172-184. doi: 10.1016/j.spinee.2023.08.012. Epub 2023 Aug 21. Spine J. 2024. PMID: 37611875 Free PMC article.
References
-
- Andersson GB. Epidemiological features of chronic low-back pain. Lancet. 1999 Aug 14;354(9178):581–585. - PubMed
-
- Pfirrmann CW, Metzdorf A, Zanetti M, Hodler J, Boos N. Magnetic resonance classification of lumbar intervertebral disc degeneration. Spine (Phila Pa 1976) 2001 Sep 1;26(17):1873–1878. - PubMed
-
- Thompson JP, Pearce RH, Schechter MT, Adams ME, Tsang IK, Bishop PB. Preliminary evaluation of a scheme for grading the gross morphology of the human intervertebral disc. Spine (Phila Pa 1976) 1990 May;15(5):411–415. - PubMed
-
- Arana E, Royuela A, Kovacs FM, et al. Lumbar spine: agreement in the interpretation of 1.5-T MR images by using the Nordic Modic Consensus Group classification form. Radiology. 2010 Mar;254(3):809–817. - PubMed
-
- Raininko R, Manninen H, Battie MC, Gibbons LE, Gill K, Fisher LD. Observer variability in the assessment of disc degeneration on magnetic resonance images of the lumbar and thoracic spine. Spine (Phila Pa 1976) 1995 May 1;20(9):1029–1035. - PubMed
Publication types
MeSH terms
Grants and funding
LinkOut - more resources
Full Text Sources
Other Literature Sources
Medical
Research Materials
