. 2013 Oct 4;288(40):28687-703.
doi: 10.1074/jbc.M113.461277. Epub 2013 Aug 6.

The switch-associated protein 70 (SWAP-70) bundles actin filaments and contributes to the regulation of F-actin dynamics

Affiliations

The switch-associated protein 70 (SWAP-70) bundles actin filaments and contributes to the regulation of F-actin dynamics

Carlos Andrés Chacón-Martínez et al. J Biol Chem. .

Abstract

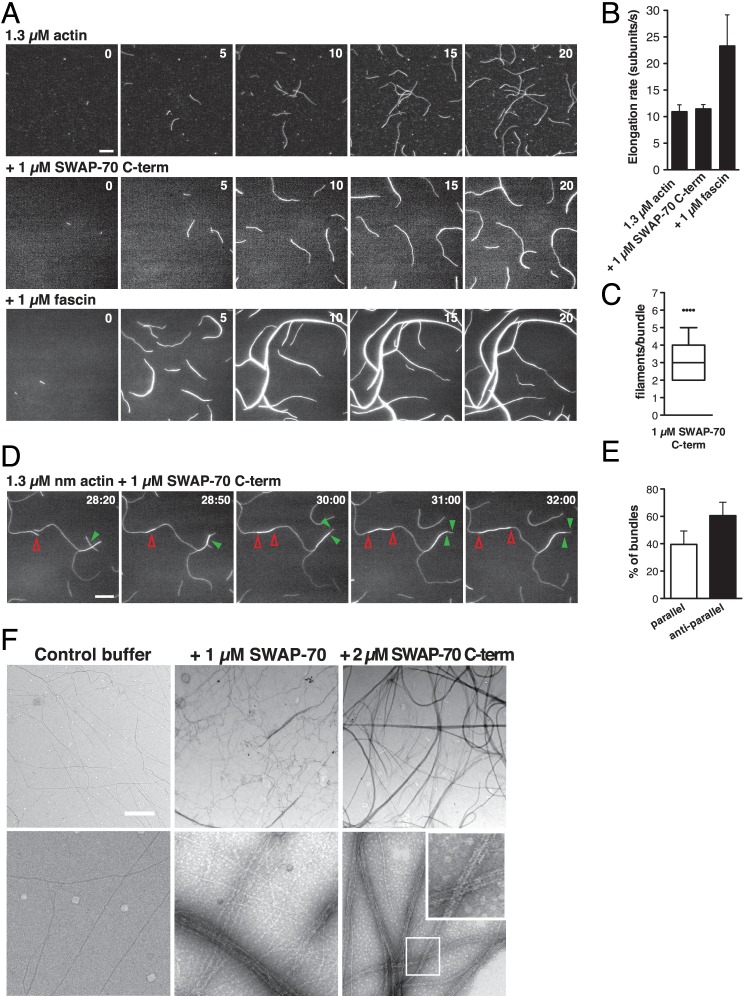
Coordinated assembly and disassembly of actin into filaments and higher order structures such as stress fibers and lamellipodia are fundamental for cell migration and adhesion. However, the precise spatiotemporal regulation of F-actin structures is not completely understood. SWAP-70, a phosphatidylinositol 3,4,5-trisphosphate-interacting, F-actin-binding protein, participates in actin rearrangements through yet unknown mechanisms. Here, we show that SWAP-70 is an F-actin-bundling protein that oligomerizes through a Gln/Glu-rich stretch within a coiled-coil region. SWAP-70 bundles filaments in parallel and anti-parallel fashion through its C-terminal F-actin binding domain and delays dilution-induced F-actin depolymerization. We further demonstrate that SWAP-70 co-localizes and directly interacts with cofilin, an F-actin severing and depolymerization factor, and contributes to the regulation of cofilin activity in vivo. In line with these activities, upon stem cell factor stimulation, murine bone marrow-derived mast cells lacking SWAP-70 display aberrant regulation of F-actin and actin free barbed ends dynamics. Moreover, proper stem cell factor-dependent cofilin activation via dephosphorylation and subcellular redistribution into a detergent-resistant cytoskeletal compartment also require SWAP-70. Together, these findings reveal an important role of SWAP-70 in the dynamic spatiotemporal regulation of F-actin networks.

Keywords: Actin; Cell Biology; Cofilin; Cytoskeleton; F-actin Bundling; Mast Cell; SWAP-70.


Figures

FIGURE 1.
FIGURE 1.
SWAP-70 binds F-actin, delays F-actin depolymerization induced by dilution, and does not affect filament polymerization and elongation. A, binding of SWAP-70 to nonmuscle F-actin. Increasing concentrations of SWAP-70 (0.25, 0.5, 1, 2, and 4 μm) were incubated with 0.5 μm F-actin followed by a high speed pelleting assay. SWAP-70 bound to F-actin was quantified by densitometry of Coomassie-stained gels. The actual amount of F-actin (actin in pellet) per reaction was measured as 0.21 ± 0.017 μm. The average of four independent experiments is shown. Curve shows the best fit for the data. Error bars indicate ± S.E. B, SWAP-70 has no effects on in vitro pyrene-actin polymerization. 2 μm nonmuscle G-actin (10% pyrene-labeled) was polymerized in the presence or absence of SWAP-70. a.u., arbitrary units. C, spontaneous assembly of nonmuscle actin filaments (1.3 μm, 23% ATTO488-labeled) in the presence or absence of 0.5 μm SWAP-70 visualized by TIRFM. Red circles mark the barbed end of a growing filament. Time is in seconds (upper right corner). D, elongation rate of actin filaments is not affected by SWAP-70. At least 15 filaments from three movies per condition were measured. Error bars indicate ± S.D. E, time course of F-actin depolymerization induced by dilution at 0.1 μm in the presence of variable concentrations of SWAP-70. 2 μm F-actin was first mixed with SWAP-70 or buffer (negative control), incubated for 2 min, and then diluted 20-fold. F, visualization of F-actin from depolymerization experiments as in E. Representative images before and after F-actin depolymerization. Time is in minutes (upper right corner) after depolymerization. G, filament length was measured 25 min after F-actin depolymerization from experiments as in F. At least 50 filaments per condition were analyzed. Representative data of at least three independent experiments are shown. Scale bar, 10 μm. See also supplemental Movie S1.
FIGURE 2.
FIGURE 2.
SWAP-70 bundles actin filaments through its C-terminal region. A, SWAP-70 bundles actin filaments in low speed pelleting assays. 2 μm F-actin was mixed with 2 μm SWAP-70, 2 μm SWAP-70 C-term, or buffer (control). Supernatants (S) contain nonbundled F-actin, and pellets (P) bundled F-actin. Samples were analyzed on Coomassie-stained gels. B, quantification by densitometry of bundled actin (actin in pellet) from at least three experiments as in A. Error bars indicate ± S.D. C, quantification by densitometry of bundled F-actin in the presence of the indicated proteins after low speed pelleting assay. 1 μm F-actin was mixed with SWAP-70 or SWAP-70 C-term (0.25, 0.5, 1, 2, 4, and 8 μm) and processed as in A. The average of three independent experiments is shown. Curves show the best fit for the data. Error bars indicate ± S.E. D, visualization of bundled F-actin by fluorescent microscopy in the presence of the indicated proteins. Images are displayed using a 6_shades look-up table (LUT) in Fiji. Color calibration bar is shown on the right. Scale bar, 10 μm.
FIGURE 3.
FIGURE 3.
SWAP-70-induced bundles contain parallel and anti-parallel actin filaments. A, dynamics of actin filament bundling by SWAP-70 C-term. Spontaneous polymerization of nonmuscle actin filaments (1.3 μm, 23% ATTO488-labeled) on mPEG-coated coverslips in the presence or absence of SWAP-70 C-term or fascin at the indicated concentrations. Time is in minutes. Scale bar, 10 μm. B, SWAP-70 C-term does not alter the elongation rate of growing actin filaments. At least 15 single, not bundled, filaments from three movies per condition were measured. Error bars indicate ± S.D. C, number of filaments per bundle in the presence of SWAP-70 C-term 30 min after polymerization. Filaments from at least 100 bundles from four movies were visually counted. Data are shown using a Box-and-Whisker plot as follows: box indicates 25th and 75th percentiles; error bars represent 10th and 90th percentiles; middle line is the median; dots are outlier values. D, SWAP-70 C-term bundles actin filaments in parallel and anti-parallel fashion visualized by TIRFM. Conditions are as in A. Arrowheads mark the bundling events and track barbed ends of filaments. Red open arrowheads mark anti-parallel and green solid arrowheads parallel growing filaments. Time in min/s. Scale bar, 10 μm. E, orientation of actin filaments in SWAP-70 C-term-induced bundles. At least 100 bundles from four movies were visually analyzed. F, electron microscopy of SWAP-70-induced F-actin bundles. F-actin was negatively stained with uranyl acetate. Samples contained 2.1 μm F-actin. Upper panels show low magnification; lower panels show high magnification. Inset shows an enlarged view of the white box. Scale bar, 100 nm. Representations of at least three independent experiments are shown. See also supplemental Movies S2 and S3.
FIGURE 4.
FIGURE 4.
SWAP-70 forms oligomers. A, His-SWAP-70 binds GST-SWAP-70 in pulldown assays. 0.5 μm of His- and GST-SWAP-70 or GST control were mixed and incubated prior isolation of GST proteins. B, co-immunoprecipitation of endogenous SWAP-70 with Venus-SWAP-70. Protein extracts from NIH 3T3 cells expressing Venus-SWAP-70 were immunoprecipitated (IP) with anti-GFP or anti-IgG isotype control. Samples were resolved by SDS-PAGE and immunoblotted (IB). C, analytical gel filtration analysis of SWAP-70, SWAP-70 C-term, and SWAP-70w/oCC. Vertical offset chromatogram of the indicated recombinant purified proteins is shown. D, determination of SWAP-70's RS by gel filtration. Protein standards used to calibrate the column are shown. Experimentally determined RS values of the indicated proteins are shown in the table below. ± indicates S.D. E, determination of the sedimentation coefficient (S) of SWAP-70. 15–40% glycerol linear gradients were used in velocity sedimentation assays. Protein standards BSA (4.6 S), β-amylase (9.2 S), and apoferritin (16.3 S) were used to calculate SWAP-70's S value. Samples were collected from the bottom (fraction 1) to the top (fraction 25) of the gradient, precipitated, run in SDS-polyacrylamide gels, and immunoblotted (IB). Note that SWAP-70 shows at least three main peaks on fractions 9.7, 13.6, and 16.7 (from left to right in the chart), which correspond to estimated S values of 14.2 S, 10.4 S, and 7.4 S, respectively, suggesting the presence of tetramers, trimers, and dimers. The experimentally determined native molecular masses (see under “Experimental Procedures”) for SWAP-70 tetramers, trimers, and dimers are 286 kDa (14.2 S), 209 kDa (10.4 S), and 148 kDa (7.4 S), respectively. Theoretical molecular mass of SWAP-70 is 71.6 kDa. Svedberg units (S). Representatives of four independent experiments are shown. F, native gel electrophoresis of recombinant SWAP-70 reveals oligomers. 1 μg of SWAP-70 and 0.4 μg of SWAP-70 C-term were resolved and immunoblotted with anti-SWAP-70. Proteins were precleared by ultracentrifugation at 40,000 rpm for 30 min at 4 °C to remove possible protein aggregates. Note that the buffer conditions used for the gel filtration experiments vary from the ones used in these assays. Representatives of at least four independent experiments are shown. G, SWAP-70w/oCC binds F-actin similar to full-length SWAP-70. 2 μm F-actin was incubated with 2 μm SWAP-70 or 2 μm SWAP-70w/oCC followed by a high speed pelleting assay (co-sedimentation assay). Samples were analyzed on Coomassie-stained gels. Supernatants (S) contain G-actin, and pellets (P) contain F-actin together with F-actin-bound proteins. H, quantification by densitometry of proteins bound (protein in pellets) or not bound (protein in supernatants) to F-actin from at least four independent experiments as in G. Error bars indicate ± S.D. a.u., arbitrary units. I, SWAP-70w/oCC fails to bundle actin filaments in low speed pelleting assays. Conditions are as in Fig. 2A. J, quantification by densitometry of bundled actin (actin in pellet) from four independent experiments as in I. Error bars indicate ± S.D. Representatives of at least three independent experiments are shown.
FIGURE 5.
FIGURE 5.
SWAP-70 deficiency alters actin dynamics in SCF-stimulated BMMCs. A, SWAP-70 deficiency results in decreased bundled F-actin in BMMCs. Partitioning of actin into Triton X-100-insoluble LSP (higher order bundled F-actin), HSP (noncross-linked F-actin), and Triton X-100-soluble HSS (monomeric actin) is shown. Proteins were resolved by SDS-PAGE and immunoblotted. A representative experiment is shown. B, actin levels in each fraction were quantified by densitometry from four independent experiments as in A. Values were normalized to total actin (LSP+HSS+HSP) in WT 0 min SCF (referred as control) and expressed as percentage. The star indicates a p value <0.05 comparing the same fractions in WT and Swap-70−/−. Error bars indicate ± S.E. C, SWAP-70 deficiency leads to lower total F-actin levels in BMMCs. Flow cytometry histogram of cells stained for F-actin with rhodamine-phalloidin. Gray curve represents unstained cells. At least 10,000 cells per condition were recorded. D, F-actin mean fluorescence intensity (MFI) values from four independent experiments as in C were normalized to WT 0 min SCF and expressed in arbitrary units (a.u.). Error bars indicate ± S.D. E, visualization of actin free barbed ends in BMMCs. Cells were permeabilized and labeled for barbed ends (Alexa Fluor 568-actin). Samples were analyzed by confocal microscopy. Optical section thickness ∼1 μm. Scale bar, 10 μm. Representative cells are shown. F, quantification of actin free barbed ends from experiments as in E. 35–45 cells were analyzed per condition. Data are shown using a Box-and-Whisker plot as in Fig. 2E. WT (+/+) or Swap-70−/− (−/−). a.u., arbitrary units. Representative of at least three independent experiments are shown.
FIGURE 6.
FIGURE 6.
Cofilin associates directly with SWAP-70. A, co-immunoprecipitation of cofilin and Venus-SWAP-70. Protein extracts from NIH 3T3 cells expressing Venus-SWAP-70 were subjected to Co-IP with anti-cofilin or anti-IgG isotype control. Immunocomplexes were resolved by SDS-PAGE and immunoblotted (IB). B, co-localization of SWAP-70 and cofilin increases upon SCF stimulation in BMMCs. Immunofluorescence of WT BMMCs stimulated or not with SCF. Images were acquired by confocal microscopy. Pearson's R values were calculated as described under “Experimental Procedures” (a value of 1 indicates perfect co-localization). 50–65 cells were analyzed per condition. Representative cells are shown. ± indicates S.D. Scale bar, 10 μm. Representative of two independent experiments is shown. C–E, FRET interaction between Venus-SWAP-70 and Cerulean-cofilin increases after cytokine stimulation. NIH 3T3 cells expressing Venus-SWAP-70 and Cerulean-cofilin or controls were stimulated with 15 nm EGF and analyzed by acceptor photobleaching FRET. Fluorescence intensities were acquired before and after bleaching a region of interest (white box) with a 510 nm laser (100% power). FRET efficiency was determined as described under “Experimental Procedures.” Representative images for one cell 3 min after stimulation are shown. Scale bar, 10 μm. 20–30 cells were analyzed per condition. D, FRET efficiency quantification from experiments in C. Data were normalized for protein expression levels per cell. Error bars indicate ± S.D. E, Venus-SWAP-70 and Cerulean-cofilin interact more efficiently close to the plasma membrane. FRET efficiency is displayed as a three-dimensional surface plot. Inset shows the image used. A representative cell is shown. F, purified cofilin directly binds SWAP-70 in in vitro pulldown assays. GST-Rac1 was used as a positive control. G, quantification by densitometry of at least three independent experiments as in F. Error bars indicate ± S.D. H, binding affinity of SWAP-70 and cofilin in in vitro pulldown assays. Increasing concentrations of GST-cofilin (0.1–1.6 μm) were incubated with 0.4 μm SWAP-70. Samples were resolved and immunoblotted with anti-SWAP-70. Quantification by densitometry of three independent experiments. Curve shows the best fit for the data. Error bars indicate ± S.D. a.u., arbitrary units. Representative of at least three independent experiments are shown.
FIGURE 7.
FIGURE 7.
Cofilin activity is moderately diminished by SWAP-70 in vitro. A, SWAP-70 displaces cofilin from F-actin. 2 μm F-actin (10% pyrene-actin) was mixed with SWAP-70 (0.1, 0.25, 0.5, and 1 μm), incubated for 10 min, and mixed with 2 μm cofilin followed by a high speed pelleting assay. Supernatants (S) and pellets (P) were analyzed on Coomassie-stained gels and quantified by densitometry. Soluble cofilin (not bound to F-actin) in the control without SWAP-70 was subtracted from every data point and plotted as percentage of total cofilin. One star indicates a p value <0.05; two stars indicate a p value <0.01. Error bars indicate ± S.E. Data from three independent experiments are shown. Below, SWAP-70 counteracts the pyrene fluorescence quenching caused by cofilin. Conditions as in A, but after cofilin addition pyrene fluorescence was immediately measured. The fluorescence value after cofilin addition was subtracted from the value before cofilin addition and normalized to the control without SWAP-70 (arbitrarily set to 0 for plotting purposes). Representative of three independent experiments is shown. B and C, SWAP-70 partially prevents the effects of cofilin on F-actin depolymerization. F-actin depolymerization induced by dilution in the presence of SWAP-70 and/or cofilin. B, F-actin was mixed with SWAP-70, incubated 10 min, and diluted 4-fold with or without cofilin. C, magnesium-actin was polymerized in the presence of SWAP-70 or buffer for 3 h and then diluted as in B. D, visualization of F-actin from the experiment in C. At least 10 random images per condition were acquired. Representative images are shown. Time is in minutes. Scale bar, 10 μm. E, modest decrease on cofilin severing activity under actin polymerization conditions in the presence of SWAP-70. Time course of actin polymerization in the presence of cofilin and SWAP-70. a.u., arbitrary units. F, SWAP-70 C-term slightly decreases cofilin severing activity under TIRFM polymerization conditions. Proteins were preincubated for 1 min before the addition of nonmuscle G-actin. Fascin was used as control. Time is in minutes. Scale bar, 10 μm. G, quantification of the number of free filaments 15 min after polymerization began. Shown are the fold increases between two conditions. All single, free filaments in the field of view (0.01 × 0.01 cm) from three movies per condition were counted. Error bars indicate ± S.D. See also supplemental Movie S4.
FIGURE 8.
FIGURE 8.
Cofilin activity is misregulated in BMMCs in the absence of SWAP-70. A, reduced cofilin dephosphorylation in response to SCF in Swap-70−/− BMMCs. Immunoblots (IB) of total cell extracts resolved by SDS-PAGE. p-cofilin (phospho-cofilin). B, quantification by densitometry of p-cofilin levels from 2 to 4 independent experiments as in A. p-cofilin was plotted relative to the control WT 0 min SCF set arbitrarily as 1. a.u., arbitrary units. C, reduced cofilin dephosphorylation in Swap-70−/− BMMCs. Immunoprecipitation of soluble cofilin from Nonidet P-40 lysates of SCF-stimulated BMMCs. Immunocomplexes were analyzed by immunoblot with anti-p-cofilin and then re-probed with anti-cofilin to determine total cofilin amounts. p-cofilin/cofilin (p-cof/cof) ratio is shown and was determined by densitometry. A representative of two independent experiments is shown. D, lack of SWAP-70 causes cofilin to aberrantly distribute into Triton X-100-insoluble, cytoskeletal protein fractions. Cell fractionation into Triton X-100-soluble (cytoplasmic) and Triton X-100-insoluble (cytoskeletal/membrane) fractions. Proteins resolved by SDS-PAGE were immunoblotted. A representative experiment is shown. Protein levels are shown in bar charts below the immunoblots. Cofilin/tubulin and SWAP-70/tubulin ratios from four independent experiments were quantified by densitometry and were plotted relative to cytoplasmic WT 0 min SCF set arbitrarily as 1. E, localization of cofilin to F-actin rich regions is increased in Swap-70−/− BMMCs. Cells were immunostained and analyzed by confocal microscopy. Representative cells are shown. Scale bar, 10 μm. F, Pearson's R values (co-localization index) were calculated for cofilin/F-actin and Arp2/F-actin as described under “Experimental Procedures.” 85–100 cells were analyzed per condition. WT (+/+) or Swap-70−/− (−/−) are shown. Error bars indicate ± S.D. Representative of at least three independent experiments are shown.

Similar articles

Cited by

References

    1. Pollard T. D., Borisy G. G. (2003) Cellular motility driven by assembly and disassembly of actin filaments. Cell 112, 453–465 - PubMed
    1. Pollard T. D., Cooper J. A. (2009) Actin, a central player in cell shape and movement. Science 326, 1208–1212 - PMC - PubMed
    1. Le Clainche C., Carlier M. F. (2008) Regulation of actin assembly associated with protrusion and adhesion in cell migration. Physiol. Rev. 88, 489–513 - PubMed
    1. Vignjevic D., Yarar D., Welch M. D., Peloquin J., Svitkina T., Borisy G. G. (2003) Formation of filopodia-like bundles in vitro from a dendritic network. J. Cell Biol. 160, 951–962 - PMC - PubMed
    1. Stevenson R. P., Veltman D., Machesky L. M. (2012) Actin-bundling proteins in cancer progression at a glance. J. Cell Sci. 125, 1073–1079 - PubMed

Publication types

MeSH terms