. 2013 Sep 13;288(37):26649-57.
doi: 10.1074/jbc.M113.463018. Epub 2013 Aug 6.

BmCREC is an endoplasmic reticulum (ER) resident protein and required for ER/Golgi morphology

Affiliations

BmCREC is an endoplasmic reticulum (ER) resident protein and required for ER/Golgi morphology

Qiao Wang et al. J Biol Chem. .

Abstract

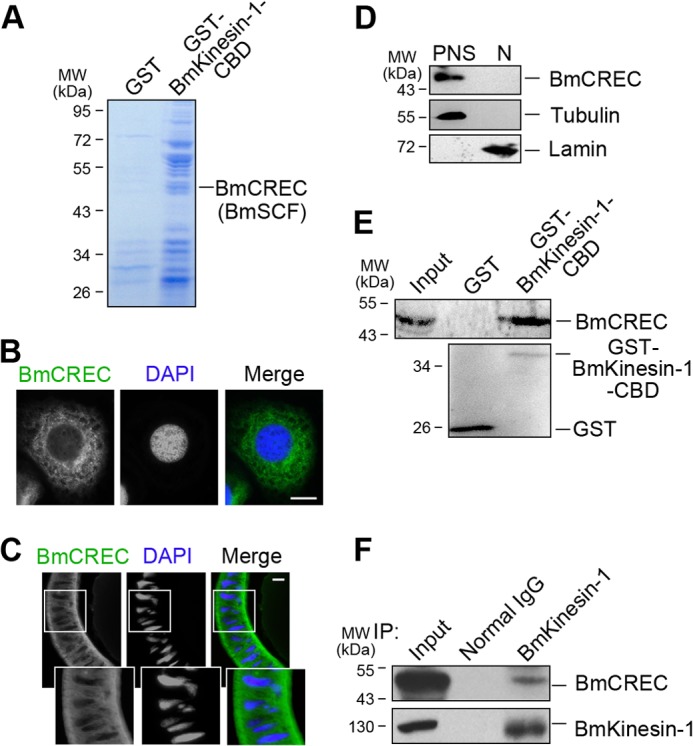
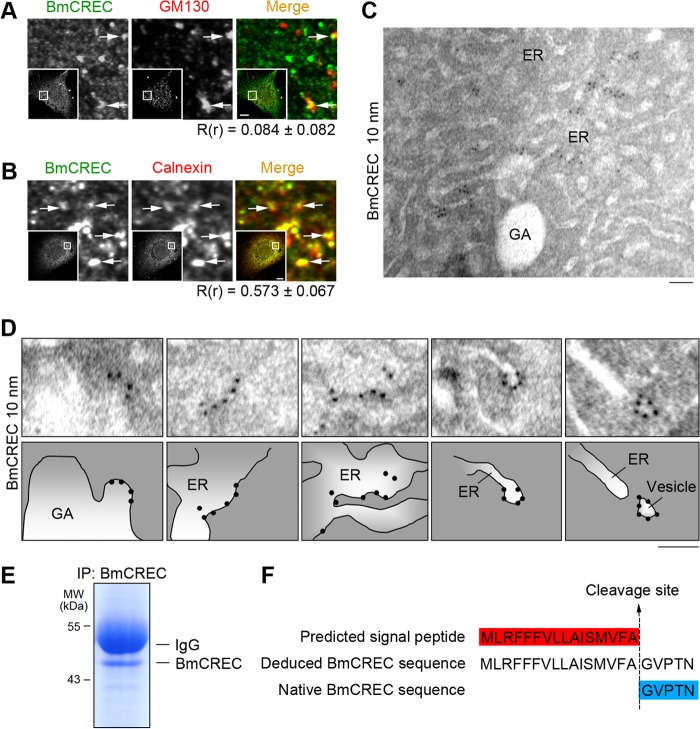
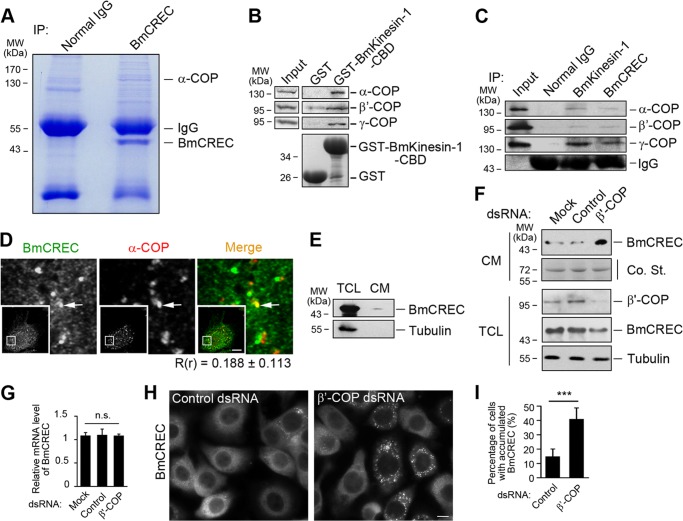
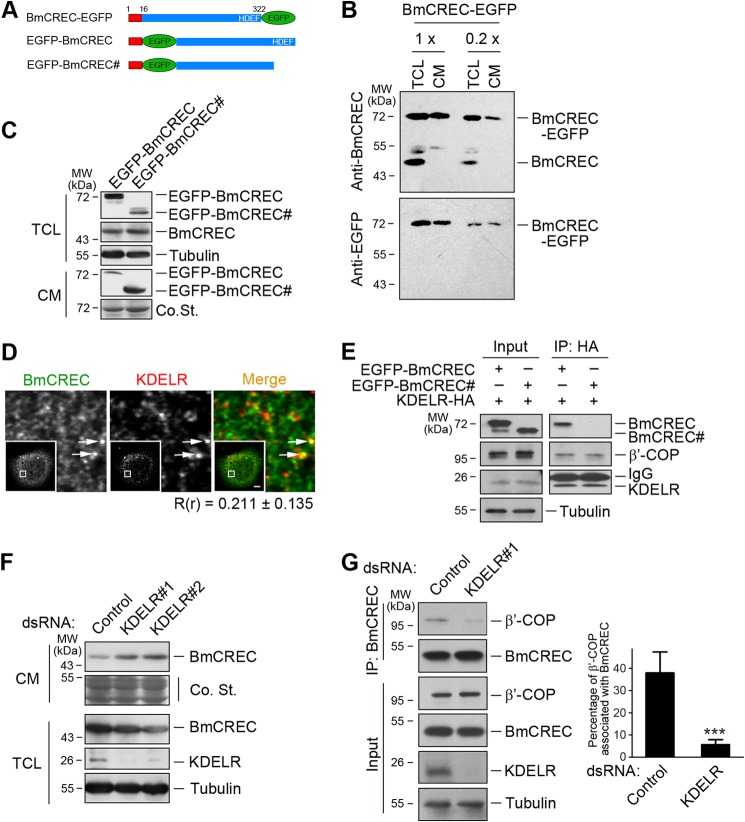
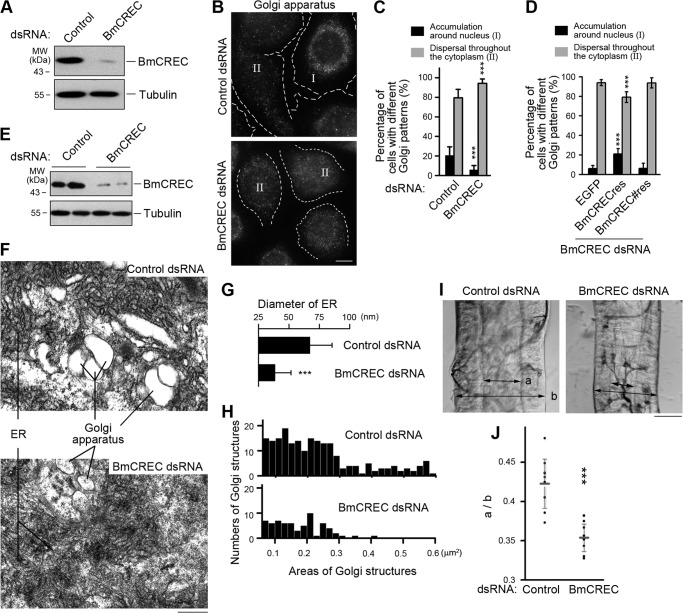
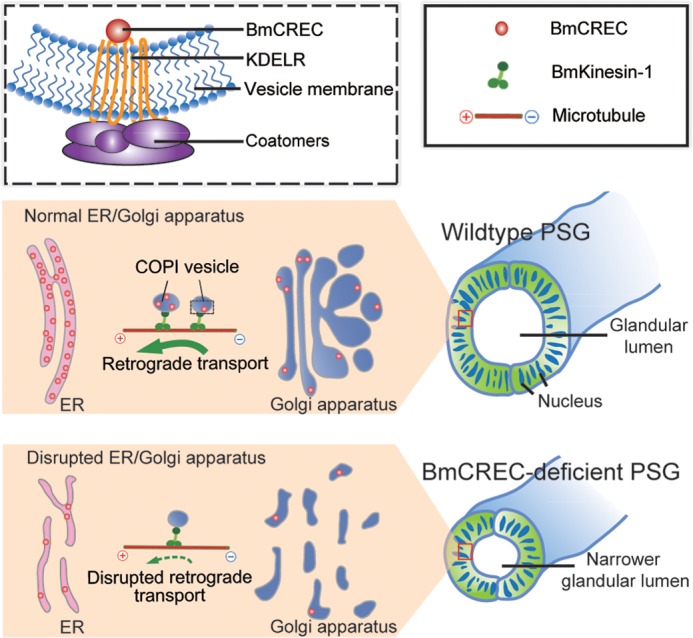
Silkworm posterior silkgland is a model for studying intracellular trafficking. Here, using this model, we identify several potential cargo proteins of BmKinesin-1 and focus on one candidate, BmCREC. BmCREC (also known as Bombyx mori DNA supercoiling factor, BmSCF) was previously proposed to supercoil DNA in the nucleus. However, we show here that BmCREC is localized in the ER lumen. Its C-terminal tetrapeptide HDEF is recognized by the KDEL receptor, and subsequently it is retrogradely transported by coat protein I (COPI) vesicles to the ER. Lacking the HDEF tetrapeptide of BmCREC or knocking down COPI subunits results in decreased ER retention and simultaneously increased secretion of BmCREC. Furthermore, we find that BmCREC knockdown markedly disrupts the morphology of the ER and Golgi apparatus and leads to a defect of posterior silkgland tube expansion. Together, our results clarify the ER retention mechanism of BmCREC and reveal that BmCREC is indispensable for maintaining ER/Golgi morphology.

Keywords: BmCREC; COPI; Endoplasmic Reticulum (ER); Golgi; Intracellular Trafficking; KDEL Receptor; Kinesin; PSG Tube Expansion; Vesicles.


Figures

FIGURE 1.
FIGURE 1.
BmCREC is associated with BmKinesin-1. A, pulldown assay with GST or GST-BmKinesin-1-CBD in PSG homogenates. The precipitates were subjected to SDS-PAGE and Coomassie Blue staining. The indicated band was identified as BmCREC by LC-MS/MS analysis. B and C, immunostaining of BmCREC in BmN cells (B) and PSG cryosections (C). DAPI marks the nucleus. Boxed areas in C are magnified in the lower panel. Scale bars, 10 μm. D, Western blotting analysis of nuclear/cytoplasmic extraction fractions. PNS, postnuclear supernatant; N, nuclear fraction. E, Western blotting analysis of GST or GST-BmKinesin-1-CBD pulldown precipitates from PSG homogenates. F, immunoprecipitation (IP) of PSG homogenates with anti-BmKinesin-1 antibody. The immunoprecipitates were analyzed by Western blotting with the indicated antibodies.
FIGURE 2.
FIGURE 2.
BmCREC is translocated into the ER lumen through its N-terminal signal peptide. A and B, coimmunostaining of BmCREC (green) and a cis-Golgi marker GM130 (red), or an ER marker calnexin (red). Rectangle areas are magnified, and the arrows indicate their colocalization. Pearson correlation coefficient R(r) is shown as mean ± S.D., n = 10. Scale bars, 10 μm. C and D, immunoelectron microscopy of PSG cells labeled with anti-BmCREC antibody (10-nm gold particles). The corresponding schematic pictures are shown in the lower panel of D. GA, Golgi apparatus. Scale bars, 100 nm. E, SDS-PAGE analysis of the immunoprecipitates (IP) from PSG homogenates with anti-BmCREC antibody. Gel was stained with Coomassie Blue. The purified endogenous BmCREC band was subjected to standard Edman degradation assay to assess the N-terminal amino acids of BmCREC. F, schematic picture showing the signal peptide of BmCREC. Red highlights the predicted signal peptide, GVPTN (blue) marks the first five amino acids of BmCREC, and the dashed line indicates the cleavage site.
FIGURE 3.
FIGURE 3.
BmCREC is retrieved to the ER via COPI transport. A, SDS-PAGE analysis of the immunoprecipitates (IP) from PSG homogenates with anti-BmCREC antibody. Gel was stained with Coomassie Blue. α-COP was identified by LC-MS/MS. B, Western blotting analysis of GST or GST-Kinesin-1-CBD pulldown precipitates from PSG homogenates. C, immunoprecipitation (IP) analysis of PSG homogenates with anti-BmKinesin-1 or anti-BmCREC antibody. The immunoprecipitates were analyzed by Western blotting with the indicated antibodies. D, coimmunostaining of BmCREC (green) and α-COP (red) in BmN cells. Rectangle areas are magnified. Pearson correlation coefficient R(r) is shown as mean ± S.D., n = 10. Arrows indicate colocalized dots. Scale bar, 10 μm. E, Western blotting analysis of BmCREC in BmN cells. TCL, total cell lysate; CM, conditioned medium. F and G, Western blotting (F) and quantitative real-time PCR (G) analysis of BmN cells treated with control or β′-COP dsRNA. Coomassie blue staining (Co.St.) and tubulin were used as a loading control in F. Data in G are shown as mean ± S.D. (error bars); n.s. means not significant, n = 3. H, control- or β′-COP-dsRNA-treated BmN cells immunostained with anti-BmCREC antibody. Scale bar, 10 μm. I, quantification of the percentage of cells with accumulated BmCREC distribution pattern in H. Data are shown as mean ± S.D.. ***, p < 0.001, n = 20 or 23 fields, ≥20 cells examined per field.
FIGURE 4.
FIGURE 4.
KDELR mediates the association of BmCREC with COPI. A, schematic picture showing constructs of EGFP-tagged BmCREC fusion proteins. Red areas of the N terminus represent signal peptide (1–16 amino acids); BmCREC# indicates BmCREC without tetrapeptide HDEF in the C terminus. B, Western blotting analysis of BmCREC in BmCREC-EGFP-overexpressing BmN cells. TCL, total cell lysate; CM, conditioned medium. 1× and 0.2× indicate different dilutions. C, Western blotting analysis of BmCREC in EGFP-BmCREC- or EGFP-BmCREC#-overexpressing BmN cells. D, coimmunostaining of BmCREC (green) and KDELR (red) in BmN cells. Rectangle areas are magnified, and arrows indicate their colocalization. Pearson correlation coefficient R(r) is shown as mean ± S.D., n = 10. Scale bar, 10 μm. E, immunoprecipitation (IP) analysis of BmN cell lysates with anti-HA antibody. Cells co-overexpressing KDELR-HA with EGFP-BmCREC or EGFP-BmCREC# (without HDEF) were used. The immunoprecipitates were analyzed by Western blotting with the indicated antibodies. F, Western blotting analysis of control- or KDELR-dsRNA-transfected BmN cells. G, lysates of control- or KDELR-dsRNA-transfected BmN cells subjected to immunoprecipitation with anti-BmCREC antibody. The immunoprecipitates were detected by Western blotting with the indicated antibodies. Quantification of the percentage of the immunoprecipitated β′-COP compared with total β′-COP is shown in the right column. Data are shown as mean ± S.D. (error bars). ***, p < 0.001, n = 3.
FIGURE 5.
FIGURE 5.
BmCREC is required for ER/Golgi morphology maintenance and PSG tube expansion. A, Western blotting analysis of knockdown efficiency of BmCREC dsRNA in BmN cells. B, immunostaining of GM130 in control- or BmCREC-dsRNA-transfected BmN cells. Two types of Golgi apparatus distribution patterns are shown: I, around nucleus; II, dispersed in the cytoplasm. Scale bar, 10 μm. C, quantification of the percentage of BmN cells with different Golgi apparatus distribution patterns corresponding to B. Data are shown as mean ± S.D. (error bars). ***, p < 0.001, n = 20 fields, ≥20 cells were examined per field. D, quantification of the percentage of cells with different Golgi apparatus distribution patterns in BmCREC-deficient cells rescued by dsRNA-resistant GFP-BmCREC (BmCRECres) or GFP-BmCREC# (BmCREC#res, without HDEF). Data are shown as mean ± S.D.. ***, p < 0.001, n = 20 fields, ≥20 cells were examined per field. E, Western blotting analysis of BmCREC knockdown efficiency in dsRNA-injected PSG. F, electron micrographs of PSG cells from dsRNA-injected silkworms. Scale bar, 100 nm. G and H, quantification of the diameters of the ER (G) and areas of the Golgi structures (H) from control- or BmCREC-dsRNA-treated PSG cells in F. Data in G are shown as mean ± S.D. ***, p < 0.001, n = 60. I and J, representative pictures (I) and quantification (J) of glandular lumen diameter (a) to the tube diameter (b) of PSG injected with control or BmCREC dsRNA. Scale bar, 100 μm. Data are shown as mean ± S.D. ***, p < 0.001, n = 10.
FIGURE 6.
FIGURE 6.
Proposed model for the ER retention mechanism of BmCREC and its function. In the PSG cells, BmCREC is recognized by KDELR and retrogradely transported from the Golgi apparatus to the ER by BmKinesin-1-driven COPI vesicles. BmCREC deficiency disrupts ER/Golgi morphology and leads to narrower PSG tube.

Similar articles

References

    1. Bonifacino J. S., Lippincott-Schwartz J. (2003) Coat proteins: shaping membrane transport. Nat. Rev. Mol. Cell Biol. 4, 409–414 - PubMed
    1. Lee M. C., Miller E. A., Goldberg J., Orci L., Schekman R. (2004) Bi-directional protein transport between the ER and Golgi. Annu. Rev. Cell Dev. Biol. 20, 87–123 - PubMed
    1. Styers M. L., O'Connor A. K., Grabski R., Cormet-Boyaka E., Sztul E. (2008) Depletion of β-COP reveals a role for COP-I in compartmentalization of secretory compartments and in biosynthetic transport of caveolin-1. Am. J. Physiol. Cell Physiol. 294, C1485–1498 - PubMed
    1. Wang Q., Shen B., Zheng P., Feng H., Chen L., Zhang J., Zhang C., Zhang G., Teng J., Chen J. (2010) Silkworm coatomers and their role in tube expansion of posterior silkgland. PLoS ONE 5, e13252. - PMC - PubMed
    1. Grieder N. C., Caussinus E., Parker D. S., Cadigan K., Affolter M., Luschnig S. (2008) γCOP is required for apical protein secretion and epithelial morphogenesis in Drosophila melanogaster. PLoS ONE 3, e3241. - PMC - PubMed

Publication types

LinkOut - more resources