

Comprehensive analysis of microRNA (miRNA) targets in breast cancer cells
- PMID: 23921383
- PMCID: PMC3779742
- DOI: 10.1074/jbc.M113.491803
Comprehensive analysis of microRNA (miRNA) targets in breast cancer cells
Abstract
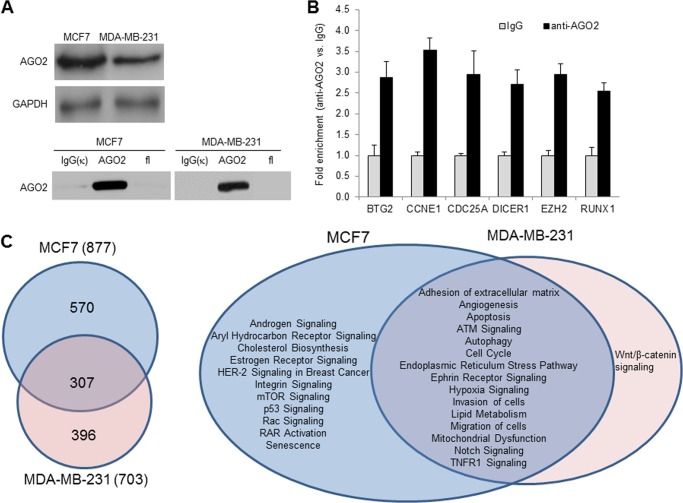
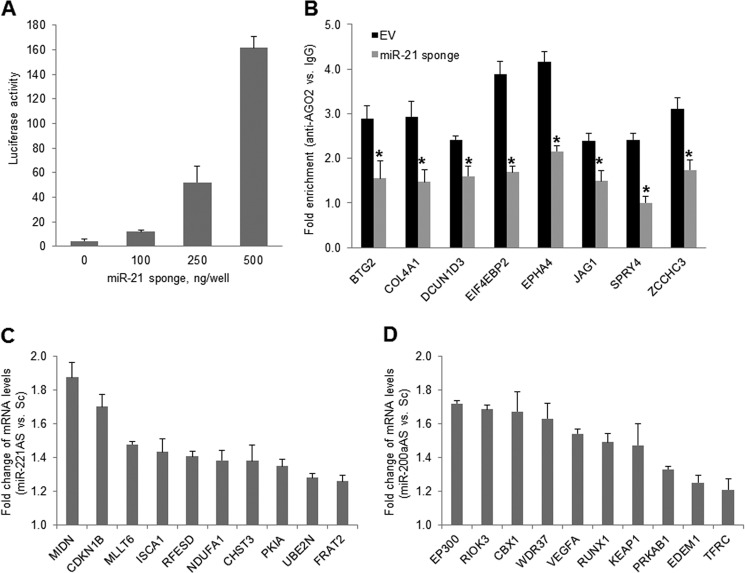
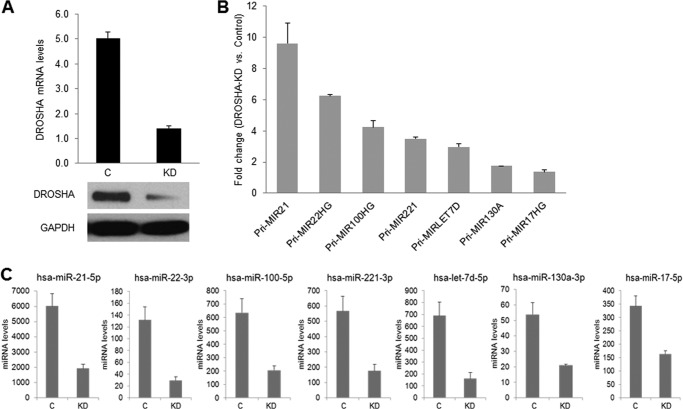
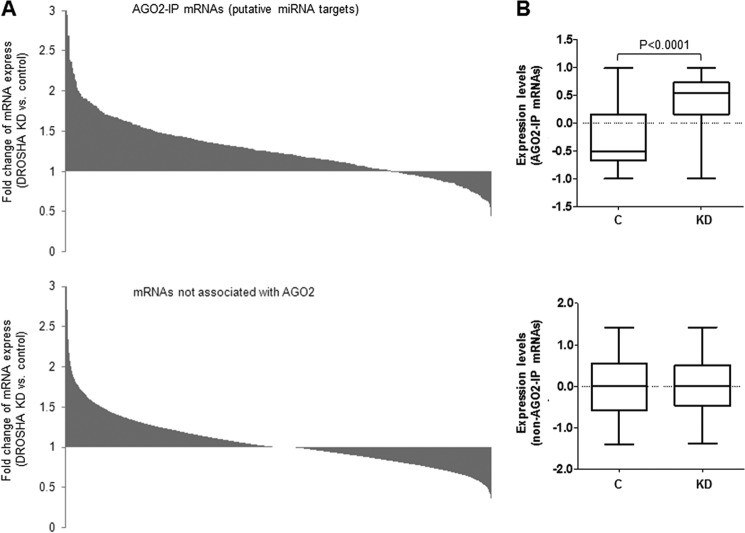
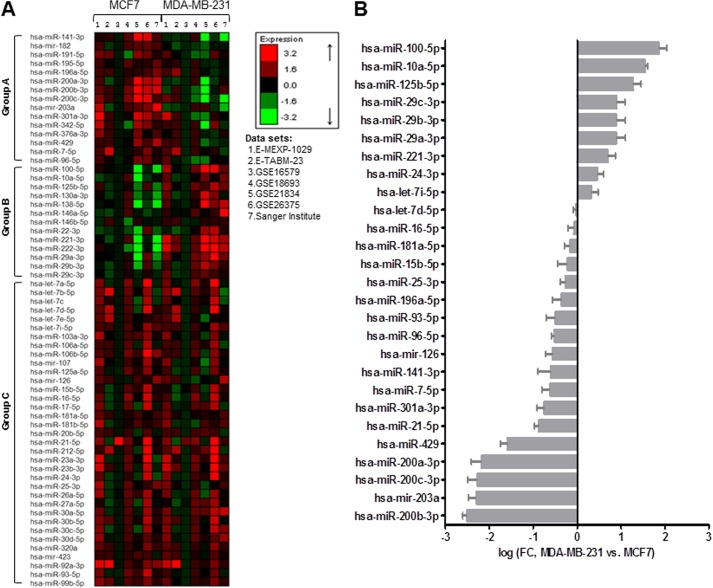
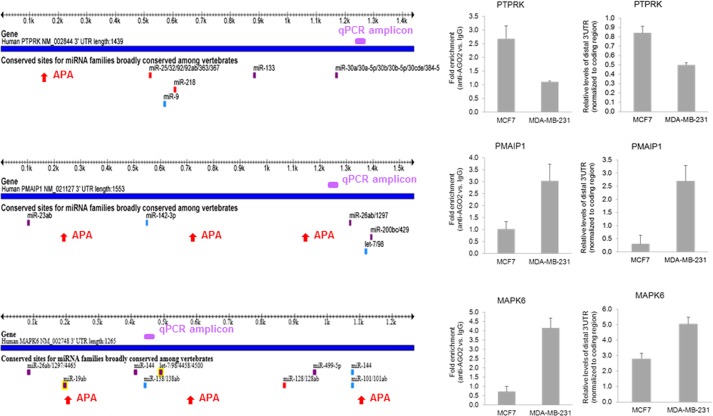
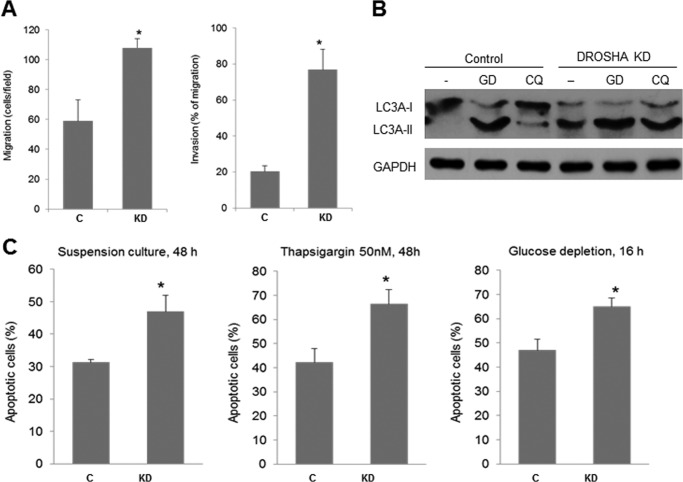
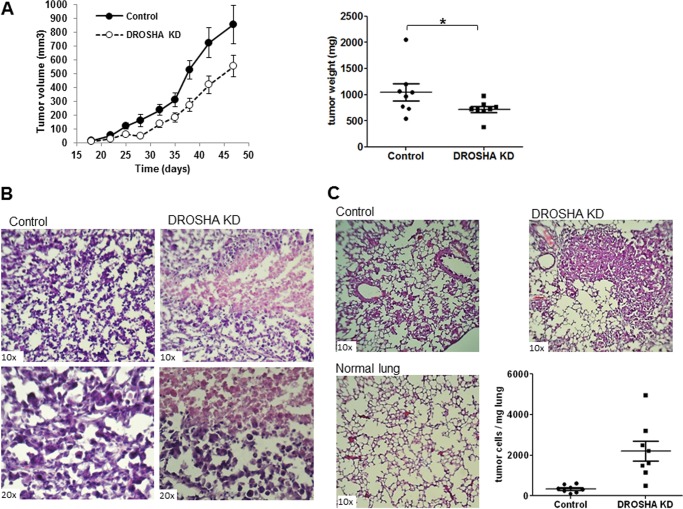
MicroRNAs (miRNAs) regulate mRNA stability and translation through the action of the RNAi-induced silencing complex. In this study, we systematically identified endogenous miRNA target genes by using AGO2 immunoprecipitation (AGO2-IP) and microarray analyses in two breast cancer cell lines, MCF7 and MDA-MB-231, representing luminal and basal-like breast cancer, respectively. The expression levels of ∼70% of the AGO2-IP mRNAs were increased by DROSHA or DICER1 knockdown. In addition, integrated analysis of miRNA expression profiles, mRNA-AGO2 interaction, and the 3'-UTR of mRNAs revealed that >60% of the AGO2-IP mRNAs were putative targets of the 50 most abundantly expressed miRNAs. Together, these results suggested that the majority of the AGO2-associated mRNAs were bona fide miRNA targets. Functional enrichment analysis uncovered that the AGO2-IP mRNAs were involved in regulation of cell cycle, apoptosis, adhesion/migration/invasion, stress responses (e.g. DNA damage and endoplasmic reticulum stress and hypoxia), and cell-cell communication (e.g. Notch and Ephrin signaling pathways). A role of miRNAs in regulating cell migration/invasion and stress response was further defined by examining the impact of DROSHA knockdown on cell behaviors. We demonstrated that DROSHA knockdown enhanced cell migration and invasion, whereas it sensitized cells to cell death induced by suspension culture, glucose depletion, and unfolding protein stress. Data from an orthotopic xenograft model showed that DROSHA knockdown resulted in reduced growth of primary tumors but enhanced lung metastasis. Taken together, these results suggest that miRNAs collectively function to promote survival of tumor cells under stress but suppress cell migration/invasion in breast cancer cells.
Keywords: Breast Cancer; Gene Regulation; Metastasis; MicroRNA; Stress Response.
Figures
Similar articles
-
Dicer1-mediated miRNA processing shapes the mRNA profile and function of murine platelets.Blood. 2016 Apr 7;127(14):1743-51. doi: 10.1182/blood-2015-07-661371. Epub 2016 Jan 14. Blood. 2016. PMID: 26773046 Free PMC article.
-
Autophagic degradation of SQSTM1 inhibits ovarian cancer motility by decreasing DICER1 and AGO2 to induce MIRLET7A-3P.Autophagy. 2018;14(12):2065-2082. doi: 10.1080/15548627.2018.1501135. Epub 2018 Aug 17. Autophagy. 2018. PMID: 30081720 Free PMC article.
-
MicroRNA-Independent Modulation of DICER1 Expression by hAgo2.Mol Cell Biol. 2020 Sep 28;40(20):e00221-20. doi: 10.1128/MCB.00221-20. Print 2020 Sep 28. Mol Cell Biol. 2020. PMID: 32778571 Free PMC article.
-
Regulation of microRNA biogenesis and function.Thromb Haemost. 2012 Apr;107(4):605-10. doi: 10.1160/TH11-12-0836. Epub 2012 Feb 8. Thromb Haemost. 2012. PMID: 22318703 Review.
-
miRNA biogenesis and inherited disorders: clinico-molecular insights.Trends Genet. 2023 May;39(5):401-414. doi: 10.1016/j.tig.2023.01.009. Epub 2023 Feb 28. Trends Genet. 2023. PMID: 36863945 Review.
Cited by
-
Down-regulated microRNA-124 expression as predictive biomarker and its prognostic significance with clinicopathological features in breast cancer patients.Diagn Pathol. 2015 Sep 29;10:178. doi: 10.1186/s13000-015-0391-0. Diagn Pathol. 2015. Retraction in: Diagn Pathol. 2016 Nov 2;11(1):122. doi: 10.1186/s13000-016-0560-9. PMID: 26415857 Free PMC article. Retracted.
-
sRNA-Effector: A tool to expedite discovery of small RNA regulators.iScience. 2024 Feb 20;27(3):109300. doi: 10.1016/j.isci.2024.109300. eCollection 2024 Mar 15. iScience. 2024. PMID: 38469560 Free PMC article.
-
KCa1.1, a calcium-activated potassium channel subunit alpha 1, is targeted by miR-17-5p and modulates cell migration in malignant pleural mesothelioma.Mol Cancer. 2016 Jun 1;15(1):44. doi: 10.1186/s12943-016-0529-z. Mol Cancer. 2016. PMID: 27245839 Free PMC article.
-
Systematic analysis of metastasis-associated genes identifies miR-17-5p as a metastatic suppressor of basal-like breast cancer.Breast Cancer Res Treat. 2014 Aug;146(3):487-502. doi: 10.1007/s10549-014-3040-5. Epub 2014 Jul 8. Breast Cancer Res Treat. 2014. PMID: 25001613 Free PMC article.
-
Myeloid Cell Modulation by Tumor-Derived Extracellular Vesicles.Int J Mol Sci. 2020 Aug 31;21(17):6319. doi: 10.3390/ijms21176319. Int J Mol Sci. 2020. PMID: 32878277 Free PMC article. Review.
References
-
- Lee Y., Ahn C., Han J., Choi H., Kim J., Yim J., Lee J., Provost P., Rådmark O., Kim S., Kim V. N. (2003) The nuclear RNase III Drosha initiates microRNA processing. Nature 425, 415–419 - PubMed
Publication types
MeSH terms
Substances
Associated data
- Actions
Grants and funding
LinkOut - more resources
Full Text Sources
Other Literature Sources
Medical
Molecular Biology Databases
Research Materials
Miscellaneous
