. 2013 Sep 20;288(38):27619-27637.
doi: 10.1074/jbc.M113.485482. Epub 2013 Aug 6.

The Bin/amphiphysin/Rvs (BAR) domain protein endophilin B2 interacts with plectin and controls perinuclear cytoskeletal architecture

Affiliations

The Bin/amphiphysin/Rvs (BAR) domain protein endophilin B2 interacts with plectin and controls perinuclear cytoskeletal architecture

Christian Vannier et al. J Biol Chem. .

Abstract

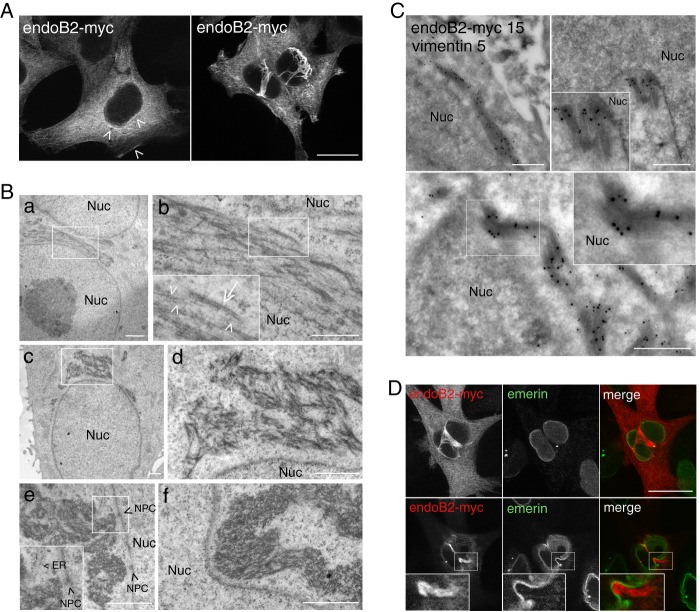
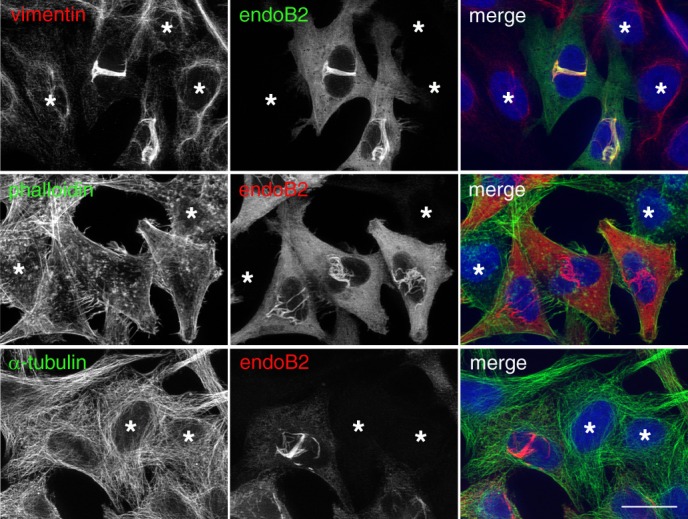
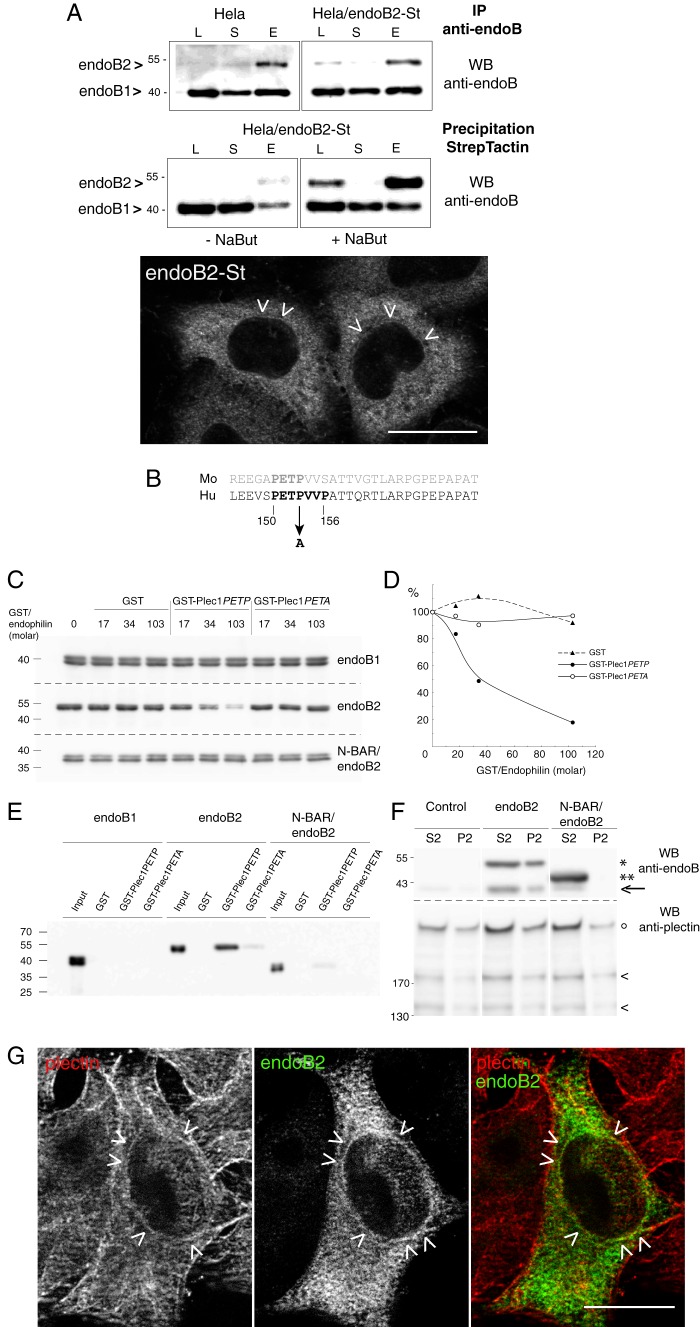
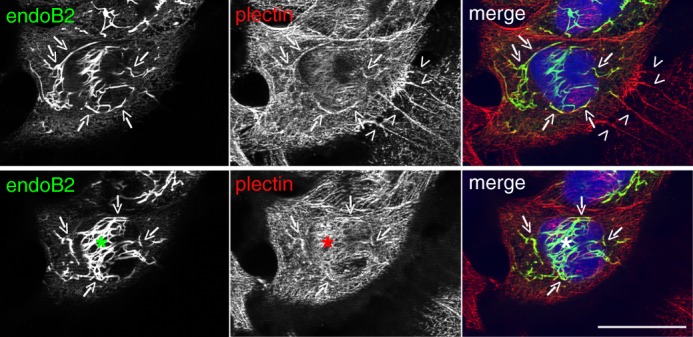
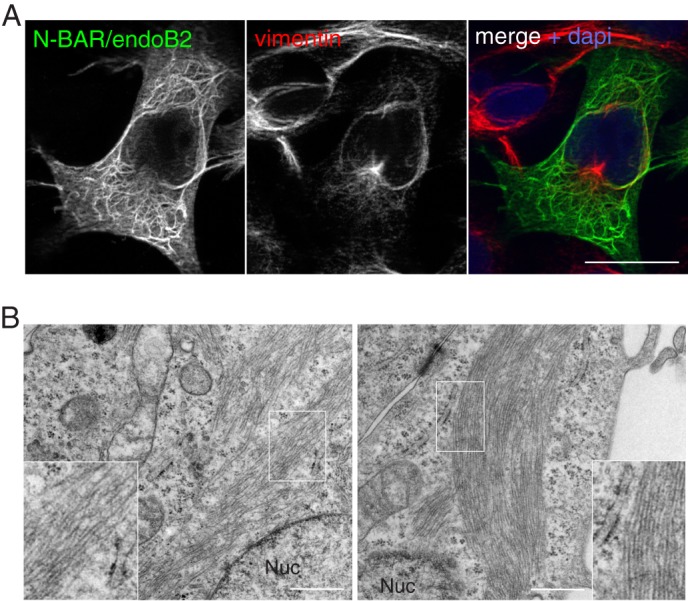
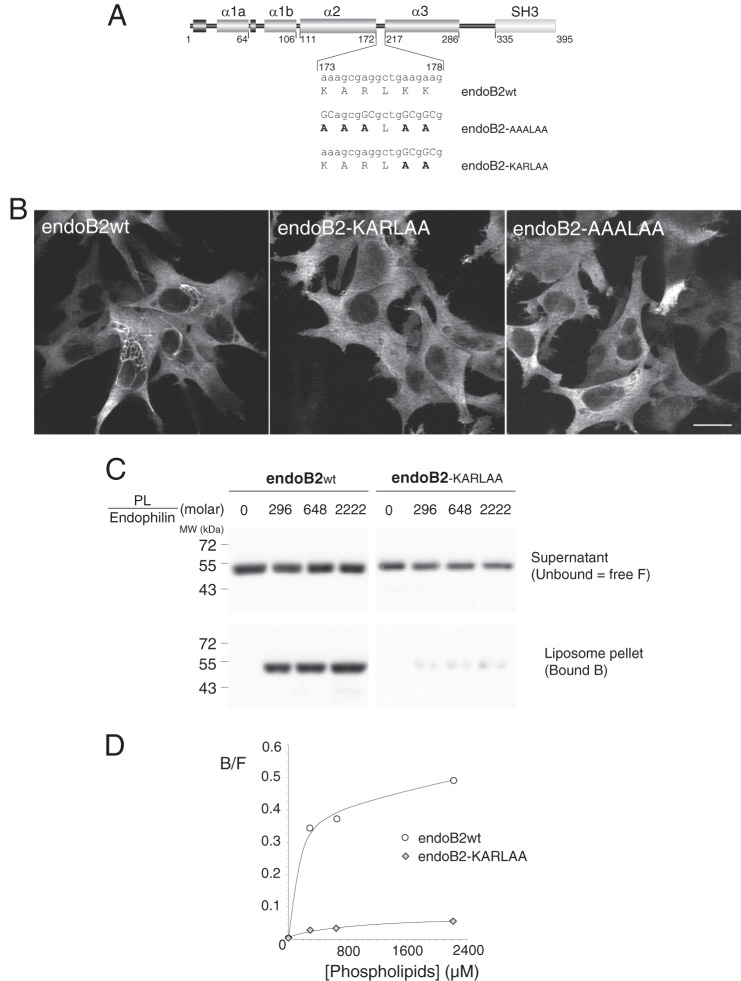
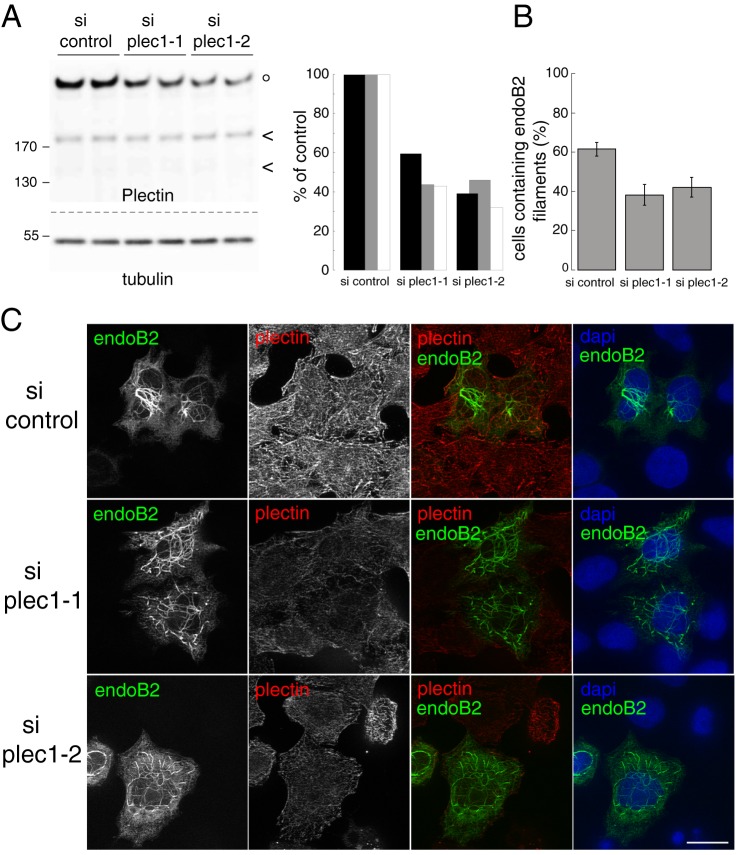
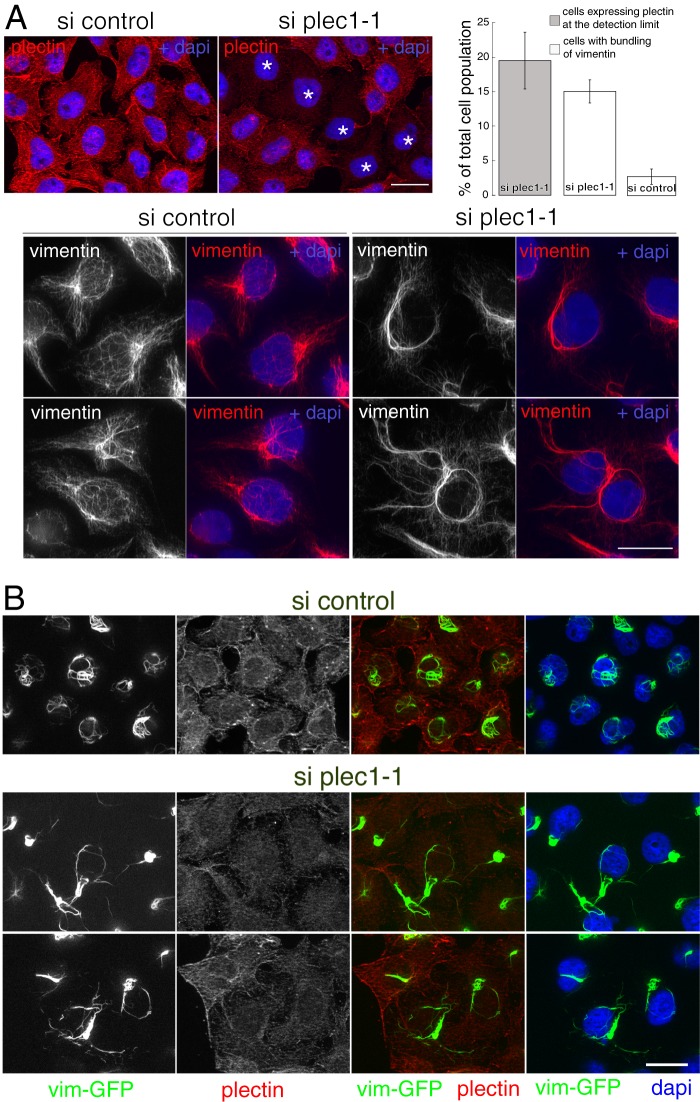
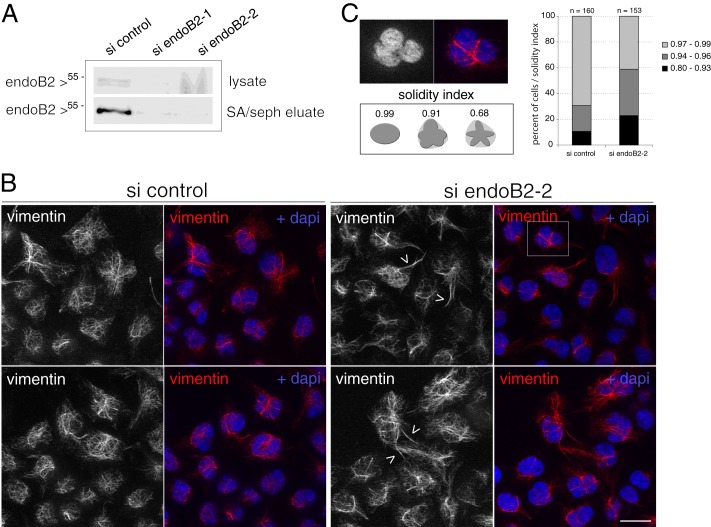
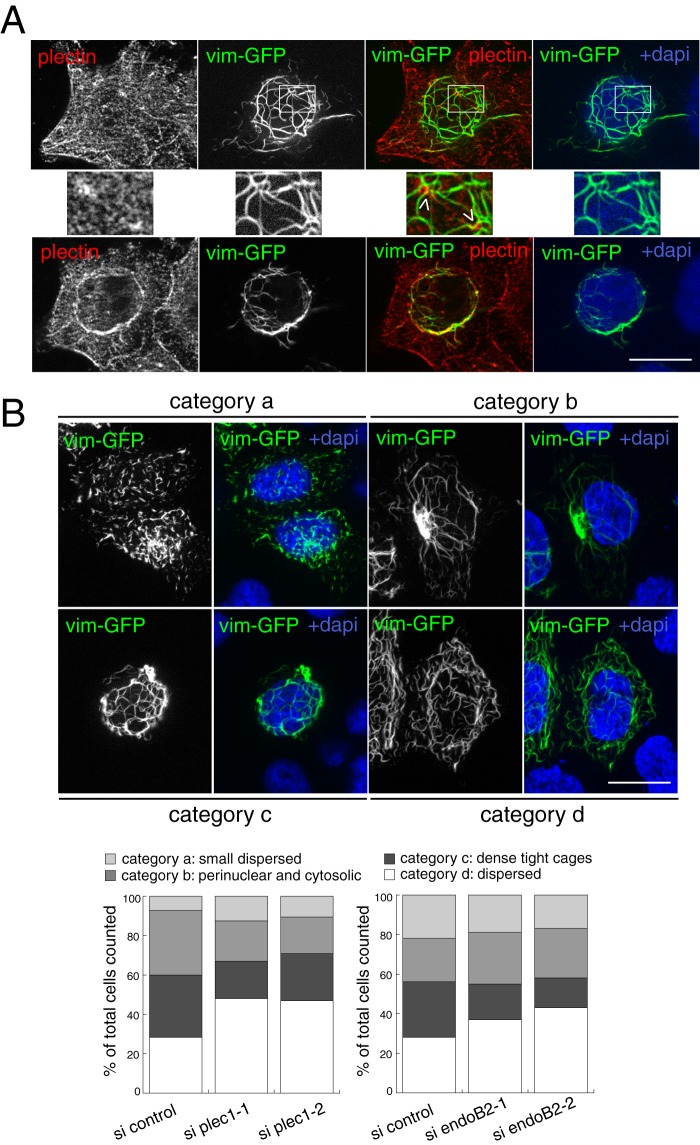
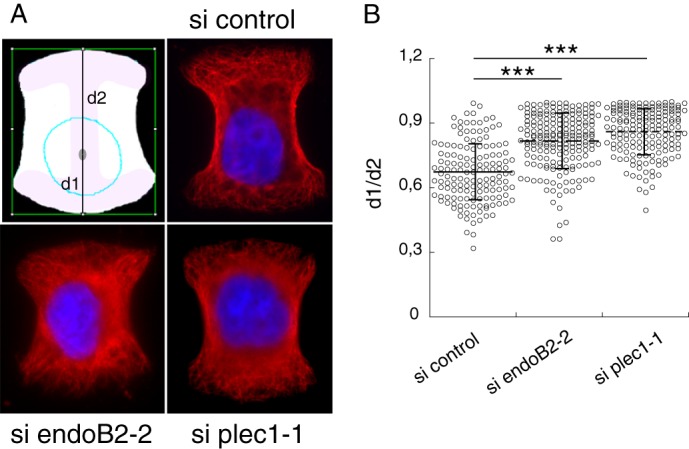
Proteins of the Bin/amphiphysin/Rvs (BAR) domain superfamily are essential in controlling the shape and dynamics of intracellular membranes. Here, we present evidence for the unconventional function of a member of the endophilin family of BAR and Src homology 3 domain-containing proteins, namely endophilin B2, in the perinuclear organization of intermediate filaments. Using mass spectrometry analysis based on capturing endophilin B2 partners in in situ pre-established complexes in cells, we unravel the interaction of endophilin B2 with plectin 1, a variant of the cytoskeleton linker protein plectin as well as with vimentin. Endophilin B2 directly binds the N-terminal region of plectin 1 via Src homology 3-mediated interaction and vimentin indirectly via plectin-mediated interaction. The relevance of these interactions is strengthened by the selective and drastic reorganization of vimentin around nuclei upon overexpression of endophilin B2 and by the extensive colocalization of both proteins in a meshwork of perinuclear filamentous structures. By generating mutants of the endophilin B2 BAR domain, we show that this phenotype requires the BAR-mediated membrane binding activity of endophilin B2. Plectin 1 or endophilin B2 knockdown using RNA interference disturbed the perinuclear organization of vimentin. Altogether, these data suggest that the endophilin B2-plectin 1 complex functions as a membrane-anchoring device organizing and stabilizing the perinuclear network of vimentin filaments. Finally, we present evidence for the involvement of endophilin B2 and plectin 1 in nuclear positioning in individual cells. This points to the potential importance of the endophilin B2-plectin complex in the biological functions depending on nuclear migration and positioning.

Keywords: BAR Domain; Cell Biology; Cytoskeleton; Endophilin; Intermediate Filaments; Membrane; Plectin; Protein Assembly; SH3 Domains.


Figures

FIGURE 1.
FIGURE 1.
Overexpression of endoB2 triggers the accumulation of filamentous structures around nuclei and is partly composed of intermediate filaments. HeLa cells were transfected to express endoB2 fused to a C-terminal Myc tag. A, anti-Myc immunofluorescence of z-sections with low expression level of endoB2 (left panel) showing cytosolic and discrete perinuclear as well as plasma membrane localization (arrowheads). At high expression level (right), endoB2 accumulates mainly as filamentous structures surrounding nuclei. Note that the two images were taken with different settings of the camera. z-sectioning through nuclei attested that cells are not binucleated. Scale bar, 20 μm. B, electron microscopy of Epon-embedded cells. Panels b and d correspond to magnifications of the areas delimited in (panels a and c) and show the presence of filaments of 5–10 nm diameter (arrowheads in panel b) and of 20–25 nm diameter (arrow in panel b). Panels e and f, note the proximity of bunches of filaments to nuclear membranes and nucleopore complexes (NPC (arrowheads in panel e)). ER, endoplasmic reticulum; Nuc, nucleus. Scale bars, panels a and c–f, 1 μm; panel b, 0.5 μm. C, immunoelectron microscopy using anti-Myc or anti-vimentin antibodies. Magnified areas at top right and bottom panels show the very close proximity of anti-Myc immunoreactivity to the nucleus. Nuc, nucleus; 5 nm gold, anti-vimentin; 15 nm gold, anti-Myc. Scale bar, 0.5 μm. D, anti-Myc and anti-emerin (a protein of the inner nuclear membrane) immunofluorescence of two z-sections at planes between the nucleus and the membrane contacting the coverslip (top images) or crossing the top of the nucleus (bottom images). Insets show invagination of the nuclear membrane in close contact with endoB2-myc staining. Scale bar, 20 μm.
FIGURE 2.
FIGURE 2.
EndoB2 triggers the selective re-organization of the vimentin cytoskeleton. HeLa cells were transfected to express endoB2 fused to a C-terminal Myc tag and processed for double immunofluorescence analysis using anti-Myc and either anti-vimentin (top panels) and anti-tubulin (bottom panels) antibodies or phalloidin-Alexa Fluor 488 (middle panels). Compare cells that express endoB2 with the ones that do not (asterisks). Scale bar, 20 μm.
FIGURE 3.
FIGURE 3.
Plec1 is a molecular partner of endoB2 SH3 domain. A, HeLa/endoB2-St, a stable cell line aimed at isolating in situ pre-formed complexes with endoB2 binding partners. Top two panels, Western blot (WB) analysis of lysates (L), supernatants (S) of precipitations, or eluates (E) from either immunoprecipitations (IP) on protein A-Sepharose (upper panel) or StrepTactin/Sepharose precipitations (lower panel) from HeLa or HeLa/endoB2-St cell lines as indicated (note that no background from beads was detected, neither for the protein A-Sepharose immunoprecipitations nor for the StrepTactin-Sepharose precipitations). Western blots were treated with anti-Bif-1 antibody recognizing both endoB2 and endoB1. Calibration curves using pure recombinant bacterial endoB1 and endoB2 showed that this antibody recognizes endoB1 with ∼10 times more affinity/avidity than endoB2. Detection of endoB2 in the lysates from either HeLa or HeLa/endoB2-St cells is stochastic, and in most experiments, immunoreactivity is undetectable unless HeLa/endoB2-St cells are treated with 5 mm sodium butyrate (compare in lower panel, −NaBut and +NaBut). From the immunoprecipitations (upper panel), it was estimated that the expression level of endoB2-St in HeLa/endoB2-St cells compares with endoB2 level in HeLa cells. From the StrepTactin-Sepharose precipitations (lower panel) and taking into account the 10-fold difference in anti-Bif-1 immunoreactivities mentioned above, it was calculated that a maximum of 40 or 2% of endoB2 is in a complex with endoB1 in the absence (− NaBut) or the presence (+ NaBut) of sodium butyrate, respectively. Bottom panel, immunodetection of endoB2-St in HeLa/endoB2-St cells treated overnight with 5 mm sodium butyrate and using an anti-StrepTag antibody. Arrowheads point at discrete immunoreactivity around nuclei (see also G). Note in addition the homogeneous staining that appears mainly cytosolic. Scale bar, 20 μm. B, alignment of mouse and human plec1 sequences (human amino acid residues 145–174) showing the putative PETP consensus motif for SH3 domain binding. The mutation (at position 153) is indicated to illustrate the difference between GST-plec1PETP and GST-plec1PETA. C, in vitro binding assay of endophilin B species to immobilized GST, GST-plec1PETP, and GST-plec1PETA (see under “Experimental Procedures”). Three molar ratios of GST chimera to endophilin were tested as indicated. The immunoblots of unbound fractions obtained from separate acrylamide gels are shown, with endophilin revealed by anti Bif-antibody. GST/endophilin 0 refers to control sample performed in the absence of GST or chimera. D, depletion curves of the unbound fraction as determined from the experiment illustrated in C. Chemiluminescence signals are plotted as a percentage of the value determined for GST/endophilin 0 unbound fraction (equivalent to the input material). E, immunoblot analysis of material bound on beads and corresponding to samples analyzed in C, with GST/endophilin molar ratio of 103. F, specific coimmunoprecipitation of plectin and endoB2 from HeLa cells. Cells transfected with the indicated two endoB2 species (or mock-transfected) were processed as described under “Experimental Procedures.” Immunoblots of fractions P2 and S2 are shown (similar results were obtained in two independent experiments). In the upper panels, the arrow points at the faint band corresponding to endogenous endoB1 visible in fractions S2 of the control and comigrating with an endoB2 degradation product visible in the two endoB2 lanes, full-length (*) and truncated (**) endoB2 species. In lower panels showing material with molecular mass above 130 kilodaltons, intact plectin (°) and two of its major proteolytic degradation products (<) are distinguished. G, z-section obtained from HeLa/endoB2-St cells treated overnight with 5 mm sodium butyrate and processed for double immunofluorescence analysis using anti-StrepTag and anti-plectin antibodies. Arrowheads point to discrete colocalization of endoB2 and plectin around nuclei. Scale bar, 20 μm.
FIGURE 4.
FIGURE 4.
EndoB2 and plectin colocalize in the perinuclear region. HeLa cells were transfected to express endoB2 fused to a C-terminal Myc tag. Images are from two different z-sections obtained from cells processed for double immunofluorescence analysis using anti-Myc and anti-plectin antibodies. Plectin is localized all over the cell, with increased concentration at cell-to-cell contacts (top panels, arrowheads) and in filamentous structures surrounding the nucleus that partly colocalizes with endoB2 (arrows). The asterisks in the bottom panels are centered on a region above the nucleus that is immunoreactive for plectin and exhibits significant colocalization with endoB2. Scale bar, 30 μm.
FIGURE 5.
FIGURE 5.
Colocalization with vimentin requires the SH3 domain of endoB2. HeLa cells were transfected to express N-BAR/endoB2 fused to a C-terminal StrepTag. A, z-section obtained from cells processed for double immunofluorescence analysis using anti-StrepTag and anti-vimentin antibodies. Scale bar, 20 μm. B, electron microscopy of Epon-embedded cells. Left, mixture of filaments of 5–10 and 10–15 nm in diameter in the perinuclear region (inset, magnified regions delimited by the white box, note the homogeneity in electron density). Right, large bunches of filaments homogeneous in diameter (10–15 nm) and distant from the nucleus (inset, magnified region delimited by the white box illustrating homogeneity in diameter and electron density). Nuc, nucleus. Scale bars, 0.5 μm.
FIGURE 6.
FIGURE 6.
Mutagenesis of critical residues in the BAR sequence involved in membrane binding abrogate the assembly of endoB2 into perinuclear filamentous structures. A, rod structure of endoB2 showing the domain organization and the two mutations used in this study of the 173–178 amino acid loop (KARLKK) between α-helices 2 and 3. Based on the crystal structure of human endophilin BAR domain (Protein Data Bank code 1X03 A), this sequence is located at both tips of the dimer. B, HeLa cells were transfected to express, as indicated, wild type endoB2 or the mutants fused to a C-terminal Myc tag. Images show z-sections obtained from cells processed for immunofluorescence analysis using anti-Myc antibodies. For both mutants, not a single cell on the entire coverslips showed the typical formation of perinuclear filamentous structures as in the case of wild type endoB2. Scale bar, 20 μm. C, membrane binding of wild type (wt) and doubly mutated (KARLAA) species was examined using phospholipid to endophilin molar ratio ranging from 0 (input) to 2222 as indicated. 11.1% of the supernatant (unbound) and 33% of the pellet (bound) (see “Experimental Procedures”) were immunoblotted using separate polyacrylamide gels and anti-Bif antibody. No precipitation of endophilins was observed in the absence of membranes. D, chemiluminescence signals obtained from the blot shown in C and representative of two experiments. Plotted is the bound (B) to free (F, unbound) ratio as a function of the phospholipid to endophilin ratio.
FIGURE 7.
FIGURE 7.
Decrease of plec1 expression by siRNA interference impairs the tight association of endoB2 filamentous structures with nuclei. HeLa cells were treated with control (si control) or plec1 siRNAs (si plec1-1 and si plec1-2) for 72 h. A, Western blot analysis of plectin and tubulin expression from cell lysates (equal protein amounts loaded) migrated in duplicates. Intact plectin (°) and its two major proteolytic degradation products (<) are indicated as in Fig. 3. Right panel shows quantifications of immunoblots for plectin obtained from three independent experiments (each color corresponding to a given experiment). B, quantification of cells that contain endoB2 filaments (values are means ± S.D. calculated from three independent experiments with n = 257 (si control), 213 (si plec1-1), and 226 (si plec1-2) cells analyzed). C, z-sections obtained from cells treated with siRNAs, transfected after 48 h to express endoB2 fused to a C-terminal Myc tag and processed for Myc and plectin immunostaining. Images were taken with the same optical settings. Note, for both plec1 siRNAs and in comparison with control, the modification of the localization of endoB2 filamentous structures that do not remain exclusively perinuclear and expand in the cytoplasm is shown. Scale bar, 16 μm.
FIGURE 8.
FIGURE 8.
Decrease of plec1 expression by siRNA interference and incidence on the vimentin network. HeLa/endoB2-St cells were transfected with control or plec1-1 siRNAs for 72 h, as indicated. A, top left panel, z-sections obtained from cells processed for plectin immunostaining to attest for the presence of cells with significant decrease in plec1 expression (top left (si plec1-1), note the presence of cells that express plectin at a level approaching the detection limit (*)). Top right panel, quantification of cells treated with si plec1-1 that express plectin at the detection limit and exhibit bundling of vimentin filaments (n = 646 and 780 cells analyzed, respectively) and of cells treated with si control that exhibit bundling of vimentin filaments (n = 430 cells analyzed). Values are means ± S.D. calculated from three independent experiments. Bottom panel, images are from z-projections of five z-sections, each separated by a distance of 0.260 μm and obtained from cells processed for immunofluorescence using anti-vimentin antibodies. Note the perinuclear bundling of IF and the decrease in the density of vimentin filaments encaging nuclei clearly visible in cells treated with control siRNAs. Similar results were obtained with si plec1-2 siRNAs. Scale bars, 20 μm. B, z-sections obtained from HeLa cells stably expressing vim-GFP, treated with control or plec1-1 siRNAs as indicated, and processed for immunofluorescence using anti-plectin antibodies. Images were taken with the same optical settings. Note that cells treated with plec1-1 siRNAs and expressing plectin at low level are characterized by the bundling of vimentin filaments in the close vicinity of nuclei and across the cytoplasm. Results were similar with si plec1-2 siRNAs. Scale bar, 20 μm.
FIGURE 9.
FIGURE 9.
Decrease of endoB2 expression by siRNA interference and incidence on the vimentin network. HeLa/endoB2-St cells were transfected with control or endoB2 siRNAs (A, si endoB2-1 and si endoB2-2; B and C, si endoB2-2) for 72 h. A, Western blot analysis of endoB2 in cell lysates (top panel) or isolated after StrepTactin-Sepharose affinity chromatography (SA/seph eluate, bottom panel). In all experiments, endoB2 siRNAs allowed decreasing endoB2 expression by 75% at least in comparison with control. B, top and bottom panels correspond to two different fields. Images result from z-projections of five z-sections, each separated by a distance of 0.260 μm and obtained from cells processed for immunofluorescence using anti-vimentin antibodies. Note the mild bundling of vimentin filaments at the surface of nuclei accompanied by cytoplasmic extensions (arrowheads). Similar results were obtained with endoB2-1 siRNAs. Scale bar, 20 μm. C, top panel is a magnification of the region delimited in the top right image in B and shows the nuclear deformation imposed by the bundling of vimentin filaments. Increase in the indentation of nuclei was scored by the solidity index that measures the ratio between the surface of deformed nuclei divided by the theoretical surface whose contour is defined by the tips of indentations (see schematics). Right panel: n = 160 cells for si control and n = 153 cells for si endoB2-2.
FIGURE 10.
FIGURE 10.
Establishment of a tight perinuclear vimentin network requires plec1 and endoB2. A, HeLa/endoB2-St cells were transfected to express vim-GFP (10 h of expression). Cells were processed for immunofluorescence using anti-plectin antibodies. Images show two z-sections of the same cell, with top images obtained at a plane between the nucleus and the membrane contacting the coverslip and the bottom images obtained at a plane partly crossing the nucleus. Middle panels correspond to magnification of the areas delimited in the top panels and show plectin-enriched spots in contact with vimentin filaments (arrowheads). B, HeLa/endoB2-St cells were transfected with control, plec1 (si plec1-1 and si plec1-2) or endoB2 (si endoB2-1 and si endoB2-2) siRNAs for 72 h. They were subsequently transfected to express vim-GFP for 10 h. Top panels are z-sections showing four main different vim-GFP organization patterns exhibited by cells and defining categories, respectively, characterized as follows: category a, dispersion of small vimentin filamentous units; category b, localization of the vimentin network both in the perinuclear region and across the cytoplasm, with a concentrated spot nearby the nucleus; category c, organization of vimentin filaments as dense, tight cages around the nucleus; category d, dispersion of the meshwork across the entire cellular volume. Images of categories –c were obtained from cells treated with control siRNAs and of category d from cells treated with plec1-1 siRNAs (similar extensive dispersion of the network was also obtained for plec1-2 and endoB2-1 and endoB2-2 siRNAs). Bottom panels were obtained from numeration of cells belonging to each category, for both plec1 and endoB2 siRNAs. In the bottom left panel, n = 449, 476, and 221 counted cells for si control, si plec1-1, and si plec1-2, respectively. In the bottom right panel, n = 423, 451, and 435 counted cells for si control, si endoB2-1, and si endoB2-2, respectively. Similar results were obtained in independent experiments performed with regular HeLa cells in which the most significant effect was the major decrease in the proportion of cells characterized by the presence of tight vimentin cages (category c) for both plec1 and endoB2 siRNAs treatments and in comparison with the respective controls (12.8 and 15.1% of cells belonging to category c for si plec1-1 (n = 251 cells) and si plec1-2 (n = 239 cells), respectively, in comparison with 39.4% for the control (n = 323 cells); 9.7 and 10.1% of cells belonging to category c for si endoB2-1 (n = 277 cells) and si endoB2-2 (n = 289 cells), respectively, in comparison with 30.2% for the control (n = 215 cells)). Scale bars, 20 μm.
FIGURE 11.
FIGURE 11.
EndoB2 and plec1 control nuclear positioning. HeLa cells were transfected with control, plec1-1, or endoB2-2 siRNAs for 72 h, plated on micropatterns, and processed for tubulin immunostaining and DAPI staining. A, z-sections of cells from indicated siRNA treatments, immobilized on medium patterns, and showing the respective positions of nuclei. The schematic drawing shows distances d1 and d2 measured along the y axis of the pattern for scoring nuclei positioning (see “Experimental Procedures”). B, quantification and statistical analysis of nuclear positioning. n = 146, 163, and 192 cells analyzed for control, plec1-1, and endoB2-2 siRNAs, respectively, and pooled from two independent experiments. Horizontal lines and vertical bars indicate means ± S.D. p values are from Student's t test. *** indicates p values < 0.0001.

Similar articles

Cited by

References

    1. McMahon H. T., Gallop J. L. (2005) Membrane curvature and mechanisms of dynamic cell membrane remodeling. Nature 438, 590–596 - PubMed
    1. Itoh T., De Camilli P. (2006) BAR, F-BAR (EFC) and ENTH/ANTH domains in the regulation of membrane-cytosol interfaces and membrane curvature. Biochim. Biophys. Acta 1761, 897–912 - PubMed
    1. Zimmerberg J., Kozlov M. M. (2006) How proteins produce cellular membrane curvature. Nat. Rev. Mol. Cell Biol. 7, 9–19 - PubMed
    1. Mim C., Unger V. M. (2012) Membrane curvature and its generation by BAR proteins. Trends Biochem. Sci. 37, 526–533 - PMC - PubMed
    1. Masuda M., Mochizuki N. (2010) Structural characteristics of BAR domain superfamily to sculpt the membrane. Semin. Cell Dev. Biol. 21, 391–398 - PubMed

Publication types

LinkOut - more resources