

Structural basis of subtilase cytotoxin SubAB assembly
- PMID: 23921389
- PMCID: PMC3779744
- DOI: 10.1074/jbc.M113.462622
Structural basis of subtilase cytotoxin SubAB assembly
Abstract
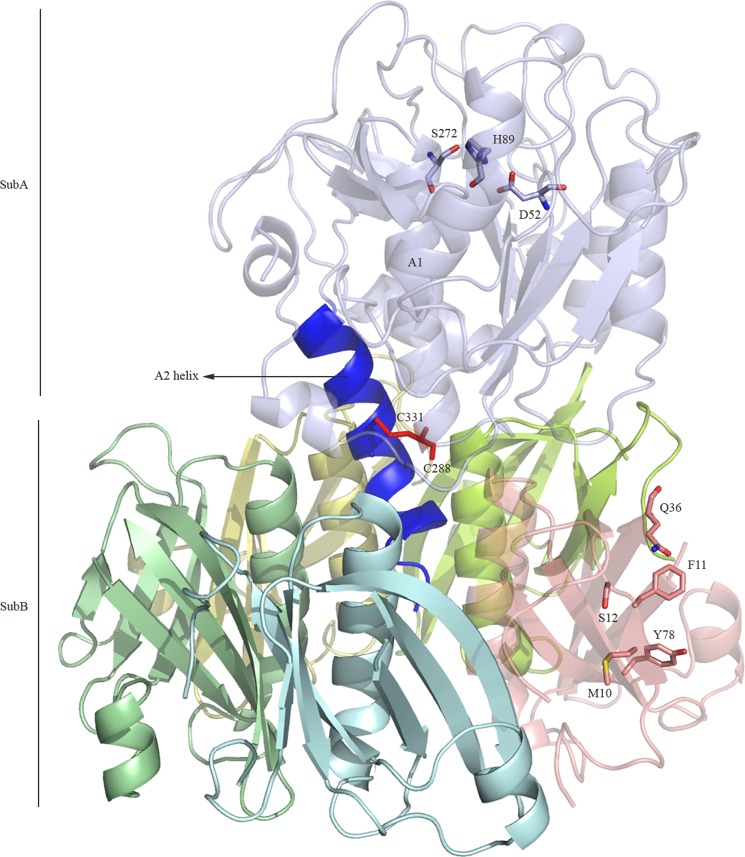
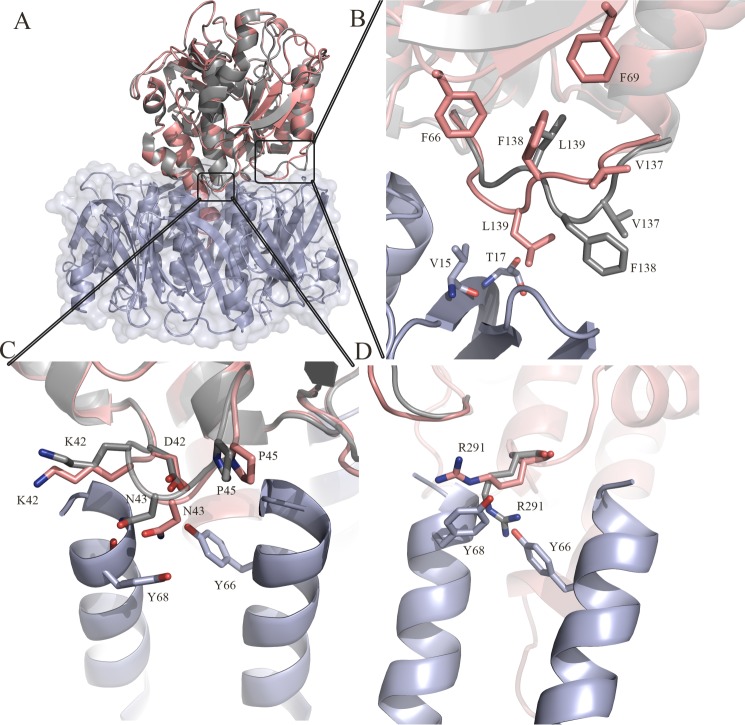
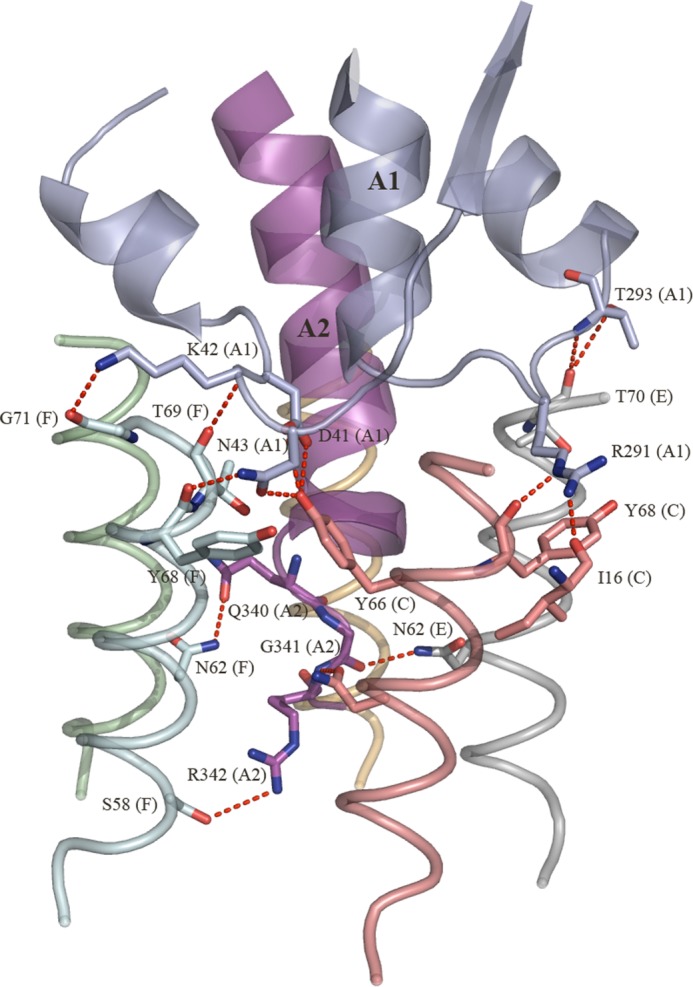
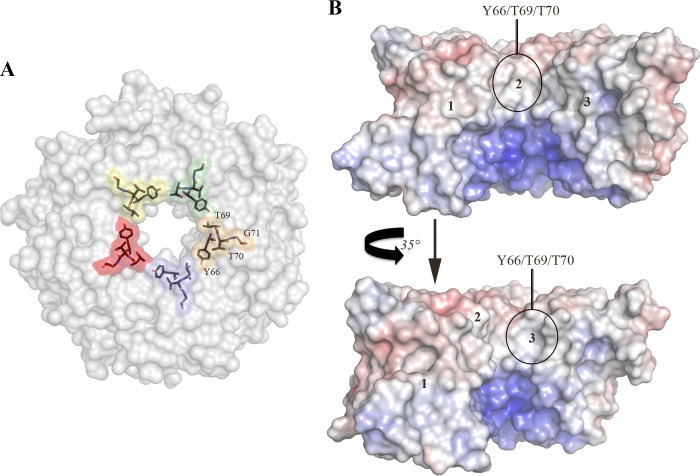
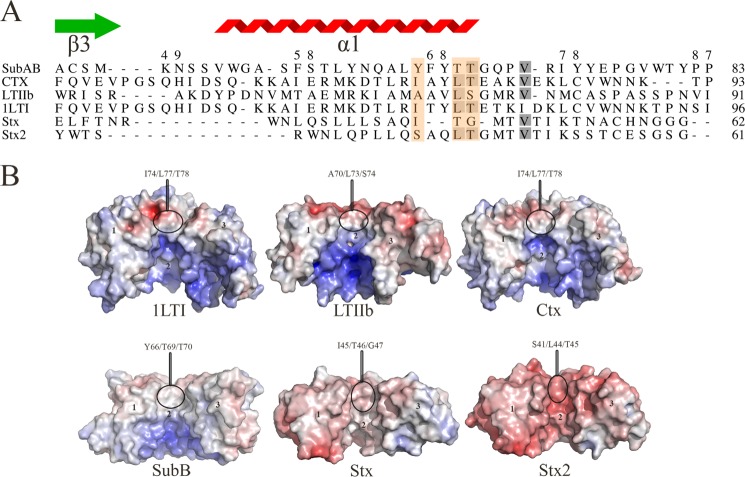
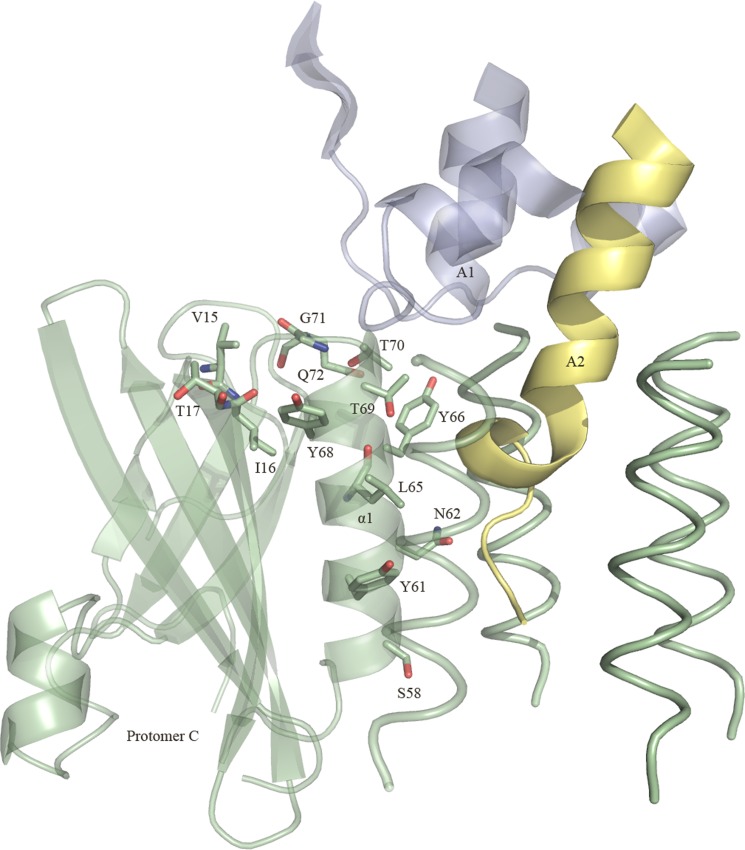
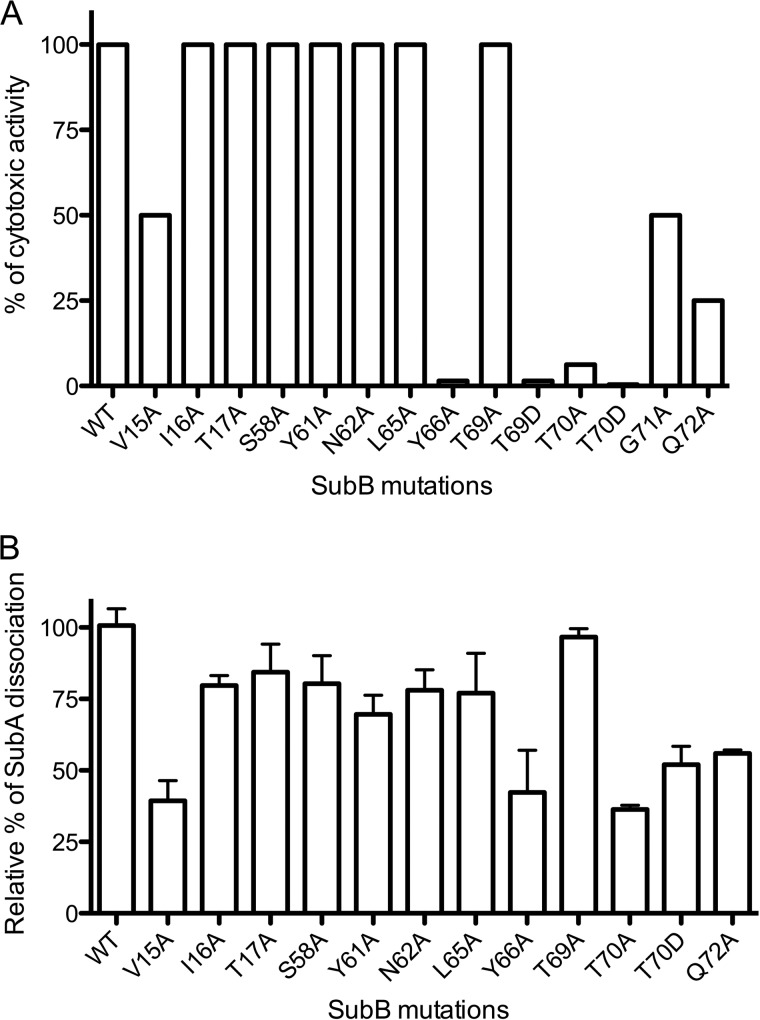
Pathogenic strains of Escherichia coli produce a number of toxins that belong to the AB5 toxin family, which comprise a catalytic A-subunit that induces cellular dysfunction and a B-pentamer that recognizes host glycans. Although the molecular actions of many of the individual subunits of AB5 toxins are well understood, how they self-associate and the effect of this association on cytotoxicity are poorly understood. Here we have solved the structure of the holo-SubAB toxin that, in contrast to other AB5 toxins whose molecular targets are located in the cytosol, cleaves the endoplasmic reticulum chaperone BiP. SubA interacts with SubB in a similar manner to other AB5 toxins via the A2 helix and a conserved disulfide bond that joins the A1 domain with the A2 helix. The structure revealed that the active site of SubA is not occluded by the B-pentamer, and the B-pentamer does not enhance or inhibit the activity of SubA. Structure-based sequence comparisons with other AB5 toxin family members, combined with extensive mutagenesis studies on SubB, show how the hydrophobic patch on top of the B-pentamer plays a dominant role in binding the A-subunit. The structure of SubAB and the accompanying functional characterization of various mutants of SubAB provide a framework for understanding the important role of the B-pentamer in the assembly and the intracellular trafficking of this AB5 toxin.
Keywords: AB5 Toxins; Carbohydrate-binding Protein; Cellular Trafficking; Disassembly/Assembly; Infectious Diseases; Intracellular Trafficking; Structural Biology; Toxins.
Figures
Similar articles
-
Novel Aspects of the SubA Subunit of the Subtilase Cytotoxin.Toxins (Basel). 2022 Feb 21;14(2):156. doi: 10.3390/toxins14020156. Toxins (Basel). 2022. PMID: 35202183 Free PMC article. Review.
-
Incorporation of a non-human glycan mediates human susceptibility to a bacterial toxin.Nature. 2008 Dec 4;456(7222):648-52. doi: 10.1038/nature07428. Epub 2008 Oct 29. Nature. 2008. PMID: 18971931 Free PMC article.
-
Host response to the subtilase cytotoxin produced by locus of enterocyte effacement-negative Shiga-toxigenic Escherichia coli.Microbiol Immunol. 2020 Oct;64(10):657-665. doi: 10.1111/1348-0421.12841. Epub 2020 Sep 29. Microbiol Immunol. 2020. PMID: 32902863 Review.
-
Involvement of protein disulfide isomerase in subtilase cytotoxin-induced cell death in HeLa cells.Biochem Biophys Res Commun. 2020 May 14;525(4):1068-1073. doi: 10.1016/j.bbrc.2020.03.008. Epub 2020 Mar 14. Biochem Biophys Res Commun. 2020. PMID: 32184018
-
The enzyme subunit SubA of Shiga toxin-producing E. coli strains demonstrates comparable intracellular transport and cytotoxic activity as the holotoxin SubAB in HeLa and HCT116 cells in vitro.Arch Toxicol. 2021 Mar;95(3):975-983. doi: 10.1007/s00204-020-02965-2. Epub 2021 Jan 23. Arch Toxicol. 2021. PMID: 33483759 Free PMC article.
Cited by
-
Heterogeneous Family of Cyclomodulins: Smart Weapons That Allow Bacteria to Hijack the Eukaryotic Cell Cycle and Promote Infections.Front Cell Infect Microbiol. 2017 May 23;7:208. doi: 10.3389/fcimb.2017.00208. eCollection 2017. Front Cell Infect Microbiol. 2017. PMID: 28589102 Free PMC article. Review.
-
Controlled Delivery of an Anti-Inflammatory Toxin to Macrophages by Mutagenesis and Nanoparticle Modification.Nanomaterials (Basel). 2022 Jun 23;12(13):2161. doi: 10.3390/nano12132161. Nanomaterials (Basel). 2022. PMID: 35807998 Free PMC article.
-
Variants of Escherichia coli Subtilase Cytotoxin Subunits Show Differences in Complex Formation In Vitro.Toxins (Basel). 2019 Dec 3;11(12):703. doi: 10.3390/toxins11120703. Toxins (Basel). 2019. PMID: 31816894 Free PMC article.
-
A Macroporous Magnesium Oxide-Templated Carbon Adsorbs Shiga Toxins and Type III Secretory Proteins in Enterohemorrhagic Escherichia coli, Which Attenuates Virulence.Front Microbiol. 2022 May 6;13:883689. doi: 10.3389/fmicb.2022.883689. eCollection 2022. Front Microbiol. 2022. PMID: 35602086 Free PMC article.
-
AB5 Preassembly Is Not Required for Shiga Toxin Activity.J Bacteriol. 2016 May 13;198(11):1621-1630. doi: 10.1128/JB.00918-15. Print 2016 Jun 1. J Bacteriol. 2016. PMID: 27002129 Free PMC article.
References
-
- Fan E., Merritt E. A., Verlinde C. L., Hol W. G. (2000) AB5 toxins: structures and inhibitor design. Curr. Opin. Struct. Biol. 10, 680–686 - PubMed
-
- Paton A. W., Beddoe T., Thorpe C. M., Whisstock J. C., Wilce M. C. J., Rossjohn J., Talbot U. M., Paton J. C. (2006) AB5 subtilase cytotoxin inactivates the endoplasmic reticulum chaperone BiP. Nature 443, 548–552 - PubMed
-
- Rao R. V., Ellerby H. M., Bredesen D. E. (2004) Coupling endoplasmic reticulum stress to the cell death program. Cell Death Differ. 11, 372–380 - PubMed
Publication types
MeSH terms
Substances
Associated data
- Actions
LinkOut - more resources
Full Text Sources
Other Literature Sources
