. 2013 Sep 27;288(39):27737-51.
doi: 10.1074/jbc.M113.492223. Epub 2013 Aug 6.

The solution structure of heparan sulfate differs from that of heparin: implications for function

Affiliations

The solution structure of heparan sulfate differs from that of heparin: implications for function

Sanaullah Khan et al. J Biol Chem. .

Abstract

The highly sulfated polysaccharides heparin and heparan sulfate (HS) play key roles in the regulation of physiological and pathophysiological processes. Despite its importance, no molecular structures of free HS have been reported up to now. By combining analytical ultracentrifugation, small angle x-ray scattering, and constrained scattering modeling recently used for heparin, we have analyzed the solution structures for eight purified HS fragments dp6-dp24 corresponding to the predominantly unsulfated GlcA-GlcNAc domains of heparan sulfate. Unlike heparin, the sedimentation coefficient s20,w of HS dp6-dp24 showed a small rotor speed dependence, where similar s20,w values of 0.82-1.26 S (absorbance optics) and 1.05-1.34 S (interference optics) were determined. The corresponding x-ray scattering measurements of HS dp6-dp24 gave radii of gyration RG values from 1.03 to 2.82 nm, cross-sectional radii of gyration RXS values from 0.31 to 0.65 nm, and maximum lengths L from 3.0 to 10.0 nm. These data showed that HS has a longer and more bent structure than heparin. Constrained scattering modeling starting from 5,000 to 12,000 conformationally randomized HS structures gave best fit dp6-dp24 molecular structures that were longer and more bent than their equivalents in heparin. Alternative fits were obtained for HS dp18 and dp24, indicating their higher bending and flexibility. We conclude that HS displays bent conformations that are significantly distinct from that for heparin. The difference is attributed to the different predominant monosaccharide sequence and reduced sulfation of HS, indicating that HS may interact differently with proteins compared with heparin.

Keywords: Analytical Ultracentrifugation; Heparan Sulfate; Heparin; Heparin-binding Protein; Molecular Modeling; X-ray Scattering.


Figures

FIGURE 1.
FIGURE 1.
Chemical structures of the two disaccharide repeats of HS and heparin. A, the major repeating disaccharide unit of HS (glucuronic acid → N-acetylglucosamine). The NH·CO·CH3 group in the second ring is replaced by NH·SO3 in 50% of this structure. The resulting molecular mass of this averaged disaccharide is 483 Da. B, the minor repeating unit of HS, which is the major repeating disaccharide unit in 90% of heparin (iduronic acid-2-sulfate → glucosamine-2,6-disulfate). For comparison with this study, heparin is considered to be 50% in the trisulfate form as shown and 50% in a disulfate form where a sulfate group is lost. The resulting molecular mass of this averaged disaccharide is 628 Da.
FIGURE 2.
FIGURE 2.
Purification profile of the HS fragments. The HS fragments were eluted with a flow rate of 0.2 ml/min using a Biogel P-10 column in 2% ammonium bicarbonate solution. Fractions of 2 ml/10 min were collected, and their HS concentrations were measured spectrophotometrically at 234 nm. The fractions taken for this study are shown by open circles. The inset shows 25% PAGE of the HS fragments dp6–dp24 (labeled as 6–24) with heparin dp24 (labeled as H) as marker. OD, optical density.
FIGURE 3.
FIGURE 3.
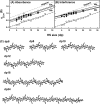
Sedimentation velocity size distribution analyses c(s) of six HS dp6–dp24 fragments. The absorbance and interference boundary scans were fitted using SEDFIT software for the HS fragments, each at 0.5 mg/ml. The mean s20,w and their standard deviations are reported in Table 1. A, the absorbance data using a wavelength of 234 nm and a rotor speed of 50,000 rpm gave s20,w peaks at 0.84 S for dp6, 0.95 S for dp8, 0.98 S for dp10, 1.08 S for dp12, 1.11 S for dp18, and 1.23 S for dp24. Beneath these panels, representative boundary fits are shown for dp6 and dp24, in which only every sixth scan of the 120 fitted boundaries are shown for clarity. B, the interference data using a rotor speed of 50,000 rpm gave s20,w peaks at 1.04 S for dp6, 1.12 S for dp8, 1.11 S for dp10, 1.19 S for dp12, 1.25 S for dp18, and 1.34 S for dp24. Beneath these panels, representative boundary fits are shown for every sixth scan of the 120 fitted boundaries for dp6 and dp24.
FIGURE 4.
FIGURE 4.
Comparison of the experimental and predicted sedimentation coefficients for eight HS dp6–dp24 fragments. The filled circles (●) and triangles (▴) represent the experimental values for dp6–dp24. The open circles (○) represent the predicted values for linear dp6-dp30 models. For comparison, the equivalent heparin experimental data from Ref. is shown as dotted lines in A and B. A, comparison with the experimental sedimentation coefficients at rotor speeds of 40,000 (▵), 50,000 (●), and 60,000 (▾) rpm using absorbance optics. B, comparison with the experimental sedimentation coefficients at rotor speeds of 40,000 (▵), 50,000 (●), and 60,000 (▾) rpm using interference optics. C, the linear models for HS dp6–dp24 that were created starting from the HS dp4 crystal structure (PDB code 3E7J) are shown.
FIGURE 5.
FIGURE 5.
Experimental Guinier x-ray scattering analyses of eight HS dp6–dp24 fragments. A, Guinier RG plots for dp6–dp24 at concentrations of 0.5 mg/ml. The filled circles were used to determine the radius of gyration RG, based on the best fit lines as shown. The Q ranges used for the RG analyses were 0.40–0.8 nm−1 for dp6, 0.42–0.78 nm−1 for dp8, 0.34–0.74 nm−1 for dp10, 0.30–0.66 nm−1 for dp12, 0.30–0.64 nm−1 for dp14, 0.29–0.55 nm−1 for dp16, 0.28–0.55 nm−1 for dp18, and 0.28–0.55 nm−1 for dp24. B, Guinier RXS plots for dp6–dp24. The filled circles represent the Q ranges used to determine the cross-sectional radius of gyration RXS, based on the best fit lines as shown. The Q ranges used for RXS analyses were 1.2–1.6 nm−1 for dp6, 1.1–1.6 nm−1 for dp8, 1.0–1.54 nm−1 for dp10, 1.0–1.44 nm−1 for dp12, 0.82–1.3 nm−1 for dp14, and 1.0–1.4 nm−1 for dp16, dp18, and dp24.
FIGURE 6.
FIGURE 6.
Experimental Guinier and P(r) x-ray data analyses of eight HS dp6–dp24 fragments. A, comparison of the experimental RG values from Guinier plots (▵) and P(r) curves (●) with the predicted RG values calculated from the linear models of Fig. 4 (○). The six corresponding values for heparin from Ref. are denoted by ♢ and ♦, respectively, and fitted to a dotted line. B, comparison of the experimental cross-sectional RXS values (●) with the predicted RXS values calculated from the linear models of Fig. 4 (○). The corresponding four values for heparin dp18–dp36 from Ref. are denoted by ♢ and fitted to a dotted line. C, the distance distribution function P(r) analyses for dp6–dp24. The r values of the maximum at M were 1.02 nm (dp6), 1.15 nm (dp8), 1.30 nm (dp10), 1.43 nm (dp12), 1.44 nm (dp14), 1.61 nm (dp16), 1.87 nm (dp18), and 1.90 nm (dp24). The eight fragments are denoted by continuous, dashed, and dotted lines in alternation. D, comparison of the P(r) analyses for HS dp6–dp24 with heparin dp6–dp24. The curves corresponding to the four HS fragments dp6, dp12, dp18, and dp24 are denoted by dashed lines, whereas the corresponding four curves for heparin are denoted by continuous lines. The heparin P(r) data are from Ref. .
FIGURE 7.
FIGURE 7.
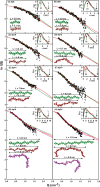
X-ray modeling curve fits for best fit and poor fit HS dp6–dp24 models. The main panels (A–H) depict the I(Q) curve fits, and the insets show the P(r) distance distribution function fits. The experimental I(Q) and P(r) scattering data are represented by black circles or lines, respectively; the red lines and models correspond to the best fit dp6–dp24 models from the trial and error searches; and the green lines and models correspond to the linear poor fit dp6–dp24 models from Fig. 4. The best fit and linear models are shown in the left lower corner, together with their maximum lengths L in nm for comparison with the experimental L values in the P(r) curves. For dp18 and dp24, the best fit model identified from only the minimum R factor value as filter is shown in purple.
FIGURE 8.
FIGURE 8.
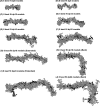
Superimposition of the eight best fit models for each of the eight HS dp6–dp24 fragments. Each set of eight best fit models for the eight HS fragments were superimposed globally using Discovery Studio VISUALISER software, and their non-hydrogen atoms are displayed as shown. Each best fit model from Fig. 7 is shown in black, whereas the seven related best fit structures are shown in gray. For dp18 and dp24, both the overall extended best fit structures (filtering on RG, RXS, and R factor values) and the bent best fit structures (filtering on R factor values only) are shown.
FIGURE 9.
FIGURE 9.
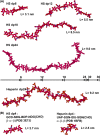
Comparison of the best fit HS dp6–dp24 structures with the equivalent heparin dp6–dp24 structures. Red, carbon and oxygen; blue, nitrogen; yellow, sulfur. A, four best fit HS models (dp6, dp12, dp18 (extended), and dp24 (extended)) are compared with the heparin dp24 model at the bottom all drawn to the same scale. The lengths of heparin dp6, dp12, dp18, and dp24 are indicated above the heparin dp24 structure for comparison with HS. B, the glycosidic linkages in the crystal structure of HS dp4 complexed with heparinase II (PDB code 3E7J) are compared with the crystal structure of the complex of heparin dp4 with fibroblast growth factor (PDB code 1BFB). The anomeric configurations of the glycosidic linkers are shown as α or β.

Similar articles

Cited by

References

    1. Gallagher J. T., Turnbull J. E., Lyon M. (1992) Heparan sulphate proteoglycans. Molecular organisation of membrane-associated species and an approach to polysaccharide sequence analysis. Adv. Exp. Med. Biol. 313, 49–57 - PubMed
    1. Bernfield M., Kokenyesi R., Kato M., Hinkes M. T., Spring J., Gallo R. L., Lose E. J. (1992) Biology of the syndecans. A family of transmembrane heparan sulfate proteoglycans. Annu. Rev. Cell Biol. 8, 365–393 - PubMed
    1. Conrad H. E. (1998) Heparin-binding Proteins, Academic Press, San Diego
    1. Sasisekharan R., Venkataraman G. (2000) Heparin and heparan sulfate. Biosynthesis, structure and function. Curr. Opin. Chem. Biol. 4, 626–631 - PubMed
    1. Perrimon N., Bernfield M. (2000) Specificities of heparan sulphate proteoglycans in developmental processes. Nature 404, 725–728 - PubMed

Publication types

LinkOut - more resources