. 2013 Aug 28;32(17):2348-61.
doi: 10.1038/emboj.2013.168. Epub 2013 Aug 6.

Mfn2 modulates the UPR and mitochondrial function via repression of PERK

Affiliations

Mfn2 modulates the UPR and mitochondrial function via repression of PERK

Juan Pablo Muñoz et al. EMBO J. .

Erratum in

  • EMBO J. 2014 Jan 13;33(2):171

Abstract

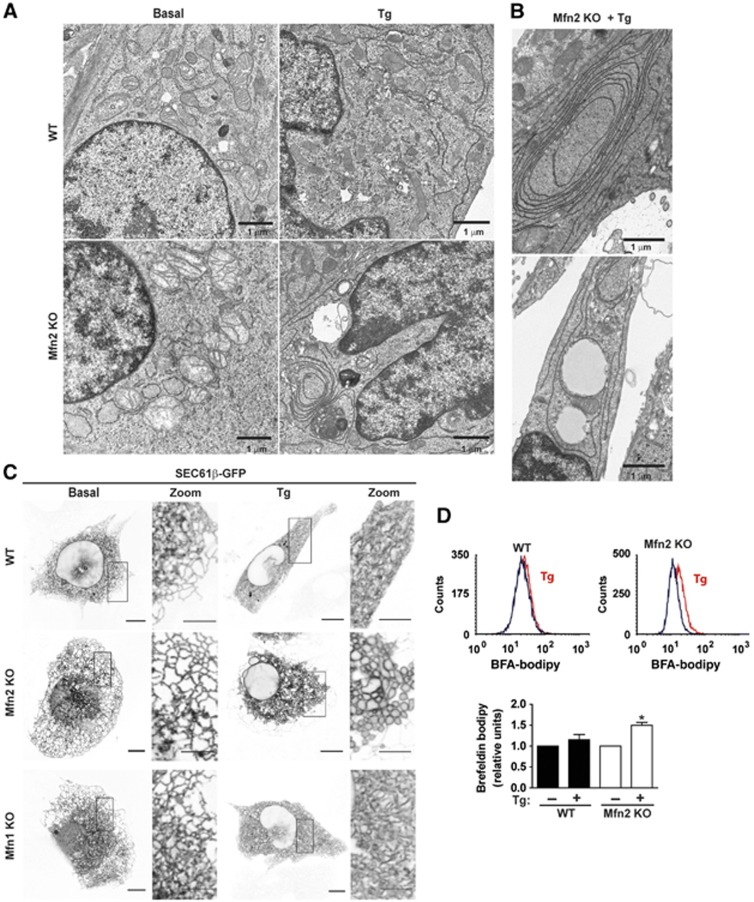
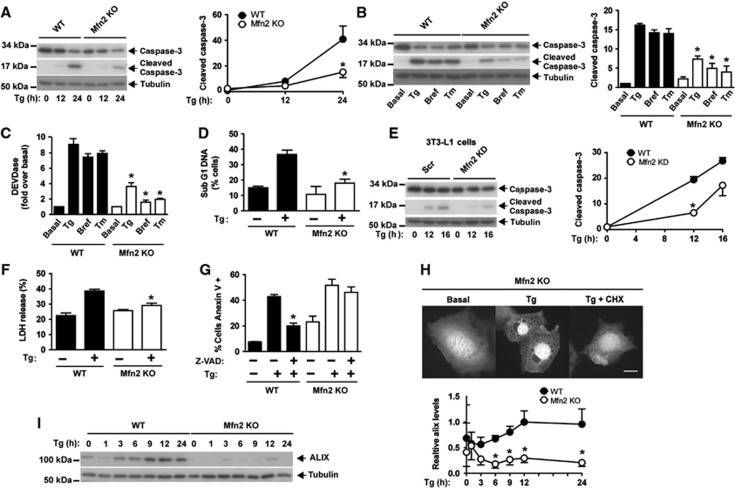
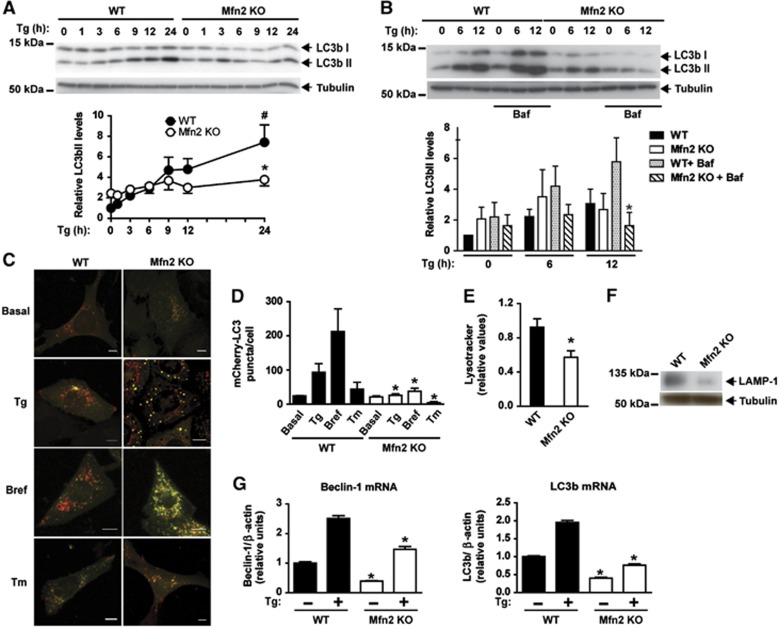
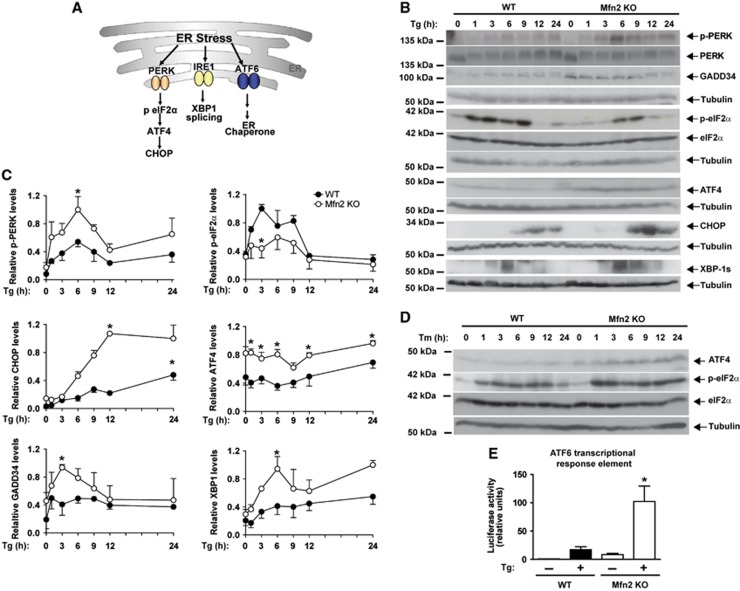
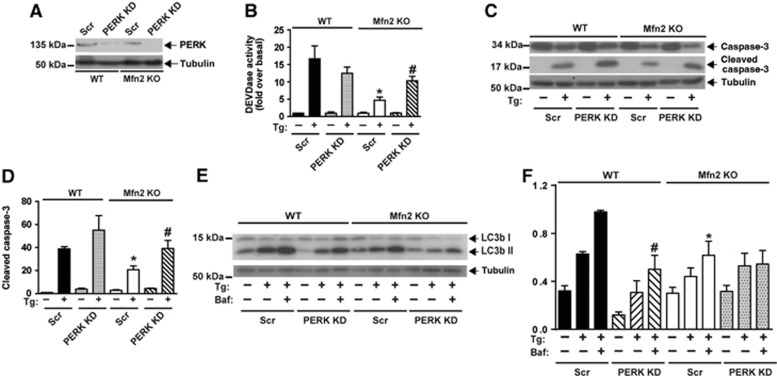
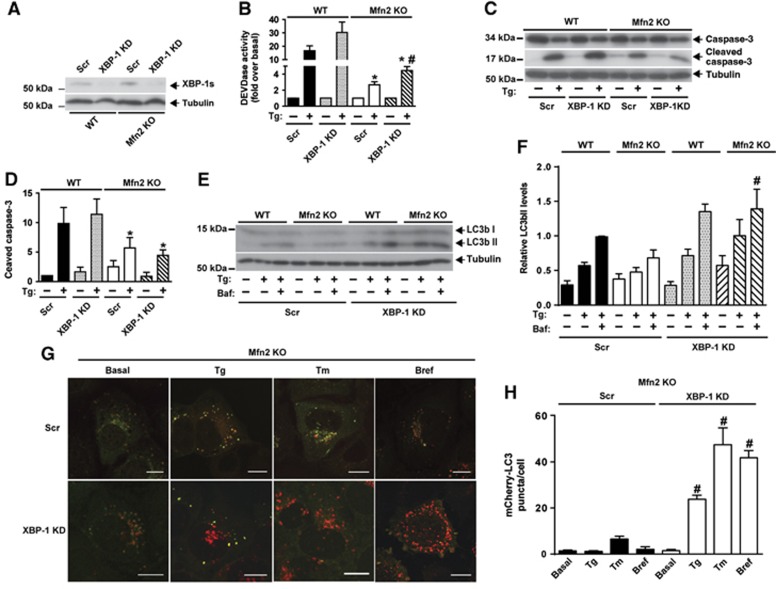
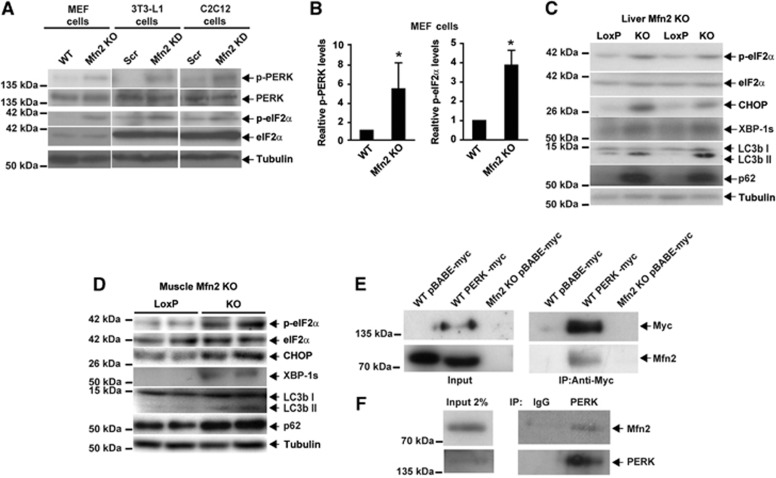
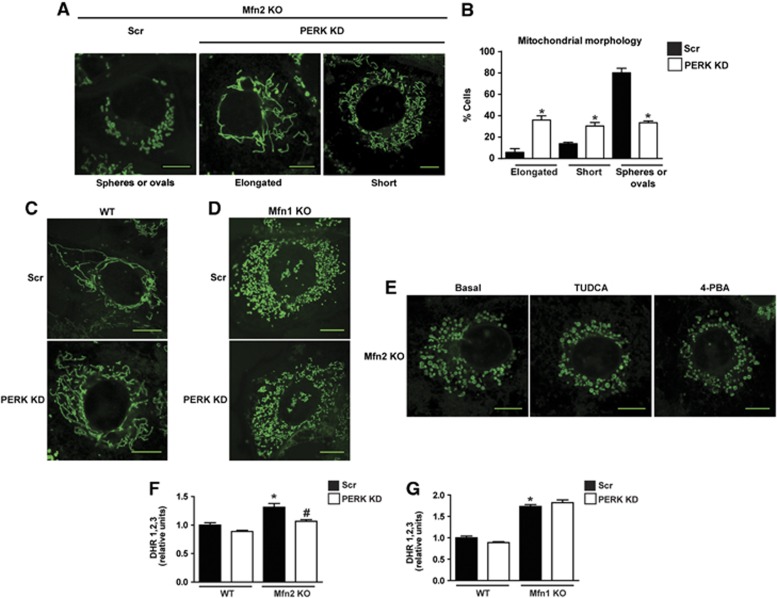
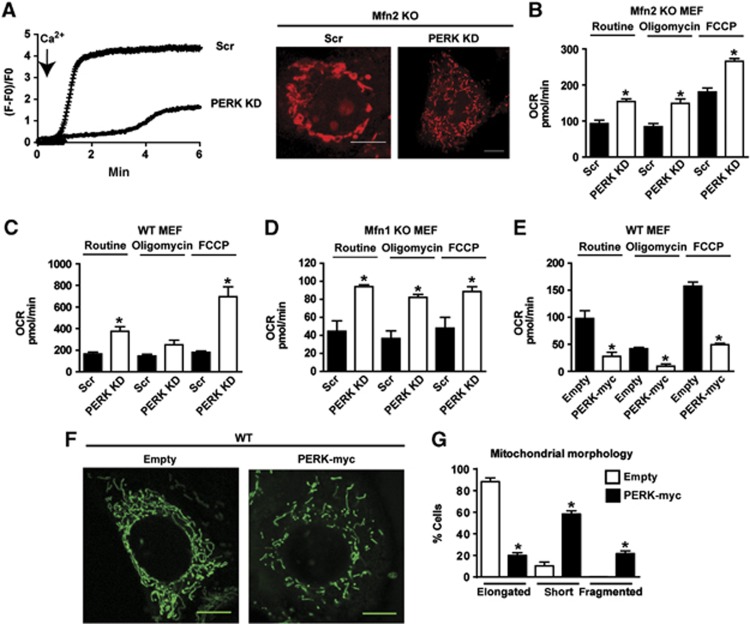
Mitofusin 2 (Mfn2) is a key protein in mitochondrial fusion and it participates in the bridging of mitochondria to the endoplasmic reticulum (ER). Recent data indicate that Mfn2 ablation leads to ER stress. Here we report on the mechanisms by which Mfn2 modulates cellular responses to ER stress. Induction of ER stress in Mfn2-deficient cells caused massive ER expansion and excessive activation of all three Unfolded Protein Response (UPR) branches (PERK, XBP-1, and ATF6). In spite of an enhanced UPR, these cells showed reduced activation of apoptosis and autophagy during ER stress. Silencing of PERK increased the apoptosis of Mfn2-ablated cells in response to ER stress. XBP-1 loss-of-function ameliorated autophagic activity of these cells upon ER stress. Mfn2 physically interacts with PERK, and Mfn2-ablated cells showed sustained activation of this protein kinase under basal conditions. Unexpectedly, PERK silencing in these cells reduced ROS production, normalized mitochondrial calcium, and improved mitochondrial morphology. In summary, our data indicate that Mfn2 is an upstream modulator of PERK. Furthermore, Mfn2 loss-of-function reveals that PERK is a key regulator of mitochondrial morphology and function.


Conflict of interest statement

The authors declare that they have no conflict of interest.

Figures

Figure 1
Figure 1
Mfn2 ablation promotes abnormal ER expansion during ER stress conditions. (A) WT or Mfn2 KO MEFs (Mfn2 KO cells) were treated with 1 μM Tg for 12 h and then processed for EM visualization of the ER morphology. Scale bar: 1 μm. (B) EM images of Tg-treated Mfn2 KO cells show accumulation of ER membrane stacking. Scale bar: 1 μm. (C) WT, Mfn2 KO or Mfn1 KO cells were transfected with the Sec61β-GFP plasmid and treated with 1 μM Tg for 24 h. Confocal microscopy images show ER vacuolization in Mfn2 KO cells treated with Tg. Scale bar: 10 μm. Insets show × 10 zoomed images. Scale bar: 5 μm. (D) WT and Mfn2 KO cells were treated with Tg 1 μM for 3 h and then incubated with brefeldin A-bodipy to stain ER and Golgi. Representative flow-cytometry histograms (upper panel). Mean fluorescence intensity was used to quantify ER expansion (n=5) (lower panel). Data are mean±s.e.m. *P<0.05 versus WT group.
Figure 2
Figure 2
Mfn2 ablation prevents caspase activation during ER stress and promotes paraptosis-like cell death. (A) WT and Mfn2 KO cells were treated with 1 μM Tg for 12 or 24 h. Total and cleaved caspase 3 levels were detected by western blot. Data are mean±s.e.m. (n=3). *P<0.05 versus WT group. (B, C) WT and Mfn2 KO cells were treated with 0.5 μg/ml tunicamycin (Tm), 100 ng/ml brefeldin A (Bref), or 1 μM Tg for 24 h. Total and cleaved caspase 3 levels were detected by western blot (B) and caspase activity (C) by measurement of DEVD-AFC substrate processing. Data are mean±s.e.m. (n=3). *P<0.05 versus WT group. (D) Flow-cytometry analysis of the Sub G1 DNA fragmentation in methanol-fixed WT and Mfn2 KO cells after incubation with or without 1 μM Tg for 24 h. Data are given as mean±s.e.m. (n=3). *P<0.05 versus WT group. (E) Scr (stably expressing scrambled shRNA) and Mfn2 knockdown (KD) (stably expressing shRNA directed against Mfn2) 3T3-L1 fibroblasts were incubated in the presence or absence of 1 μM Tg for 24 h. Total and cleaved caspase 3 were detected by western blot. Data are mean±s.e.m. (n=3). *P<0.05 versus WT group. (F) WT and Mfn2 KO cells were treated with 1 μM Tg for 24 h. Lactate dehydrogenase (LDH) release was analyzed by flow cytometry to assess necrotic cell death. Data are mean±s.e.m. (n=3). *P<0.05 versus WT group. (G) WT and Mfn2 KO cells were incubated for 24 h with or without 1 μM Tg in the presence or absence of z-VAD-fmk and stained for annexin V/PI. Data are mean±s.e.m. (n=4). *P<0.05 versus WT+Tg group. (H) Mfn2 KO cells transfected with the pEGFP plasmid were incubated with 1 μM Tg alone or in combination with 2 μM CHX for 24 h (3 h of pre-incubation with CHX). Florescence microscopy images show that CHX prevents cytoplasmic vacuolization. Scale bar: 10 μm. (I) WT (black circles) and Mfn2 KO cells (white circles) were incubated with 1 μM Tg for varying times, and ALIX protein was detected by western blot. Data are mean±s.e.m. (n=3). *P<0.05 versus WT group. Source data for this figure is available on the online supplementary information page.
Figure 3
Figure 3
Mfn2 loss-of-function decreases autophagy in response to ER stress. (A, upper panel) WT (black circles) or Mfn2 KO cells (white circles) were treated with 1 μM Tg for a range of times. (A, lower) Densitometric quantification. Data are mean±s.e.m. (n=3). *P<0.05 versus WT group; #P<0.05 versus WT non-Tg-treated group. (B, upper panel) WT or Mfn2 KO cells were treated with Tg for 0, 6 or 12 h, in the presence or absence of Bafilomycin (Baf, 100 nM). LC3b-I and LC3b-II expression was measured by western blot. (B, lower panel) Densitometric quantification of LC3b-II levels (relative to tubulin). Data are mean±s.e.m. (n=3). *P<0.05 versus WT+Baf+Tg group. (C) WT or Mfn2 KO cells stably expressing mCherry-GFP-LC3b were treated with 1 μM Tg, 100 ng/ml Brefeldin (Bref), or 0.5 μg/ml tunicamycin (Tm) for 24 h and examined by confocal microscopy. Scale bar: 10 μm. (D) Quantification of mCherry+/GFP- (mCherry-LC3) red puncta per cell (a measure of acidic autophagosomes) is shown. Data are mean±s.e.m. (n=3; 100 cells were analyzed per experiment and group). *P<0.05 versus WT group. (E) Acidic compartments of WT or Mfn2 KO cells were stained with Lysotracker Green and analyzed by flow cytometry. Data are given as mean±s.e.m. (n=3). *P<0.05 versus WT group. (F) LAMP1 expression was immunodetected in WT and Mfn2 KO cells in basal conditions. (G) Expression of Beclin-1 or LC3b transcripts in WT or Mfn2 KO cells treated with or without 1 μM Tg for 24 h. Data are mean±s.e.m. (n=3). *P<0.05 versus WT group. Source data for this figure is available on the online supplementary information page.
Figure 4
Figure 4
Mfn2 modulates the UPR response. (A) Scheme on UPR branches. (B) Immunodetection of p-PERK,PERK, GADD34, p-eIF2α, eIF2α, ATF4, CHOP, and XBP-1s in WT and Mfn2 KO cells treated with 1 μM Tg for the times indicated. (C) Densitometric quantifications. Data are mean±s.e.m. (n=3). *P<0.05 versus WT group. (D) Immunodetection of p-eIF2α, eIF2α, and ATF4 in WT and Mfn2 KO cells treated with 0.5 μg/ml Tunicamycin (Tm) for the times indicated. (E) Transcriptional activity driven by ATF6. WT and Mfn2 KO cells were co-transfected with the 5xATF6-GL3 and TK-Renilla plasmids and treated with 1 μM Tg for 24 h after transfection. Data are mean±s.e.m. (n=4). *P<0.05 versus WT group. Source data for this figure is available on the online supplementary information page.
Figure 5
Figure 5
PERK deficiency improves apoptosis during ER stress in Mfn2-ablated cells. (A) Immunodetection of PERK in WT and Mfn2 KO cells stably expressing a scrambled shRNA (Scr) or a shRNA directed against PERK (PERK KD). (B) Caspase activity was detected by measurement of DEVD-AFC substrate processing in WT or Mfn2 KO cells subjected to PERK silencing and treated with 1 μM Tg for 24 h. Data are mean±s.e.m. (n=3). *P<0.05 versus WT; #P<0.05 versus Scr group. (C, D) Total and cleaved caspase 3 levels were detected by western blot. Densitometric quantification is shown in D. Data are mean±s.e.m. (n=3). *P<0.05 versus WT; #P<0.05 versus Scr group. (E, F) Immunodetection of LC3b-I and -II in WT and Mfn2 KO cells subjected to PERK silencing and treated as indicated with Tg or Baf (1 μM Tg; 100 nM Baf) for 6 h. Densitometric quantification is shown in F. Data are mean±s.e.m. (n=3). *P<0.05 versus WT; #P<0.05 versus Scr group. Source data for this figure is available on the online supplementary information page.
Figure 6
Figure 6
XBP-1 loss-of-function enhances autophagy during ER stress in Mfn2-ablated cells. (A) Immunodetection of XBP-1s in WT and Mfn2 KO cells stably expressing a scrambled shRNA (Scr) or a shRNA directed to XBP-1 (XBP-1 KD), and treated with Tg for 6 h. (B) Caspase activity was detected by measurement of DEVD-AFC substrate processing. Data are mean±s.e.m. (n=3). *P<0.05 versus WT group. #P<0.05 versus Scr group. (C, D) Total and cleaved caspase 3 levels were detected by western blot. WT and Mfn2 KO cells subjected or not to XBP-1 silencing (Scr, and KD) and treated with 1 μM Tg for 24 h. Data are mean±s.e.m. (n=3). *P<0.05 versus WT group. (E, F) Immunodetection of LC3b-I and -II in Scr and XBP-1 KD WT or Mfn2 KO cells treated as indicated (1 μM Tg; 100 nM Baf) for 6 h. Densitometric quantification is shown in F. Data are mean±s.e.m. (n=3). #P<0.05 versus Scr group. (G) Mfn2 KO cells stably expressing mCherry-GFP-LC3b and subjected or not to XBP-1 silencing (Scr or KD) were treated with 1 μM Tg, 100 ng/ml Bref, or 0.5 μg/ml Tm for 24 h and examined by confocal microscopy. Scale bar: 10 μm. (H) Quantification of mCherry+/GFP- (mCherry-LC3) red puncta per cell (a measure of acidic autophagosomes) is shown. Data are mean±s.e.m. (n=3; 100 cells were analyzed per experiment and group). #P<0.05 versus Scr group. Source data for this figure is available on the online supplementary information page.
Figure 7
Figure 7
Mfn2 regulates PERK activity. (A) Immunodetection of p-PERK and p-eIF2α in Mfn2 KO MEFs, Mfn2 knockdown 3T3-L1 fibroblasts, and Mfn2 knockdown C2C12 myoblasts. (B) Densitometric quantification of p-PERK and p-eIF2α in MEFs. Data are mean±s.e.m. (n=3). *P<0.05 versus WT cells. (C, D) Immunodetection of p-eIF2α, eIF2α, CHOP, XBP-1s, LC3b, and p62 in Mfn2-deficient liver (C) or skeletal muscle (D) from tissue-specific KO mice. (E) Co-immunoprecipitation of Mfn2 and PERK in WT or Mfn2 KO cells stably expressing PERK-myc or an empty vector (pBABE-myc; negative control). (F) Co-immunoprecipitation of endogenous Mfn2 and PERK in WT MEF lysates. PERK was immunoprecipitated with a C-terminal antibody and co-immunoprecipitation of Mfn2 was detected by western blot. Source data for this figure is available on the online supplementary information page.
Figure 8
Figure 8
PERK knockdown rescues mitochondrial morphology and excessive ROS production in Mfn2 KO cells. (A) Representative confocal images of mitochondrial morphology in scrambled (Scr) and PERK KD Mfn2 KO cells stained with MitoTracker Green. (B) Mitochondrial morphology quantification. Data are mean±s.e.m. (n=3; 100 cells were analyzed per experiment and group). *P<0.05 versus Scr group. (C, D) Representative confocal images of mitochondrial morphology in scrambled (Scr) and PERK KD WT cells (C) or scrambled (Scr) and PERK KD Mfn1 KO cells (D) stained with MitoTracker Green. (E) Representative confocal images of mitochondrial morphology in Mfn2 KO cells treated with 1 μM TUDCA or 10 mM 4-phenyl butyric acid for 6 h and stained with MitoTracker Green. (F) Flow-cytometry quantification of ROS levels in Scr and PERK KD WT and Mfn2 KO cells (G) or Scr and PERK KD WT and Mfn1 cells using DHR1,2,3. Data are mean±s.e.m. (n=4). *P<0.05 versus WT group, #P<0.05 versus Scr group. Scale bars: 10 μm.
Figure 9
Figure 9
PERK knockdown normalizes mitochondrial Ca2+ overload and mitochondrial respiration. (A) Mitochondrial calcium overload in Scr and PERK KD Mfn2 KO cells. Cells were loaded with Rhod-2 and then treated with 2.5 mM CaCl2 (left). Calcium uptake was monitored by confocal microscopy. Representative confocal images of mitochondrial morphology in WT and Mfn2 KO cells stained with Rhod-2 and incubated with 2.5 mM CaCl2 for 5 min (right). Scale bars: 10 μm. (BE) Mitochondrial oxygen consumption (OCR) was measured in Scr and PERK KD Mfn2 KO cells (B), Scr and PERK KD WT cells (C), Scr and PERK KD Mfn1 KO cells (D), and WT cells stably expressing PERK-myc (E). Data are mean of three independent experiments. The following parameters were measured: oxygen consumption under routine conditions (DMEM with 5.5 mM glucose), maximal respiratory capacity reached after uncoupling with FCCP, and respiratory leak, measured after inhibition of ATP synthase with oligomycin. Data are mean±s.e.m. *P<0.05 versus Scr group or versus the empty plasmid group. (F, G) Representative confocal images of mitochondrial morphology in WT cells stably expressing PERK-myc stained with MitoTracker Green. Scale bars: 10 μm. Quantitative analysis of mitochondrial morphology is shown in G. Data are mean±s.e.m. (n=3). *P<0.05 versus the empty plasmid group.

Comment in

References

    1. Bach D, Pich S, Soriano FX, Vega N, Baumgartner B, Oriola J, Daugaard JR, Lloberas J, Camps M, Zierath JR, Rabasa-Lhoret R, Wallberg-Henriksson H, Laville M, Palacin M, Vidal H, Rivera F, Brand M, Zorzano A (2003) Mitofusin-2 determines mitochondrial network architecture and mitochondrial metabolism. A novel regulatory mechanism altered in obesity. J Biol Chem 278: 17190–17197 - PubMed
    1. Bravo R, Vicencio JM, Parra V, Troncoso R, Munoz JP, Bui M, Quiroga C, Rodriguez AE, Verdejo HE, Ferreira J, Iglewski M, Chiong M, Simmen T, Zorzano A, Hill JA, Rothermel BA, Szabadkai G, Lavandero S (2011) Increased ER-mitochondrial coupling promotes mitochondrial respiration and bioenergetics during early phases of ER stress. J Cell Sci 124: 2143–2152 - PMC - PubMed
    1. Brooks C, Wei Q, Feng L, Dong G, Tao Y, Mei L, Xie ZJ, Dong Z (2007) Bak regulates mitochondrial morphology and pathology during apoptosis by interacting with mitofusins. Proc Natl Acad Sci USA 104: 11649–11654 - PMC - PubMed
    1. Chami M, Oules B, Szabadkai G, Tacine R, Rizzuto R, Paterlini-Brechot P (2008) Role of SERCA1 truncated isoform in the proapoptotic calcium transfer from ER to mitochondria during ER stress. Mol Cell 32: 641–651 - PMC - PubMed
    1. Chen H, Chomyn A, Chan DC (2005) Disruption of fusion results in mitochondrial heterogeneity and dysfunction. J Biol Chem 280: 26185–26192 - PubMed

Publication types

MeSH terms