. 2013 Oct;41(18):e170.
doi: 10.1093/nar/gkt660. Epub 2013 Aug 5.

Quantitative set analysis for gene expression: a method to quantify gene set differential expression including gene-gene correlations

Affiliations

Quantitative set analysis for gene expression: a method to quantify gene set differential expression including gene-gene correlations

Gur Yaari et al. Nucleic Acids Res. 2013 Oct.

Abstract

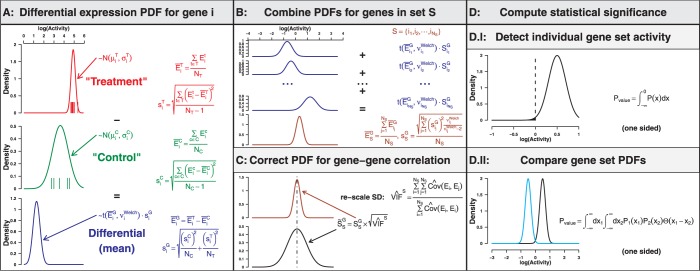
Enrichment analysis of gene sets is a popular approach that provides a functional interpretation of genome-wide expression data. Existing tests are affected by inter-gene correlations, resulting in a high Type I error. The most widely used test, Gene Set Enrichment Analysis, relies on computationally intensive permutations of sample labels to generate a null distribution that preserves gene-gene correlations. A more recent approach, CAMERA, attempts to correct for these correlations by estimating a variance inflation factor directly from the data. Although these methods generate P-values for detecting gene set activity, they are unable to produce confidence intervals or allow for post hoc comparisons. We have developed a new computational framework for Quantitative Set Analysis of Gene Expression (QuSAGE). QuSAGE accounts for inter-gene correlations, improves the estimation of the variance inflation factor and, rather than evaluating the deviation from a null hypothesis with a P-value, it quantifies gene-set activity with a complete probability density function. From this probability density function, P-values and confidence intervals can be extracted and post hoc analysis can be carried out while maintaining statistical traceability. Compared with Gene Set Enrichment Analysis and CAMERA, QuSAGE exhibits better sensitivity and specificity on real data profiling the response to interferon therapy (in chronic Hepatitis C virus patients) and Influenza A virus infection. QuSAGE is available as an R package, which includes the core functions for the method as well as functions to plot and visualize the results.


Figures

Figure 1.
Figure 1.
Overview of the steps to carry out QuSAGE.
Figure 2.
Figure 2.
The impact of unequal gene expression variance across groups. (A) The standard deviation of individual gene expression values (points) was calculated using data from pre-therapy PBMC samples in a study of chronic HCV infection (18). Samples were divided into two groups depending on the clinical response to therapy, and separate standard deviations were calculated for each group. Equality is indicated by the dashed line. (B) ROC curves based on stochastic simulations (see text) for testing the difference between two groups using Welch’s approximation (black line) or the pooled variance approach (red line). The parameters for the stochastic simulations were based on the empirical data [indicated by a white x in (A)]. The X and 0 indicate the values for which formula image.
Figure 3.
Figure 3.
Comparison of methods to account for gene–gene correlations within a set. Gene expression data from a single homogenous group of samples [pre-therapy PBMC samples of poor responders from (18)] were randomly divided into two groups. (A) VIFs were calculated for 186 KEGG pathway gene sets (points) and the ISG gene set (white x) using CAMERA and QuSAGE. The ratio between these VIF estimates is plotted against the coefficient of variation of the standard deviations for individual genes in each set. (B) The random division of samples into two groups was repeated for 10 000 iterations and P-values were calculated for the activity of the ISG gene set. Gene–gene correlations were either (B) ignored (VIF = 1), (C) corrected using CAMERA or (D) corrected using QuSAGE. Type I errors for formula image 
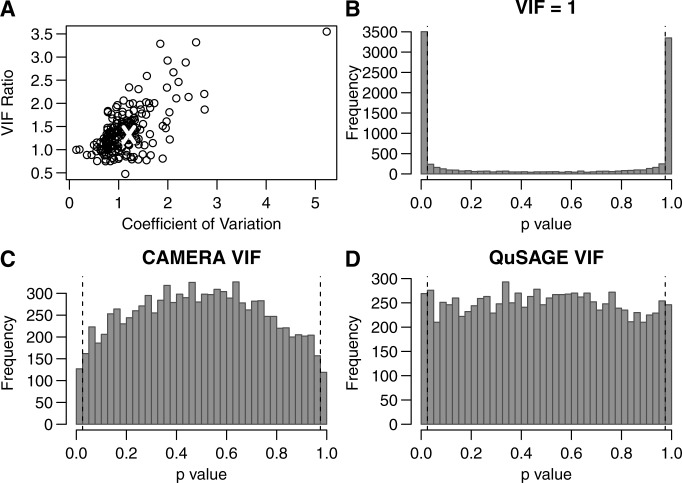
(indicated by the fraction of the distribution outside the vertical dashes lines) were (B) 0.685, (C) 0.02 and (D) 0.052.
Figure 4.
Figure 4.
QuSAGE VIF estimation effectively controls the Type I error. (A) P-values were calculated for the activity of each pathway in the KEGG database (24) using the same data and approach as Figure 3B–D. Gene–gene correlations were either ignored (formula image
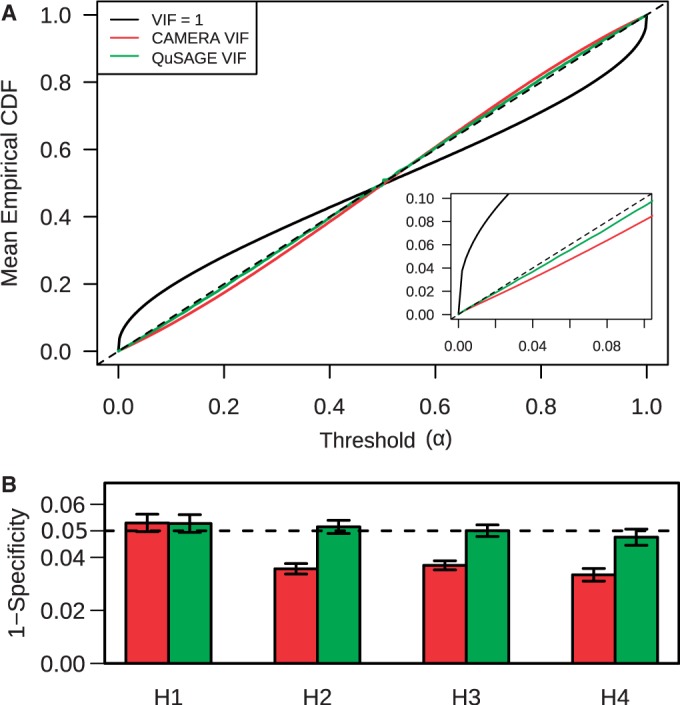
) (black line), corrected for using CAMERA (red line) or corrected using QuSAGE (green line). The empirical cumulative distribution function (CDF) was calculated as the fraction of pathways with P-values below the indicated α threshold, with the dashed line indicating the specificity of an ideal test. The inset shows a closer look at the vicinity of 0. (B) The same procedure was repeated using four independent data sets containing healthy individuals [H1-4 that correspond to (25–28)]. The mean (±standard error) empirical CDF at formula image is plotted using VIF corrections from CAMERA (red) and QuSAGE (green).
Figure 5.
Figure 5.
Visualization methods in QuSAGE. (A) The ISG response in HCV patients to IFN therapy is compared in both clinical responders (upper panel) and non-responders (lower panel). Differential expression PDFs (comparing post- and pre-therapy time-points) are shown for individual genes (thin curves color-coded by standard deviation), along with the aggregated estimate for the ISG pathway after taking into account gene–gene correlation (thick black curve). The mean differential expression for individual genes in the set are indicated as line barcodes between the two panels. (B) Summary of gene set activity (post- versus pre-therapy) among clinical responders for the 186 pathway gene sets in KEGG. For each pathway, the mean and 95% confidence interval are plotted and color-coded according to their False discovery rate (FDR)-corrected P-values when compared to zero. (C) Mean and 95% confidence interval for differential expression of individual genes in the KEGG JAK STAT SIGNALING pathway are shown for clinical responders (blue line and gray band) and non-responders (points and bars color-coded by FDR-corrected P-values for comparison with zero). Horizontal dashed lines indicate the mean differential expression for responders (blue) and non-responders (red). In all plots (A, B, C), data are taken from (17) (see MATERIALS AND METHODS section for details). R code to produce these plots is part of QuSAGE and includes options allowing many of the features to be customized.
Figure 6.
Figure 6.
QuSAGE reveals significantly stronger activation of the IFN pathway in HCV therapy responders. ISG set differential expression was calculated for clinical responders (solid lines) and non-responders (dashed lines) by comparing gene expression measurements from matched post- and pre-treatment samples. Studies 1, 2 and 3 refer to (17–19), respectively. The activity PDFs for responders and non-responders were compared: Asterisk indicates formula image
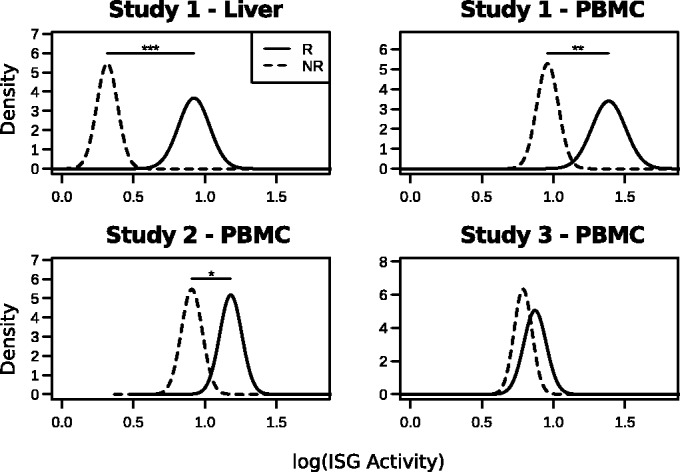
, double asterisk indicates formula image and triple asterisk indicates formula image.
Figure 7.
Figure 7.
QuSAGE detects earlier and more significant ISG activity in symptomatic (versus asymptomatic) human subjects following influenza exposure. ISG activity was quantified at each time point using (A) QuSAGE and (B) GSEA. Color-coding indicates the P-values for detecting activity in asymptomatic (circles) and symptomatic (squares) subjects relative to pre-exposure levels. (C) ISG activity was compared directly between the asymptomatic and symptomatic subject groups using QuSAGE, GSEA and CAMERA. Color-coding indicates the P-values using the same color key as panels (A) and (B). QuSAGE and CAMERA both estimate the average activity using the same statistic, although the P-values can differ.

References

    1. Mootha VK, Lindgren CM, Eriksson KF, Subramanian A, Sihag S, Lehar J, Puigserver P, Carlsson E, Ridderstärle M, Laurila E, et al. PGC-1alpha-responsive genes involved in oxidative phosphorylation are coordinately downregulated in human diabetes. Nat. Genet. 2003;34:267–273. - PubMed
    1. Abatangelo L, Maglietta R, Distaso A, D’Addabbo A, Creanza TM, Mukherjee S, Ancona N. Comparative study of gene set enrichment methods. BMC Bioinformatics. 2009;10:275. - PMC - PubMed
    1. Greenblum S, Efroni S, Schaefer C, Buetow K. The PathOlogist: an automated tool for pathway-centric analysis. BMC Bioinformatics. 2011;12:133. - PMC - PubMed
    1. Wu MC, Lin X. Prior biological knowledge-based approaches for the analysis of genome-wide expression profiles using gene sets and pathways. Stat. Methods Med. Res. 2009;18:577–593. - PMC - PubMed
    1. Liberzon A, Subramanian A, Pinchback R, Thorvaldsdottir H, Tamayo P, Mesirov JP. Molecular signatures database (MSigDB) 3.0. Bioinformatics. 2011;27:1739–1740. - PMC - PubMed

Publication types