. 2013 Sep;41(17):e169.
doi: 10.1093/nar/gkt612. Epub 2013 Aug 5.

Detecting Alu insertions from high-throughput sequencing data

Affiliations

Detecting Alu insertions from high-throughput sequencing data

Matei David et al. Nucleic Acids Res. 2013 Sep.

Abstract

High-throughput sequencing technologies have allowed for the cataloguing of variation in personal human genomes. In this manuscript, we present alu-detect, a tool that combines read-pair and split-read information to detect novel Alus and their precise breakpoints directly from either whole-genome or whole-exome sequencing data while also identifying insertions directly in the vicinity of existing Alus. To set the parameters of our method, we use simulation of a faux reference, which allows us to compute the precision and recall of various parameter settings using real sequencing data. Applying our method to 100 bp paired Illumina data from seven individuals, including two trios, we detected on average 1519 novel Alus per sample. Based on the faux-reference simulation, we estimate that our method has 97% precision and 85% recall. We identify 808 novel Alus not previously described in other studies. We also demonstrate the use of alu-detect to study the local sequence and global location preferences for novel Alu insertions.


Figures

Figure 1.
Figure 1.
Detecting Alu insertions and TSDs. (A) Genome after an Alu insertion on the positive strand. The human reference genome is at the bottom. The newly sequenced ‘donor’ genome with an Alu insertion and a TSD is above. Above is the terminology. ‘Head’ and ‘tail’ refer to the inner sequence of the Alu, whereas ‘left’, ‘right’, ‘insertion start’ and ‘insertion end’ refer to the orientation of the genome. If the Alu were on the negative strand, the terms in italic would be flipped. (B) Detection of Alu insertions. The donor genome is shown aligned to the reference genome. Because of the TSD, the left end of an Alu will start at the right end of the TSD. Two read pairs supporting the insertion are shown. Read pair X has a split-mapped read aligned across the 5′ (left) end of the Alu (GGCC), and the right end of the TSD, directly identifying the breakpoint. Read pair Y supports the presence of an insertion, but does not identify the exact breakpoint (other end of the TSD). As only the left endpoint is detected (between G/A), the right end of the confidence interval is the A following the breakpoint, whereas the left is only estimated. The detected breakpoint is represented by a square bracket, and the undetected one by a round bracket.
Figure 2.
Figure 2.
(A–D) Illustration of the Confidence Intervals. The text line shows the chromosome, the confidence interval start, end, the strand of the insertion, the number of reads spanning the left endpoint/start of the insertion, the number of reads spanning the right endpoint/end of the insertion and the reported TSD length. The diagrams show the reference on top and the inferred donor genome on bottom. Arrows denote the reads supporting the breakpoints. A bracket denotes a confidence interval end next to which a breakpoint was detected. A paranthesis denotes an end, which is only an estimation. (A) Standard call with two breakpoints and TSD. (B) Non-standard call with two breakpoints, showing a target site loss. (C) Call with only the left endpoint detected. Assuming the insertion has the standard form, the TSD starts somewhere upstream of the breakpoint in the reference (the uncertainty is represented by the dotted line). The region marked with the ‘?’ is the second copy of the TSD; its starting sequence is not known. (D) Similar to C, but insertion with only the right endpoint detected. (E) Alu Calls and Genome Features. The reference and a genomic feature (exon) are shown, together with the confidence intervals for two Alu insertion calls. Each Alu’s left breakpoint is detected, whereas the right is estimated. Only the left call is guaranteed to duplicate part of the genome feature. For the right call, this depends on the undetected right end of the insertion (TSD length).
Figure 3.
Figure 3.
Top: Relative Precision (formula image
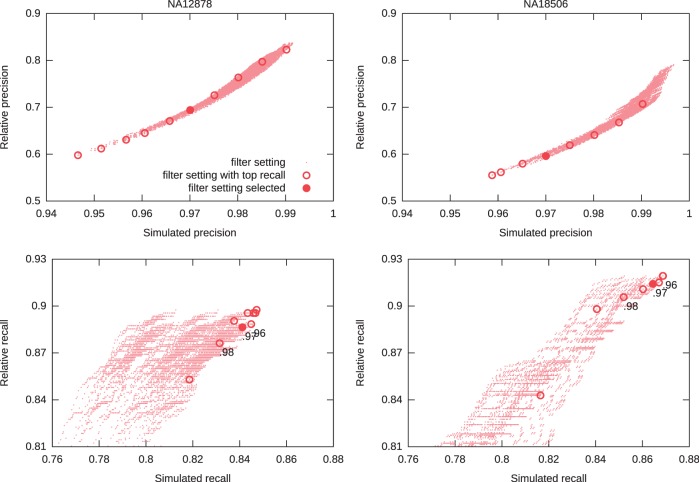
) versus Simulated Precision (formula image). Bottom: Relative Recall (formula image) versus Simulated Recall (formula image). Each dot represents a filter setting. We highlight, for x between 0.920 and 0.990 in steps of 0.005, the filter with formula image and maximum simulated recall formula image. NA12878 is an individual of European ancestry, whereas NA18506 is an individual of Yoruban ancestry.
Figure 4.
Figure 4.
Alu insertions next to a reference Alu. We show the relevant regions around a reference Alu, along with two novel Alu insertions with their reference mappings. Novel Alu one is inserted on the positive strand of the head region of the reference Alu, and novel Alu two is inserted on the negative strand of the tail region of the reference Alu.
Figure 5.
Figure 5.
Alu calls on the Yoruban trio. Columns, in order: NA18506 (son), NA18507 (father), NA18508 (mother). Top: Number of calls versus relative precision achieved by alu-detect. For x ranging from 0.920 to 0.990 in steps of 0.005, we show the filter parameters that achieve simulated precision at least x and maximizes simulated recall (formula image is highlighted). We also show data points corresponding to the results of (6) and (7). Bottom: Intersections of calls on each sample between studies (area-proportional). Next to the study identifier: calls made and relative precision (fraction of the calls also present in dbRIP or Stewart et al.). The numbers in the diagram do not always add up because interval intersection is non-transitive.

References

    1. Dalca AV, Brudno M. Genome variation discovery with high-throughput sequencing data. Brief. Bioinformatics. 2010;11:3–14. - PubMed
    1. Nielsen R, Paul J, Albrechtsen A, Song Y. Genotype and snp calling from nex t-generation sequencing data. Nat. Rev. Genet. 2011;12:443–451. - PMC - PubMed
    1. Alkan C, Coe B, Eichler E. Genome structural variation discovery and genotyping. Nat. Rev. Genet. 2011;12:363–376. - PMC - PubMed
    1. Medvedev P, Stanciu M, Brudno M. Computational methods for discovering structural variation with next-generation sequencing. Nat. Methods. 2009;6(11 Suppl.):S13–S20. - PubMed
    1. Ewing AD, Kazazian HH. Whole-genome resequencing allows detection of many rare line-1 insertion alleles in humans. Genome Res. 2011;21:985–990. - PMC - PubMed

Publication types