. 2013 Oct;41(19):8908-25.
doi: 10.1093/nar/gkt669. Epub 2013 Aug 5.

Chromatin loop organization of the junb locus in mouse dendritic cells

Affiliations

Chromatin loop organization of the junb locus in mouse dendritic cells

Tamara Salem et al. Nucleic Acids Res. 2013 Oct.

Abstract

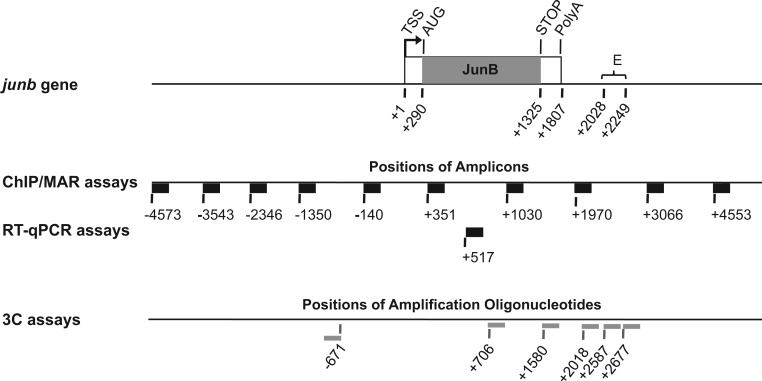
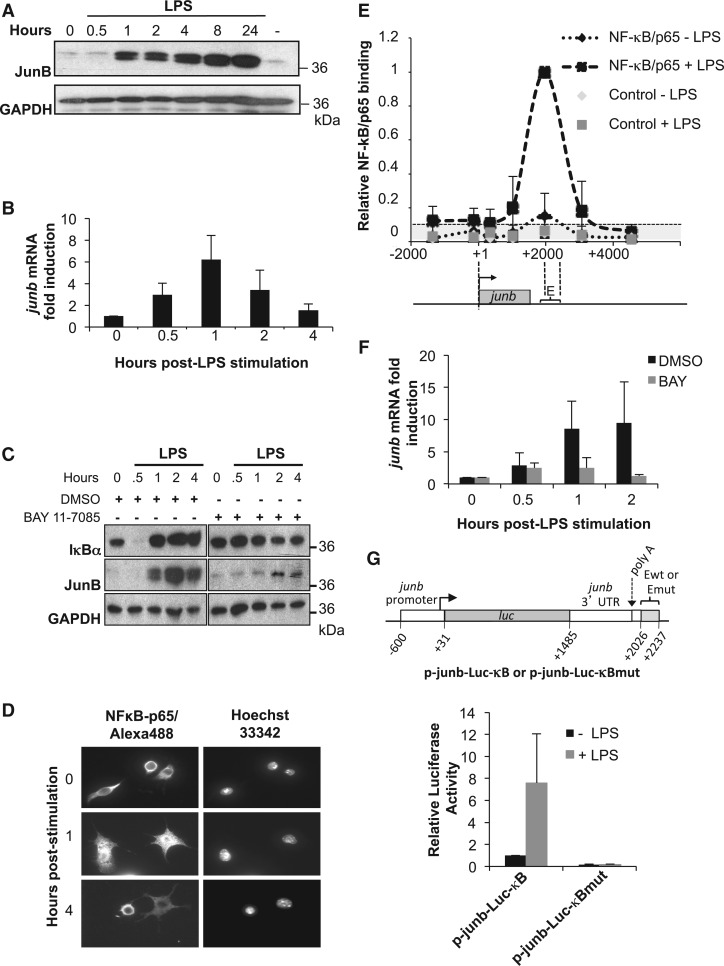
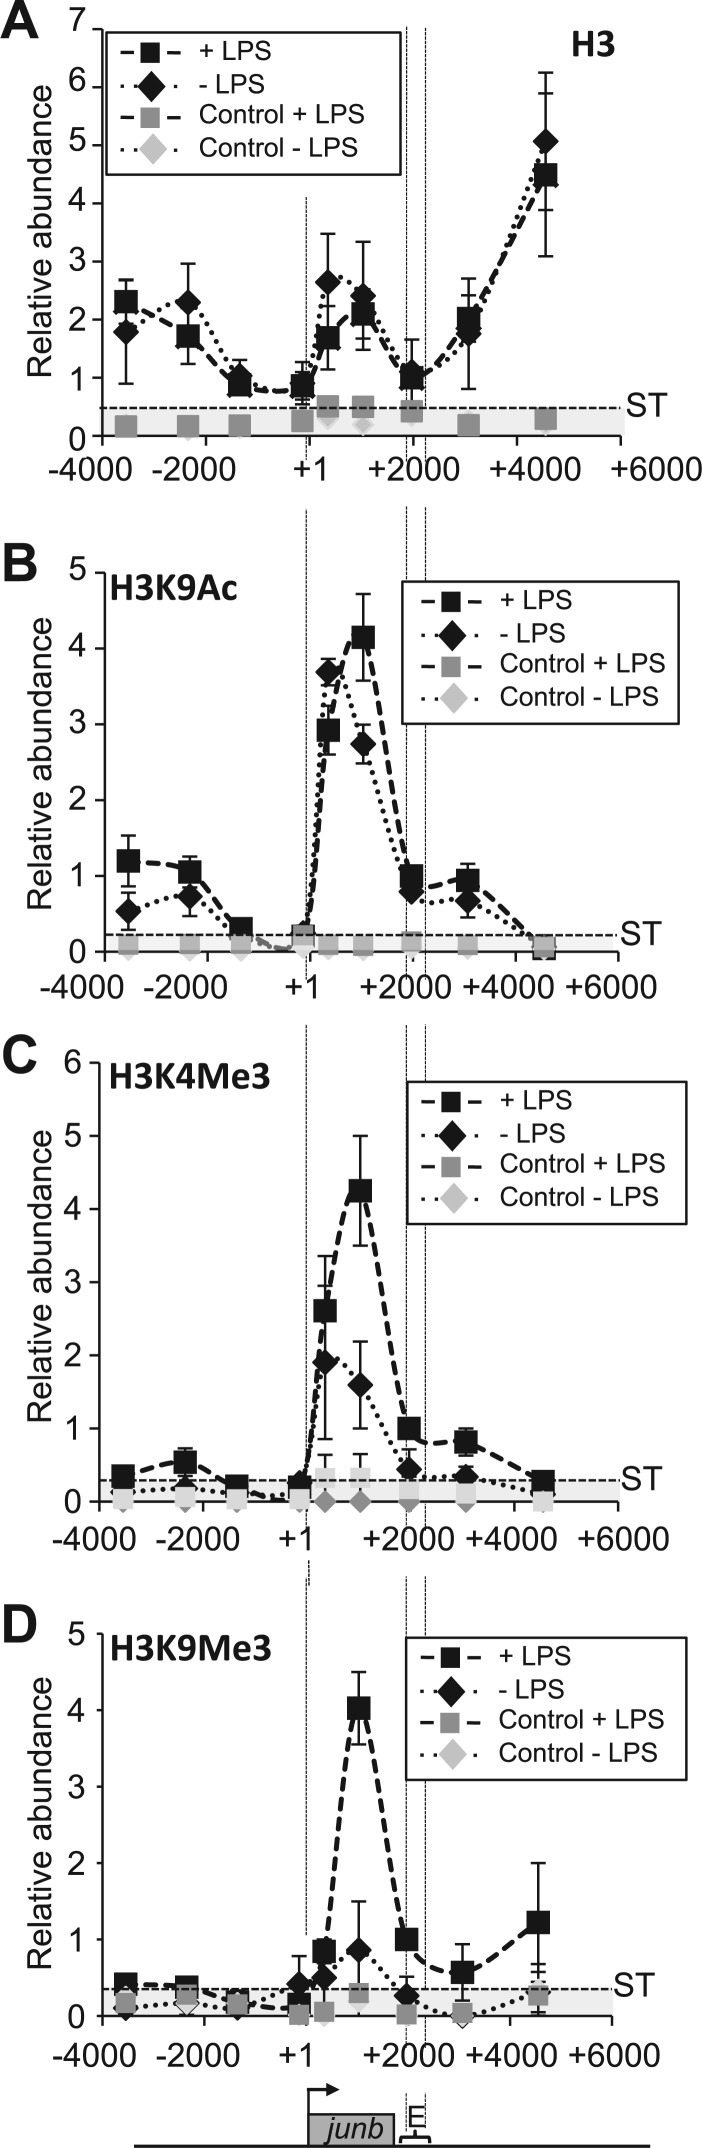
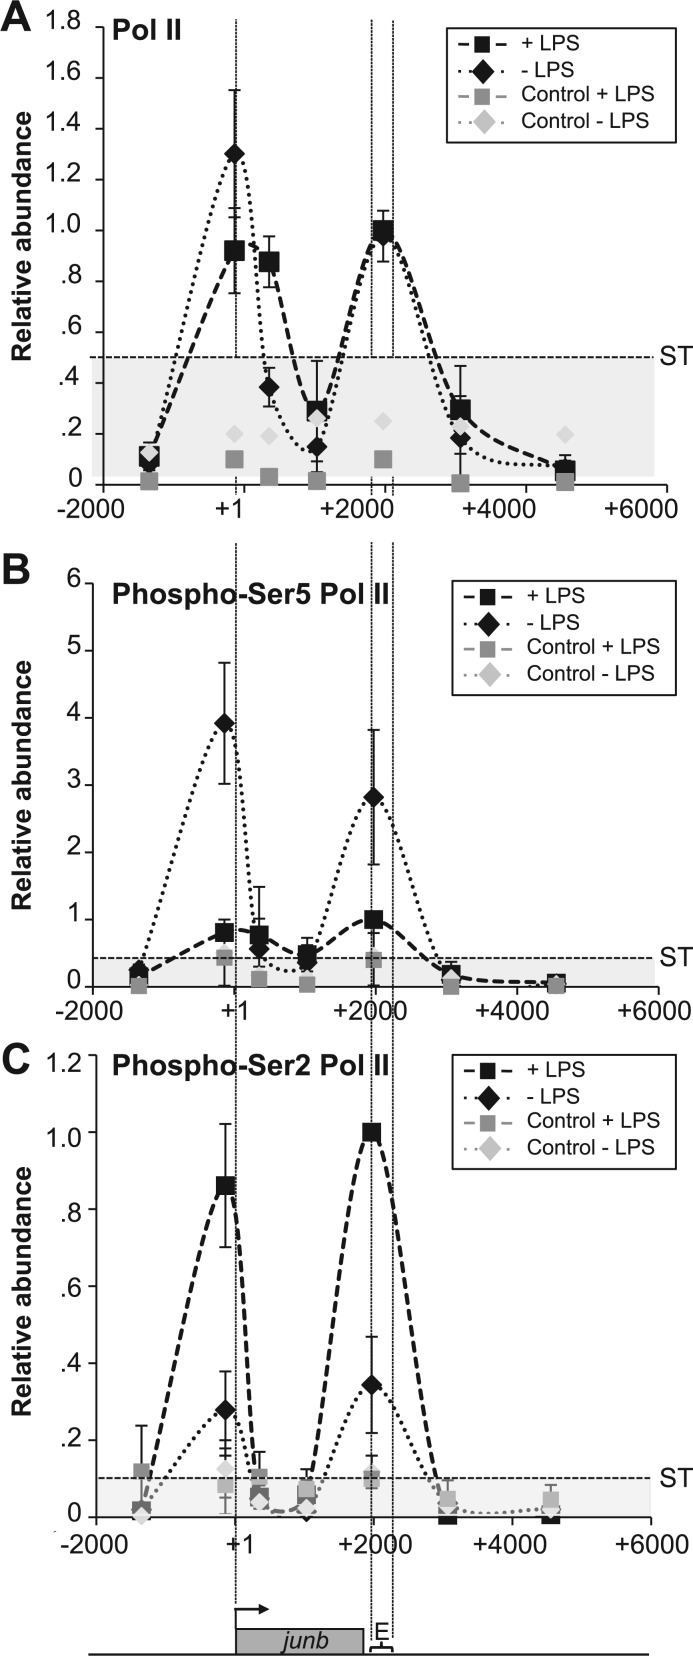
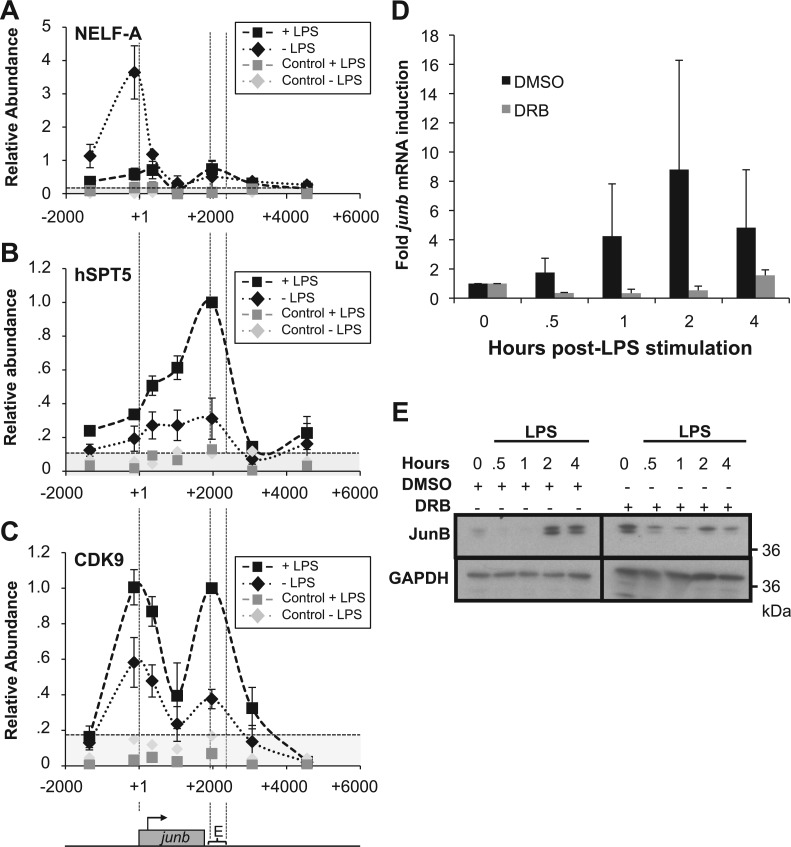
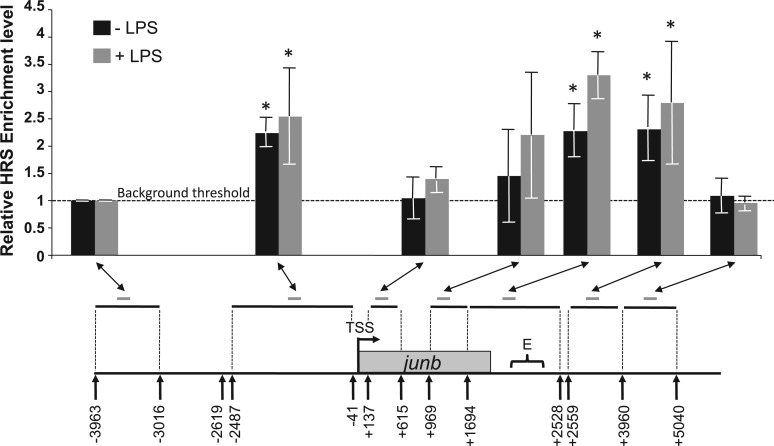
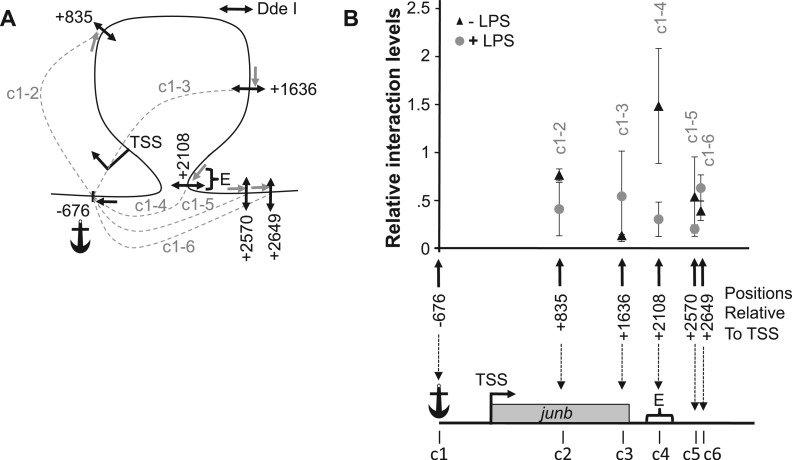
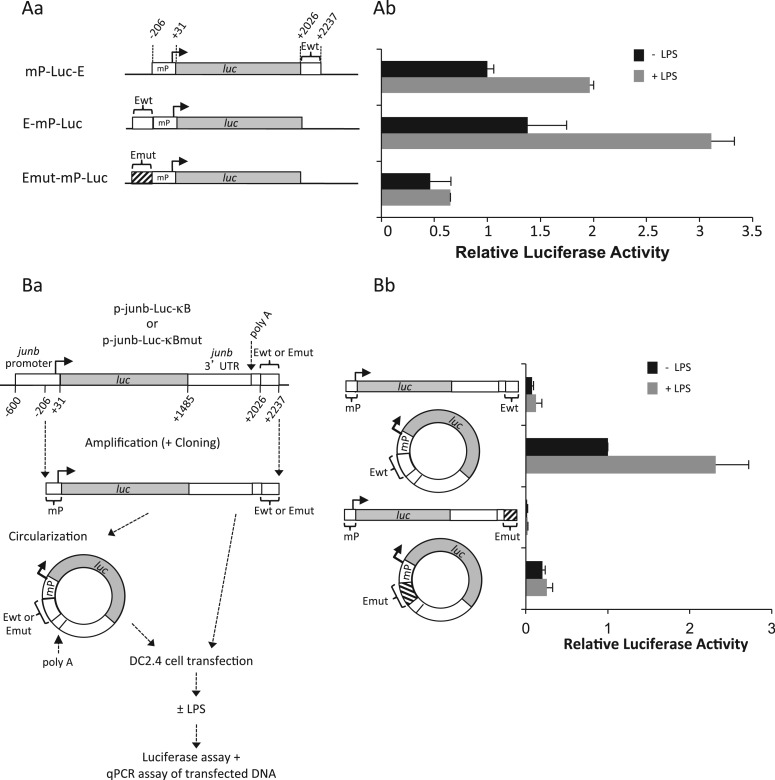
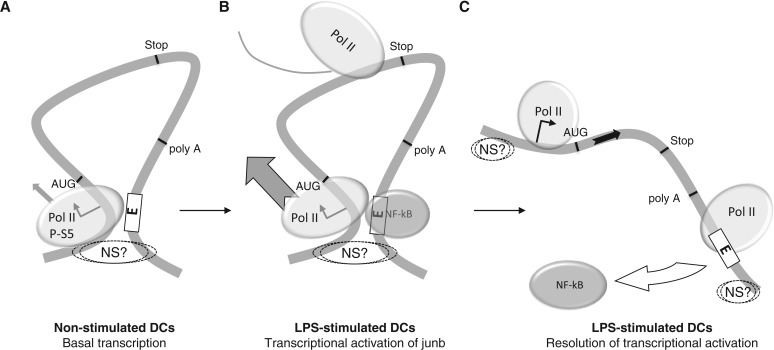
The junb gene behaves as an immediate early gene in bacterial lipopolysaccharide (LPS)-stimulated dendritic cells (DCs), where its transient transcriptional activation is necessary for the induction of inflammatory cytokines. junb is a short gene and its transcriptional activation by LPS depends on the binding of NF-κB to an enhancer located just downstream of its 3' UTR. Here, we have addressed the mechanisms underlying the transcriptional hyper-reactivity of junb. Using transfection and pharmacological assays to complement chromatin immunoprecipitation analyses addressing the localization of histones, polymerase II, negative elongation factor (NELF)-, DRB sensitivity-inducing factor (DSIF)- and Positive Transcription Factor b complexes, we demonstrate that junb is a RNA Pol II-paused gene where Pol II is loaded in the transcription start site domain but poorly active. Moreover, High salt-Recovered Sequence, chromosome conformation capture (3C)- and gene transfer experiments show that (i) junb is organized in a nuclear chromatin loop bringing into close spatial proximity the upstream promoter region and the downstream enhancer and (ii) this configuration permits immediate Pol II release on the junb body on binding of LPS-activated NF-κB to the enhancer. Thus, our work unveils a novel topological framework underlying fast junb transcriptional response in DCs. Moreover, it also points to a novel layer of complexity in the modes of action of NF-κB.


Figures

Figure 1.
Figure 1.
Structure of the junb locus. The transcribed region (1807 bp) is composed of a single exon (box with junb ORF in gray). The E enhancer domain is ∼200 bp long and is located 200 bp downstream of the junb polyadenylation site. It contains a number of binding sites for different transcription factors, including 4 κB sites of which three contribute to transcription (39–42). In the cases of ChIP-, HRS- and RT-qPCR assays, the thick black horizontal bars represent the PCR amplicons, and the numbers indicate nucleotide positions of their 5′-ends materialized by vertical bars. In the case of 3C, thin gray horizontal bars indicate the amplification oligonucleotides used. The numbers correspond to their 5′-ends, which are materialized by a vertical bar (also see Figure 7 for amplicons). Numbers are given with respect to the TSS taken as +1, as indicated in the UCSC database.
Figure 2.
Figure 2.
JunB induction by LPS is NF-κB dependent. (A) Expression of JunB protein. DC2.4 cells were stimulated with LPS and JunB levels were assayed by immunoblotting at different time points. A representative experiment, of 5, is shown. GAPDH was used as an internal invariant control. (B) Expression of junb mRNA. DC2.4 cells were stimulated with LPS for the indicated times and total RNA was purified and subjected to RT-qPCR analysis, as described in ‘Materials and Methods’ section. S26 mRNA was used as an invariant control. Values are the means +/− S.D of six independent experiments. (C) Inhibition of JunB induction by BAY 11-7085. DC2.4 cells were pre-treated with the IKK inhibitor BAY 11-7085 for 30 min or with DMSO as a control, and then treated with LPS for the indicated times. Total cell extracts were analyzed by immunoblotting with anti-IκBα, -JunB- and -GAPDH antisera. The results presented are representative of two independent experiments. (D) NF-κB/p65 nuclear translocation upon LPS stimulation. DC2.4 cells were left unstimulated or were stimulated with LPS for 1 and 4 h. After cell fixation, nuclei were stained with Hoescht 33342 and NF-κB/p65 was detected by indirect immunofluorescence. (E) LPS-induced NF-κB/p65 binding to junb. DC2.4 cells were stimulated with LPS or left untreated, and ChIP experiments were conducted as described in ‘Materials and Methods’ section to assess NF-κB/p65 binding [NF-κB/p65 (± LPS)] over the junb locus using qPCR quantification. Binding to the E region in LPS-stimulated cells was arbitrarily set to 1. Negative controls using an anti-GAPDH antibody [Control (± LPS)] were used to establish the significance threshold (ST), which was 0.1 (see ‘Materials and Methods’ section). The presented data are the average ± SD of five independent experiments. The junb locus is represented below the ChIP data for the sake of clarity. (F) Inhibition of junb mRNA induction by BAY 11-7085. LPS-induced cells were pre-treated for 30 min before stimulation with BAY 11-7085 or DMSO as a control and junb mRNA quantification was conducted as in B. The data are the means ± SD of three independent experiments. (G) Dependence on NF-κB sites for junb induction. DC2.4 cells were transfected for 16 h with either the p-junb-Luc-κB- or the p-junb-Luc-κBmut reporter plasmid (right panel) together with a β-galactosidase reporter plasmid used as an internal standard. They were stimulated, or not, with LPS for 8 h, at which time luciferase activity was assayed (left panel). p-junb-Luc-κB- or the p-junb-Luc-κBmut contain the −600/+2237 region of junb where junb ORF has been replaced by the firefly luciferase. In p-junb-Luc-κBmut, the 3 κB responsive sites have been mutated to render them non-functional. The data are the means of three independent experiments ± SD.
Figure 3.
Figure 3.
Histone distribution and modification on the junb locus. (A) Histone distribution over the junb locus. DC2.4 cells stimulated (+ LPS), or not (− LPS), with LPS and ChIPs were performed with a specific anti-H3 antibody. Relative abundances at various places on the locus were assayed by qPCR. They were normalized with respect to DNA inputs and presented as a ratio to LPS-induced cells with the value on the E domain arbitrarily set to 1. Negative controls using an anti-GAPDH antibody (Control ± LPS) were used to establish the significance threshold (ST), which was 0.5. The presented data correspond to values obtained at the peak of junb stimulation and are the average of two experiments ± SD. Points are linked with dotted lines to make the figure clearer. (B–D) H3 modifications. The same experiments as in (A) were carried out, except that ChIP experiments were conducted with specific anti-H3K4Me3 (B), H3K9Ac (C) and H3K9Me3 (D) antisera. ST were 0.007, 0.2 and 0.6 in B, C and D, respectively.
Figure 4.
Figure 4.
Pol II distribution and modifications on the junb locus. (A) Distribution of Pol II. DC2.4 cells were stimulated, or not, by LPS and ChIP experiments were conducted with a specific anti-Pol II antiserum. ChIP procedures, controls and quantification of relative abundances were the same as in Figure 3. The presented values are those obtained at the peak of LPS induction. The data are the means of three independent experiments ± SD. ST was 0.45. (B) Distribution of phospho-Ser5 Pol II. Experiments were conducted as in A with a specific anti-phospho-Ser5 Pol II antibody. ST was 0.4 (C) Distribution of phospho-Ser2 Pol II. Experiments were conducted as in A with a specific anti-phospho-Ser2 Pol II antibody. ST was 0.1.
Figure 5.
Figure 5.
NELF and pTEF-b on junb. (A–C) Distribution of NELF-A, hspt5 and CDK9. Experiments were conducted as in Figure 4A with antibodies specific for NELF-A (C), Hspt5 (D) and CDK9 (E). ST were 0.2, 0.1 and 0.16, respectively. (D and E) Dependence on CDK9. DC.4 cells were pre-treated with DRB (or DMSO for control cells) for 30 min and stimulated, or not, with LPS. The abundance of junb RNA and protein were assayed by RT-qPCR (D) and immunoblotting (E), respectively, as in Figure 2A and B. Luminograms for DRB-treated cells were exposed for longer periods to make clearer the absence of JunB induction, explaining that time 0 is more intense in the right panel.
Figure 6.
Figure 6.
HSR at the junb locus. DC2.4 cells were stimulated (gray bars), or not (black bars) with LPS and HRS assays were conducted as described in ‘Materials and Methods’ section. Pvu II and Sca I restriction enzymes were used to fragment the locus. They were the only restriction enzymes we found functional in this assay. Their recognition sites are indicated by arrows. Restriction fragments analyzed in the genomic HRS assay are indicated by horizontal black lines whereas the amplicons used to quantify them (see Table 1) are indicated by short gray lines. The presented data are the means of four independent experiments ± SD. The histogram shows the relative enrichment levels of various regions of the junb locus in the HRS assays relative to the enrichment level of a negative control (−3963/−3016 fragment) arbitrarily set to 1. The enrichment level of this negative control is considered to be the background threshold of our experiments. Therefore, enrichment levels >1 and for which the standard deviation does not overlap with this value can be considered as significantly enriched in the HRS fraction. These regions are indicated by stars on the graph. +LPS corresponds to data obtained at the time of maximum transcription activity.
Figure 7.
Figure 7.
The 3C analysis of the junb locus. DC2.4 cells were treated (+LPS), or not (+LPS), by LPS and subjected to quantitative 3C analysis as described in ‘Materials and Methods’ section. (A) Map of the investigated interactions. The frequent cutter Dde I restriction enzyme was used to fractionate the junb locus, as we found it to be the only restriction enzyme that permits sufficiently resolutive analysis of this short locus. The positions of the Dde I sites (double arrows) used in this 3C analysis are indicated c1 to c6. c1 was taken as the anchor from which possible interactions with other region of the junb locus were assessed. Their locations are indicated relative to the junb TSS taken as +1/−1. The possible interactions that have been tested in this 3C experiments are indicated by dashed lines, which are labeled c1-c2 to c1-c6. The anchor amplification oligonucleotide used in 3C qPCR is indicated by a black simple arrow, whereas the other primers are indicated by gray ones. (B) Quantification of 3C analyses of the junb locus. The data represent the relative interaction frequencies between the anchor region (c1) containing the junb TSS and the various other tested sites (c2 to c6) of the junb locus. Relative interaction frequencies were determined by qPCR relative to standard curves as previously described (50,51). Data points represent the mean of four independent experiments ± SD. In the absence of LPS (black triangles), a strong interaction between the junb promoter and the downstream E element was observed (local peak for the c1-4 chimera). However, 1 h after LPS addition (gray circles), no specific interactions could be found.
Figure 8.
Figure 8.
Stronger transcriptional activity in response to LPS stimulation upon forced proximity of junb promoter and enhancer regions. (A) Transfection of mP-luc-E, E-mP-luc and Emut-mP-luc plasmids in DC2.4 cells. junb minimal promoter (mP), wild-type E domain and E-domain mutated on the NF-κB-responsive sites were cloned upstream or downstream of the luciferase gene (luc) of the pGL3 reporter plasmid as indicated in Aa. mP corresponds to positions −206/+31 in mouse junb and E to positions +2022/+2237. DC2.4 was transfected, stimulated and processed for luciferase assay as in Figure 2G. Plasmids were cleaved with the Ase I restriction enzyme that cuts on both sides of the mP-luc-E, E-mP-luc and Emut-mP-luc fragments to avoid bias linked to the circular nature of plasmids. The presented data are the results of three independent experiments (Ab). (B) Transfection of linear and circular fragments bearing chimeric luc/junb genes. DNA fragments spanning the minimal junb promoter (starting at position −206) to the end of the E domain (position 2237) were purified from the p-junb-Luc-κB- and the p-junb-Luc-κBmut reporter plasmids used in Figure 2G. They were then circularized using the T4 DNA ligase as described in ‘Materials and Methods’ section. DC2.4 cells were then parallely transfected with the linear and circular isoforms of these fragments and LPS-stimulated as described in Ba before assays of both luciferase activity and luciferase DNA in cell lysates. The latter DNA assays showed comparable amounts of the DNA isoforms at the end of the experiments. The results of luciferase assay after normalization of data are presented in Bb. They correspond to four independent experiments. Details of experimental procedures are given in ‘Materials and Methods’ section.
Figure 9.
Figure 9.
Model for transient transcriptional induction of junb in DCs. (A) Basal junb transcription in non-stimulated DCs: Pol II is largely paused by the TSS. The locus is organized in a short chromatin loop bringing the TSS and the E domain into close spatial proximity. This loop is anchored to an undefined intranuclear structure (NS?). (B) Transcriptional activation of junb. On LPS stimulation, NF-κB is activated and binds to the E domain. This fires Pol II activation, which is released on the gene body. (B) Resolution of junb transcriptional activation. NF-κB is released from E and the chromatin loop is relaxed. junb remains attached to a nuclear structure both upstream of the TSS and downstream of the E domain. Some paused Pol II is found in the TSS region and some Pol II having terminated transcription lags for some time in the E region.

Similar articles

Cited by

References

    1. Banchereau J, Briere F, Caux C, Davoust J, Lebecque S, Liu YJ, Pulendran B, Palucka K. Immunobiology of dendritic cells. Annu. Rev. Immunol. 2000;18:767–811. - PubMed
    1. Heath WR, Carbone FR. Dendritic cell subsets in primary and secondary T cell responses at body surfaces. Nat. Immunol. 2009;10:1237–1244. - PubMed
    1. Reis e Sousa C. Dendritic cells in a mature age. Nat. Rev. Immunol. 2006;6:476–483. - PubMed
    1. Steinman RM, Banchereau J. Taking dendritic cells into medicine. Nature. 2007;449:419–426. - PubMed
    1. Rabani M, Levin Z, Fan L, Adiconis X, Raychowdhury R, Garber M, Gnirke A, Nusbaum C, Hacohen N, Friedman N, et al. Metabolic labeling of RNA uncovers principles of RNA production and degradation dynamics in mammalian cells. Nat. Biotechnol. 2011;29:436–445. - PMC - PubMed

Publication types