

Regulation of optic nerve head blood flow during combined changes in intraocular pressure and arterial blood pressure
- PMID: 23921903
- PMCID: PMC3851895
- DOI: 10.1038/jcbfm.2013.137
Regulation of optic nerve head blood flow during combined changes in intraocular pressure and arterial blood pressure
Abstract
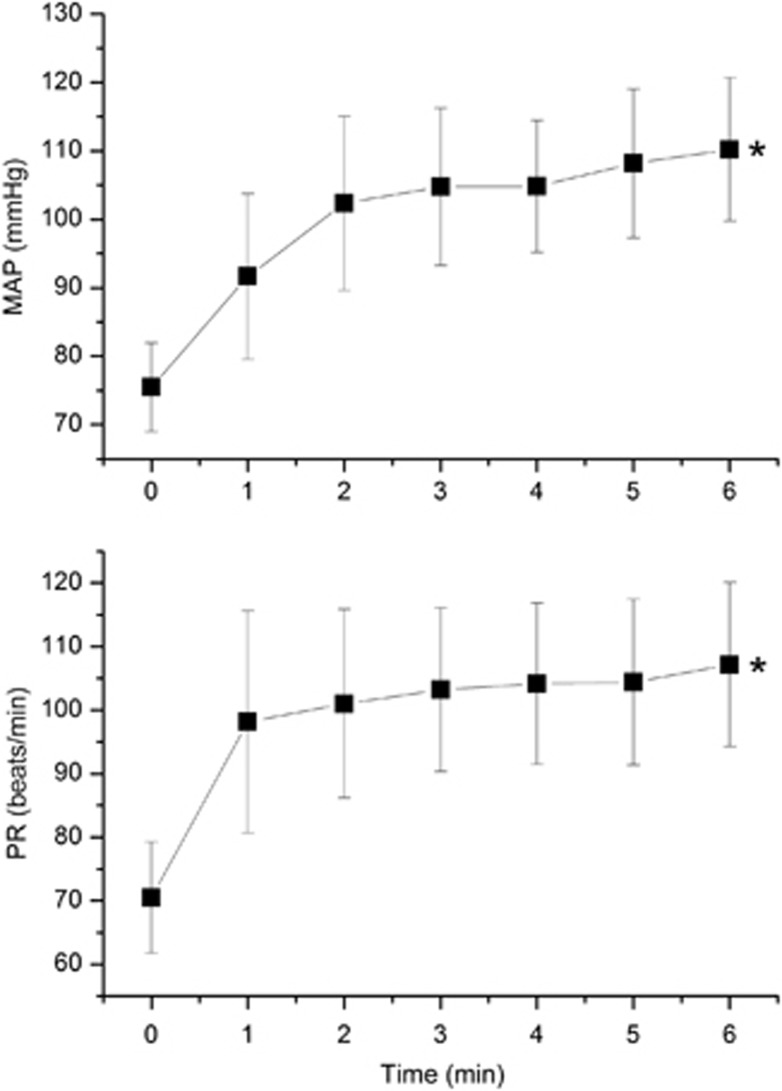
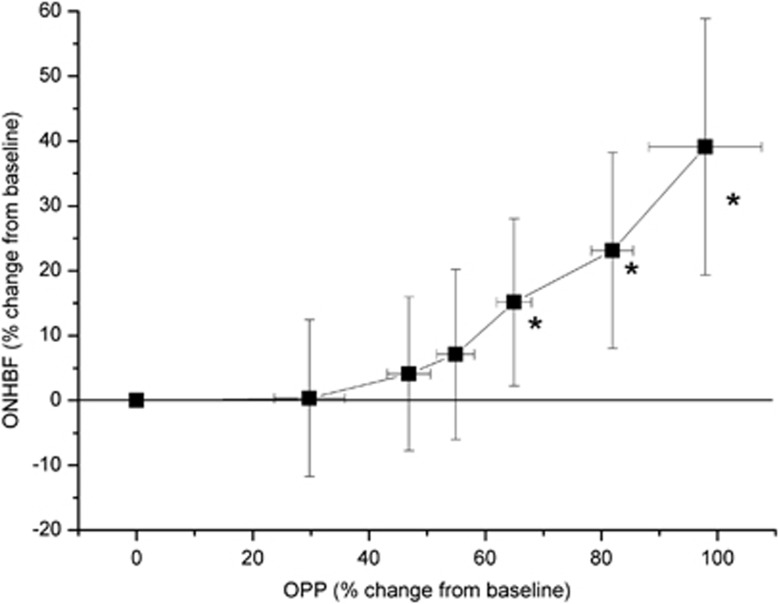
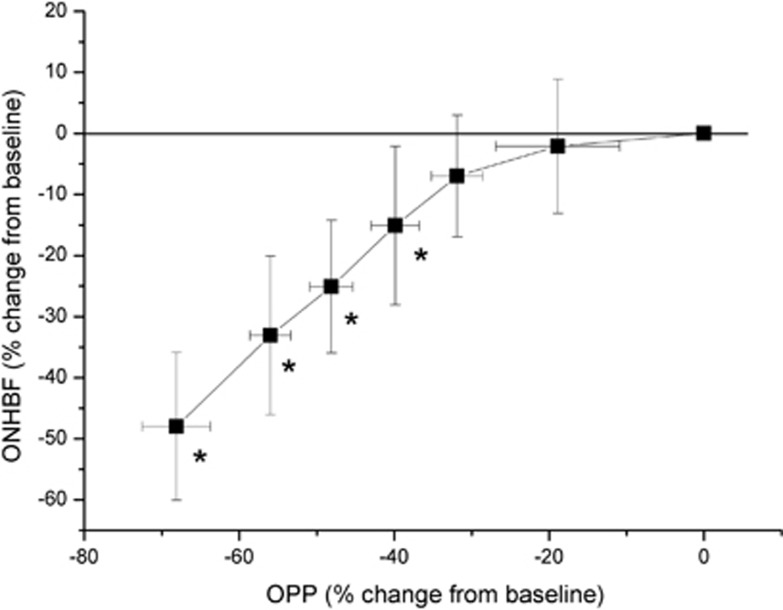
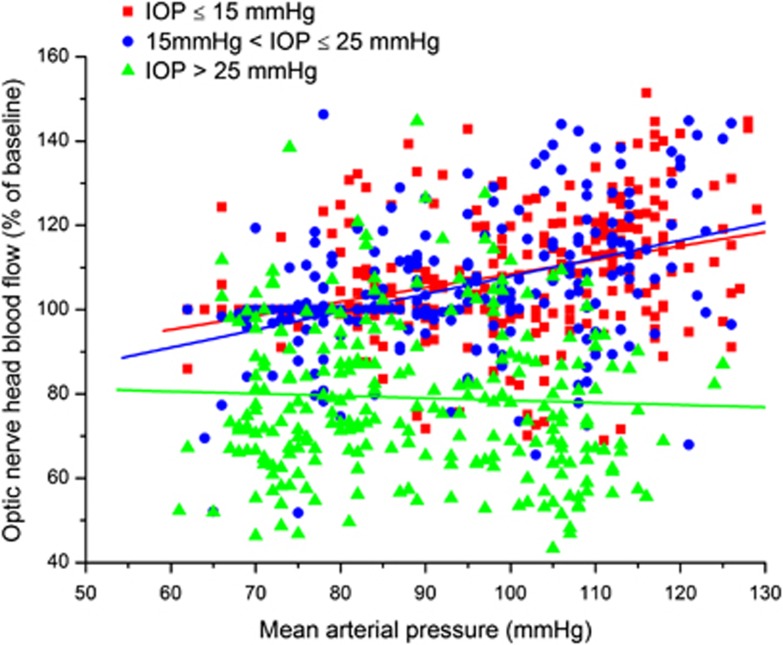
In the choroid, there is evidence that blood flow does not only depend on ocular perfusion pressure (OPP), but also on absolute mean arterial pressure (MAP) and intraocular pressure (IOP). The present study included 40 healthy subjects to investigate whether such behavior is also found in the optic nerve head (ONH). The ONH blood flow (ONHBF) was studied using laser Doppler flowmetry during a separate increase in IOP and MAP as well as during a combined elevation. Mean arterial pressure was increased by isometric exercise and IOP by the suction method. During both, the change in ONHBF was less pronounced than the change in OPP indicating autoregulation. Correlation analysis was performed for the combined experiments after pooling all data according to IOP and MAP values. A correlation between ONHBF and MAP was found at IOPs 25 mm Hg (P<0.001), but not at IOPs>25 mm Hg (P=0.79). Optic nerve head blood flow and IOP were significantly correlated (P<0.001), and ONHBF was only slightly dependent on MAP. The data of the present study indicate a complex regulation of ONHBF during combined changes in MAP and IOP. Our results may be compatible with myogenic mechanisms underlying autoregulation, and indicate better ONHBF regulation during an increase in MAP than during an increase in IOP.
Figures


Similar articles
-
Role of nitric oxide in optic nerve head blood flow regulation during an experimental increase in intraocular pressure in healthy humans.Exp Eye Res. 2013 Nov;116:247-53. doi: 10.1016/j.exer.2013.09.008. Epub 2013 Sep 20. Exp Eye Res. 2013. PMID: 24060346 Clinical Trial.
-
Comparison of choroidal and optic nerve head blood flow regulation during changes in ocular perfusion pressure.Invest Ophthalmol Vis Sci. 2012 Jul 1;53(8):4337-46. doi: 10.1167/iovs.11-9055. Invest Ophthalmol Vis Sci. 2012. PMID: 22661477
-
The Effect of Orally Administered Dronabinol on Optic Nerve Head Blood Flow in Healthy Subjects-A Randomized Clinical Trial.Clin Pharmacol Ther. 2020 Jul;108(1):155-161. doi: 10.1002/cpt.1797. Epub 2020 Feb 23. Clin Pharmacol Ther. 2020. PMID: 31977076 Free PMC article. Clinical Trial.
-
A novel noninvasive videographic method for quantifying changes in the chromaticity of the optic nerve head with changes in the intraocular pressure, pulsatile choroidal blood flow and visual neural function in humans.Surv Ophthalmol. 1994 May;38 Suppl:S35-51. doi: 10.1016/0039-6257(94)90045-0. Surv Ophthalmol. 1994. PMID: 7940147 Review.
-
The complex interaction between ocular perfusion pressure and ocular blood flow - relevance for glaucoma.Exp Eye Res. 2011 Aug;93(2):141-55. doi: 10.1016/j.exer.2010.09.002. Epub 2010 Sep 22. Exp Eye Res. 2011. PMID: 20868686 Review.
Cited by
-
Transient Visual Loss in Young Females with Crowded Optic Discs: A Proposed Aetiology.Neuroophthalmology. 2021 Jun 18;45(6):372-379. doi: 10.1080/01658107.2021.1937231. eCollection 2021. Neuroophthalmology. 2021. PMID: 34720267 Free PMC article.
-
Optic Nerve Head Perfusion Before and After Intravitreal Antivascular Growth Factor Injections Using Optical Coherence Tomography-based Microangiography.J Glaucoma. 2019 Mar;28(3):188-193. doi: 10.1097/IJG.0000000000001142. J Glaucoma. 2019. PMID: 30817497 Free PMC article.
-
Does Practitioner Experience Affect Intraocular Pressure After Endotracheal Intubation?Cureus. 2023 Mar 23;15(3):e36593. doi: 10.7759/cureus.36593. eCollection 2023 Mar. Cureus. 2023. PMID: 36992815 Free PMC article.
-
The assessment of acute chorioretinal changes due to intensive physical exercise in young adults.PLoS One. 2022 May 25;17(5):e0268770. doi: 10.1371/journal.pone.0268770. eCollection 2022. PLoS One. 2022. PMID: 35613112 Free PMC article.
-
Impact of anatomic variability and other vascular factors on lamina cribrosa hypoxia.bioRxiv [Preprint]. 2024 Sep 13:2024.09.12.610282. doi: 10.1101/2024.09.12.610282. bioRxiv. 2024. PMID: 39314360 Free PMC article. Preprint.
References
-
- Gordon MO, Beiser JA, Brandt JD, Heuer DK, Higginbotham EJ, Johnson CA, et al. The Ocular Hypertension Treatment Study: baseline factors that predict the onset of primary open-angle glaucoma Arch Ophthalmol 2002120714–720.discussion 829-730. - PubMed
-
- Leske MC, Wu SY, Honkanen R, Nemesure B, Schachat A, Hyman L, et al. Nine-year incidence of open-angle glaucoma in the Barbados Eye Studies. Ophthalmology. 2007;114:1058–1064. - PubMed
-
- Leske MC, Connell AM, Wu SY, Nemesure B, Li X, Schachat A, et al. Incidence of open-angle glaucoma: the Barbados Eye Studies. The Barbados Eye Studies Group. Arch Ophthalmol. 2001;119:89–95. - PubMed
-
- Flammer J, Orgul S, Costa VP, Orzalesi N, Krieglstein GK, Serra LM, et al. The impact of ocular blood flow in glaucoma. Prog Retin Eye Res. 2002;21:359–393. - PubMed
Publication types
MeSH terms
LinkOut - more resources
Full Text Sources
Other Literature Sources
