. 2013 Aug;25(8):2783-97.
doi: 10.1105/tpc.113.114793. Epub 2013 Aug 6.

Epigenetic and genetic influences on DNA methylation variation in maize populations

Affiliations

Epigenetic and genetic influences on DNA methylation variation in maize populations

Steven R Eichten et al. Plant Cell. 2013 Aug.

Abstract

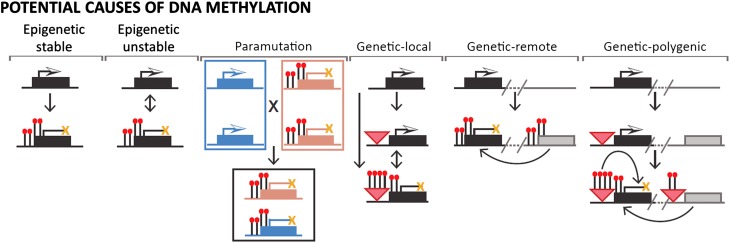
DNA methylation is a chromatin modification that is frequently associated with epigenetic regulation in plants and mammals. However, genetic changes such as transposon insertions can also lead to changes in DNA methylation. Genome-wide profiles of DNA methylation for 20 maize (Zea mays) inbred lines were used to discover differentially methylated regions (DMRs). The methylation level for each of these DMRs was also assayed in 31 additional maize or teosinte genotypes, resulting in the discovery of 1966 common DMRs and 1754 rare DMRs. Analysis of recombinant inbred lines provides evidence that the majority of DMRs are heritable. A local association scan found that nearly half of the DMRs with common variation are significantly associated with single nucleotide polymorphisms found within or near the DMR. Many of the DMRs that are significantly associated with local genetic variation are found near transposable elements that may contribute to the variation in DNA methylation. Analysis of gene expression in the same samples used for DNA methylation profiling identified over 300 genes with expression patterns that are significantly associated with DNA methylation variation. Collectively, our results suggest that DNA methylation variation is influenced by genetic and epigenetic changes that are often stably inherited and can influence the expression of nearby genes.


Figures

Figure 1.
Figure 1.
Identification of DMRs across Diverse Maize Lines. (A) An outline of the methods to identify DMRs. DMR discovery was performed by contrasting replicated measurements of 19 NAM parental lines (McMullen et al., 2009) with B73. The methylation levels for these 9899 regions were also determined for a single replicate of 31 additional genotypes from the HapMap2 panel (Chia et al., 2012). A series of filtering criteria were applied to identify robust common (three or more genotypes with both high and low methylation) or rare (only one or two genotypes with alternate methylation state) DMRs. (B) to (D) Examples of common (B), rare methylated (C), and rare unmethylated (D) DMRs are visualized in all 51 genotypes. In each case, the genotypes are grouped according to DNA methylation state. The red (high) and blue (low) indicate variable methylation with the DMR and probes with black coloring are outside of the DMR. The genes and repetitive elements annotated in each region are shown at the bottom. (E) A genome-wide view of DMRs in relationship to other genomic features. Circos (Krzywinski et al., 2009) was used to show (outside to inside tracks) rare DMRs (purple ticks), common DMRs (brown ticks), gene density in 1-Mb windows based on annotation from Schnable et al. (2009) (green is high), repeat density in 1-Mb windows based on annotated from Schnable et al. (2009) (orange is high), and recombination rate as centimorgans/Mb from Liu et al. (2009) (black is high).
Figure 2.
Figure 2.
Hierarchical Clustering of DMRs in All Genotypes. (A) The DMR state (yellow, hypomethylated; black, hypermethylated) was used to perform hierarchical clustering for the rare DMRs. There is not strong evidence for single genotypes exhibiting unique DNA methylation profiles relative to other genotypes for common or rare DMRs. The results illustrate the enrichment for the rare state to reflect hypomethylation in a few genotypes as opposed to hypermethylation in a few genotypes. The rare state can be observed in any of the genotypes. (B) Hierarchical clustering of 172 maize and teosinte-specific DMRs across all maize, landrace, and teosinte samples studied. Clear separation of maize and teosinte lines is visible (coloring on bottom). Landrace samples often appear to have variable methylation state for maize and teosinte-specific DMRs (center cluster). (C) Significant enrichment for hypomethylation in rare DMRs. (D) The overlap between maize-teosinte DMRs and the DMRs discovered among the 19 NAM parents is shown.
Figure 3.
Figure 3.
Validation of Differential Methylation Levels by MethylC-Seq Data on an Independent Sample of B73 and Mo17. (A) to (C) Examples of DMRs that exhibit differences in CG and CHG (A), CHG only (B), or CG only (C). Weighted DNA methylation levels (Schultz et al., 2012) were calculated for cytosines in CG, CHG, and CHH contexts and summarized for the DMR. The CG methylation levels are shown in different shades of purple, and CHG methylation levels are shown in different shades of green for B73 and Mo17. The meDIP array methylation estimates are shown for both B73 and Mo17 with high methylation indicated by red and low methylation indicated by blue. The annotation of genes and repetitive sequences for each region is shown at the bottom. (D) For the 248 DMRs that exhibit significant meDIP array variation and have at least 80% coverage of MethylC-Seq reads in both B73 and Mo17, the relative levels of CG (y axis) and CHG (x axis) methylation are shown. The color coding of each DMR indicates the meDIP array difference in DNA methylation levels between B73 and Mo17 (yellow, higher in B73; black, higher in Mo17). The majority of DMRs show substantial differences in both CG and CHG methylation in the direction predicted by the meDIP array data. A small number of the DMRs only exhibit differences in CG or CHG methylation or do not show any difference in methylation levels in this independent sample of B73 and Mo17.
Figure 4.
Figure 4.
Many Common DMRs Are Associated with Local Genetic Variation. (A) An example DMR displaying significant association to local SNPs. Vertical lines indicate DMR boundaries. Horizontal line (red) indicates 1% quantile P value cutoff based on permutation analysis of other SNPs with the methylation variation for this region. SNPs above this line display significant association to DMR methylation state. (B) Example DMR displaying no significance for local SNPs with methylation state. (C) The proportion of DMRs with and without significant association with local SNPs. (D) Example relative methylation values [log2(IP/input)] for additional genotypes. Color indicates the predicted high methylation and low methylation allele based on their genotype calls. (E) Enrichment for heterochromatin spreading transposable elements near both common and rare DMRs. Common and rare DMRs were mapped to nearby repetitive elements within 500 bp and classified as having no annotated repeat, nonspreading elements, or heterochromatin spreading elements (based on genome-wide B73 reference genome annotations from Schnable et al. [2009] and spreading assignments from Eichten et al. [2012]). The DMRs were compared with a set of 10,000 control regions selected to reproduce features of our experimental DMRs. The common and rare DMRs are enriched for having spreading transposable elements within 500 bp compared with the control regions. For each of the three groups, the proportion of common DMRs associated to local SNPs is presented (white text in purple bars). (F) For each of the three repeat classes in Figure 3E, the proportion of high (>80%) and low (<20%) CG methylation in B73 is presented for both common and rare DMRs. The total number of DMRs in each class is presented below each chart. An increase in methylation level in B73 is observed for DMRs near spreading elements.
Figure 5.
Figure 5.
DMRs Appear Heritable across Diverse and Recombinant Inbred Lines. (A) Examples of five classes of DMR stability across 17 B73-Mo17 RILs are shown. These are divided into locally inherited “cis” patterns, locally inherited “unstable cis” patterns with occasionally methylation state shift, remote “trans” inheritance of methylation state by nonlocal region of the genome, DMRs displaying paramutation-like states in which all lines regardless of local genetic content appear like one parent, and complex DMRs that display methylation state instability or multi-region control. The total number of DMRs for each category is displayed below. (B) The proportion of each RIL inheritance class is presented based on DMR association class. Few changes in inheritance states were observed due to DMR class (common associated, common nonassociated, and rare).
Figure 6.
Figure 6.
DMRs Associated with Gene Expression State. (A) and (B) Examples of common (A) and rare (B) DMRs showing correlation to nearby gene (within 5 kb) expression state. The y axis displays log (reads per kilobase per million reads) values for the individual gene across 50 genotypes compared with array relative methylation value across 50 genotypes. (C) DMR-gene associations were grouped by the location of the DMR relative to the associated gene. DMRs were classified as being upstream (>5 kb or between 0 and 5 kb of a gene transcription start site), 5′ overlapping (DMR overlaps gene transcription start site), within (DMR falls completely within the borders of a gene), 3′ overlapping (DMR overlaps end of annotated gene), or downstream (0 to 5 kb or >5 kb from gene end). The position of DMRs in relationship to their associated gene is displayed for both positive (gray) and negative (black) correlations. An enrichment for negative methylation expression correlations for DMRs overlapping the 5′ end of genes is present.
Figure 7.
Figure 7.
Diagram of Potential Causes of DNA Methylation. DNA methylation variation may act as either an epigenetic mark independent from genetic variation (left) or as a heterochromatin mark linked to genetic variation (right). Epigenetic-stable variation acts independently of genetic context and is stable through generations. Epigenetic-unstable acts in a similar fashion; however, the instability of methylation states allows for reversion of methylation state at some frequency. Paramutation acts through a unique mechanism due to the activity of differently methylated alleles in the same nucleus of a hybrid. DNA methylation linked to genetic variation can be separated into three distinct categories. Genetic-local is where DNA methylation may be either controlled or facilitated by a local genetic variation such as a transposon insertion. Genetic-remote is where a genetic variant in trans acts to change the methylation state at the observed loci. The final class, genetic-polygenic, involves the actions of both local and trans-acting factors to initiate a DNA methylation change at the observed loci. This mechanism is expected to be complex in nature, requiring the knowledge of all controlling site genotypes in order to predict DNA methylation state. [See online article for color version of this figure.]

References

    1. Baucom R.S., Estill J.C., Chaparro C., Upshaw N., Jogi A., Deragon J.M., Westerman R.P., Sanmiguel P.J., Bennetzen J.L. (2009). Exceptional diversity, non-random distribution, and rapid evolution of retroelements in the B73 maize genome. PLoS Genet. 5: e1000732. - PMC - PubMed
    1. Becker C., Hagmann J., Müller J., Koenig D., Stegle O., Borgwardt K., Weigel D. (2011). Spontaneous epigenetic variation in the Arabidopsis thaliana methylome. Nature 480: 245–249 - PubMed
    1. Bender J., Fink G.R. (1995). Epigenetic control of an endogenous gene family is revealed by a novel blue fluorescent mutant of Arabidopsis. Cell 83: 725–734 - PubMed
    1. Bird A. (2007). Perceptions of epigenetics. Nature 447: 396–398 - PubMed
    1. Buckler E.S., Gaut B.S., McMullen M.D. (2006). Molecular and functional diversity of maize. Curr. Opin. Plant Biol. 9: 172–176 - PubMed

Publication types

Associated data