. 2013 Jul 26;8(7):e69612.
doi: 10.1371/journal.pone.0069612. Print 2013.

Spatial relationships between GABAergic and glutamatergic synapses on the dendrites of distinct types of mouse retinal ganglion cells across development

Affiliations

Spatial relationships between GABAergic and glutamatergic synapses on the dendrites of distinct types of mouse retinal ganglion cells across development

Adam Bleckert et al. PLoS One. .

Abstract

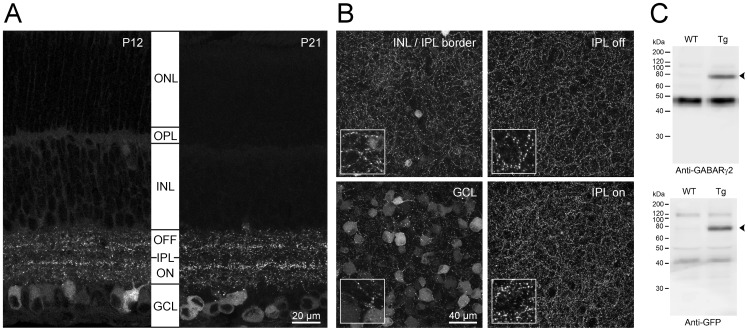
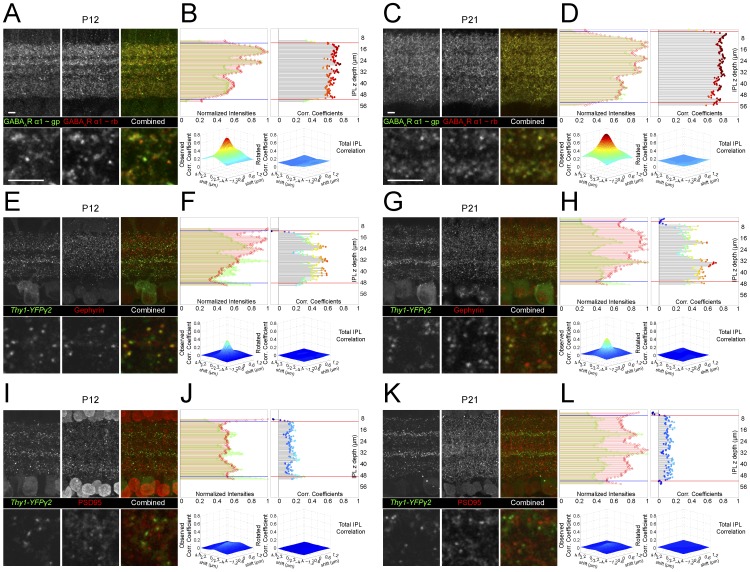
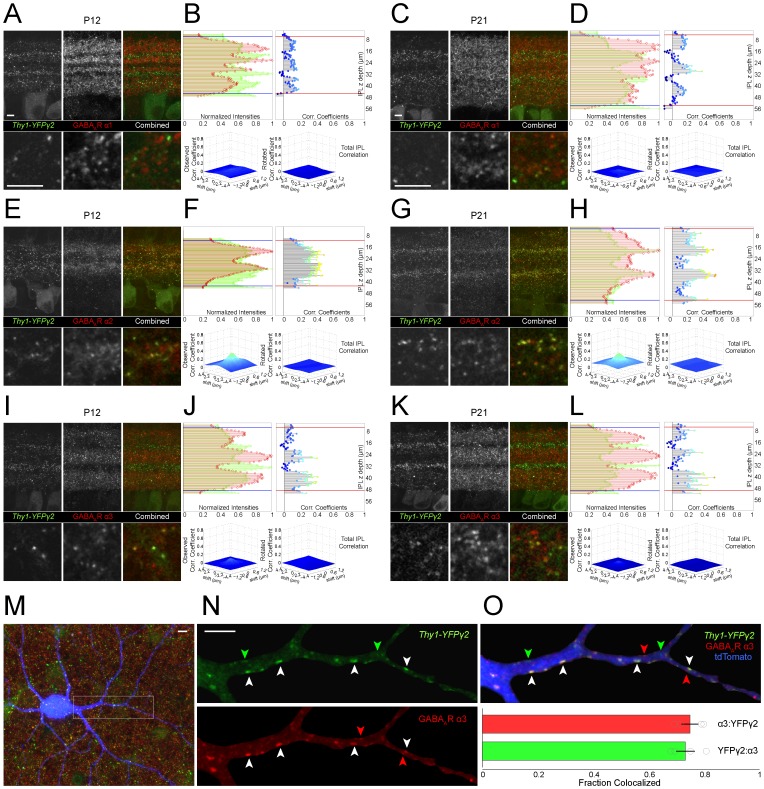
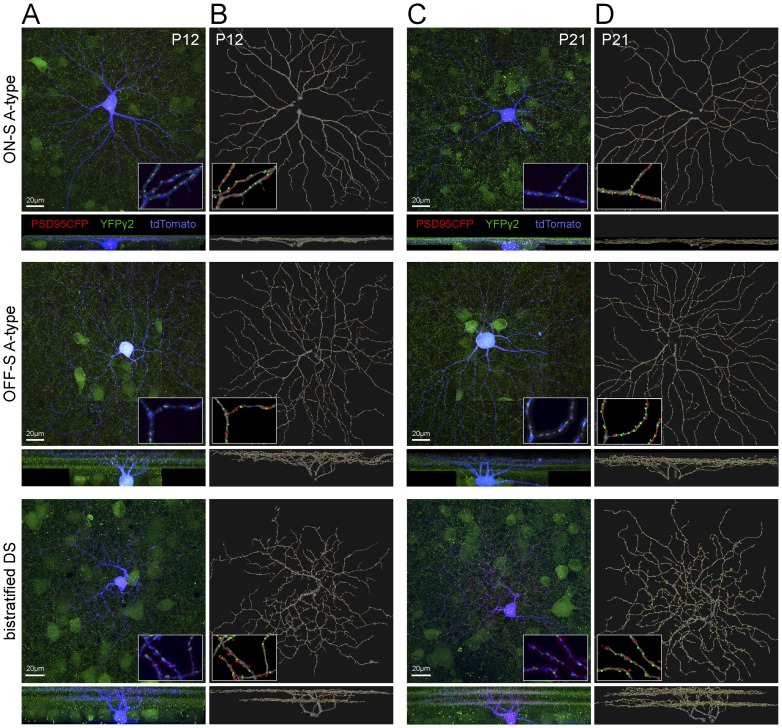
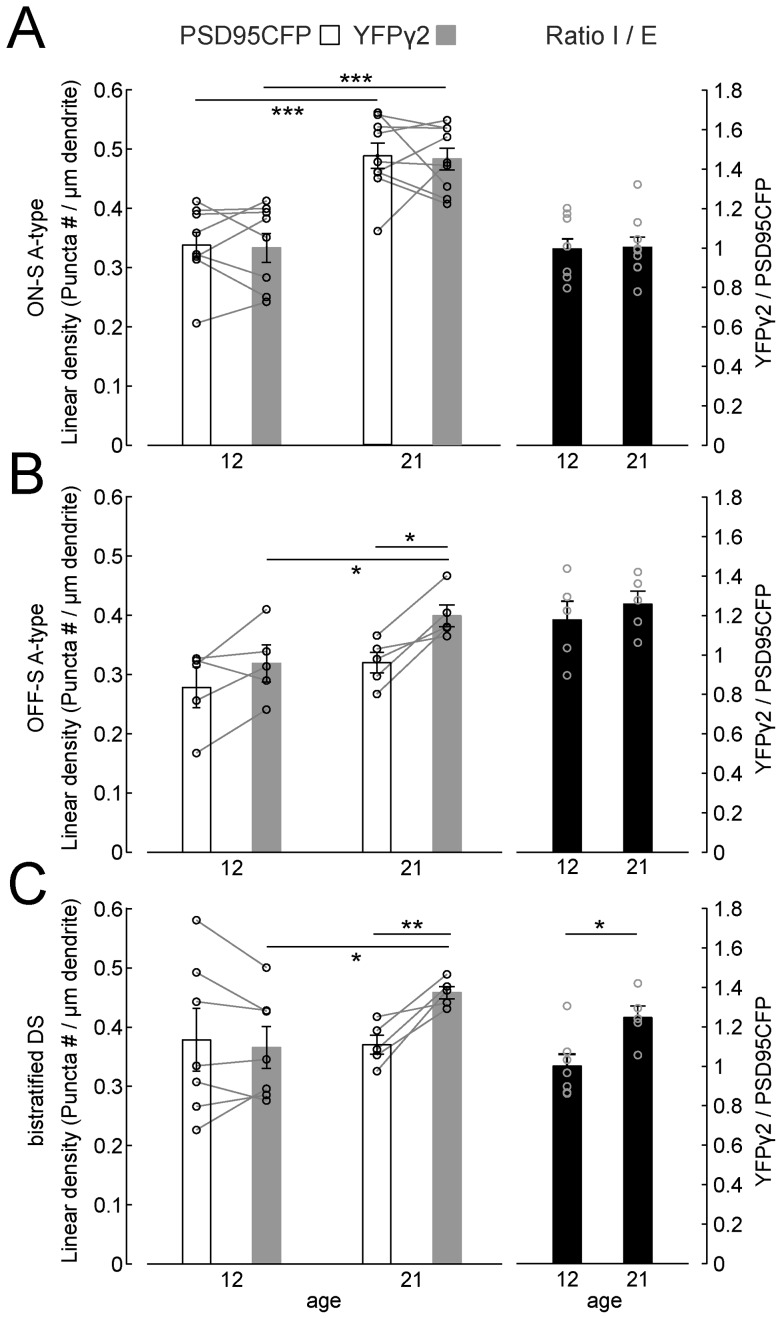
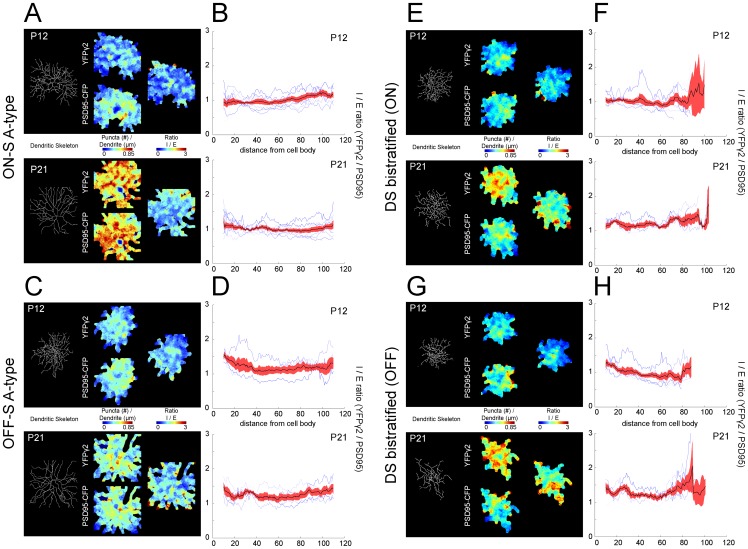
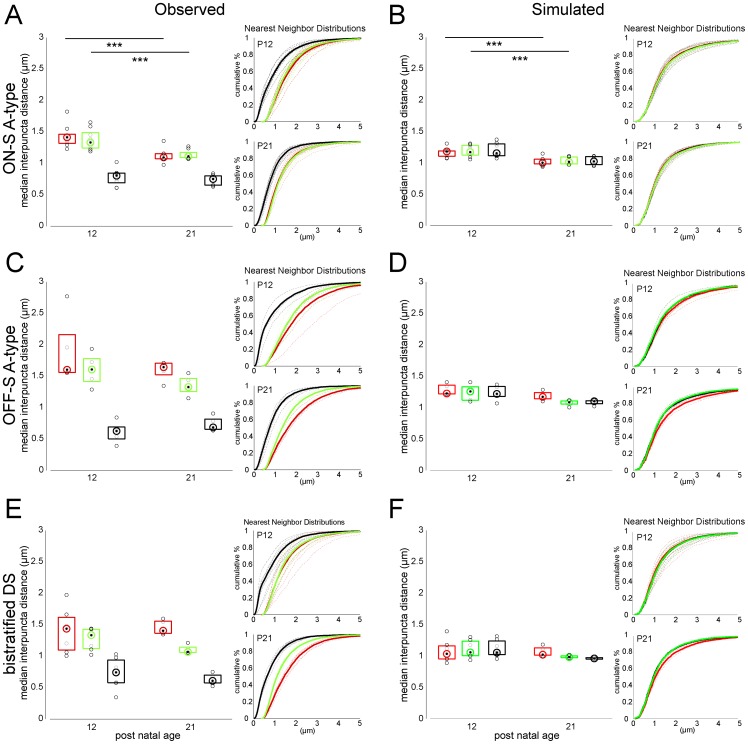
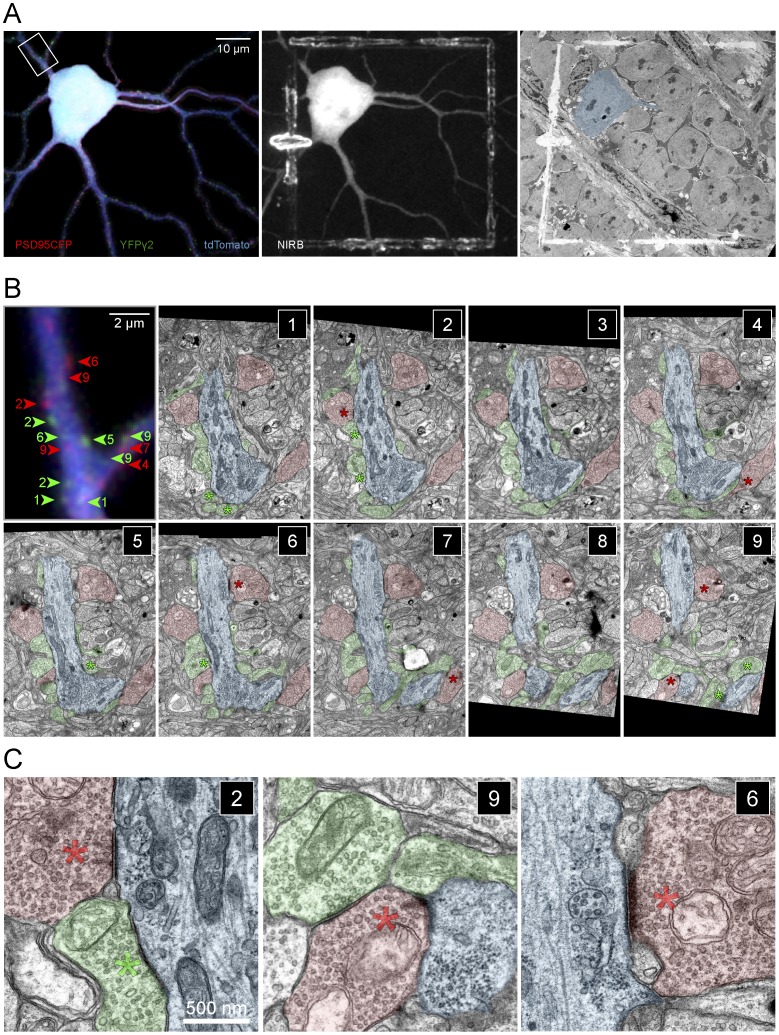
Neuronal output requires a concerted balance between excitatory and inhibitory (I/E) input. Like other circuits, inhibitory synaptogenesis in the retina precedes excitatory synaptogenesis. How then do neurons attain their mature balance of I/E ratios despite temporal offset in synaptogenesis? To directly compare the development of glutamatergic and GABAergic synapses onto the same cell, we biolistically transfected retinal ganglion cells (RGCs) with PSD95CFP, a marker of glutamatergic postsynaptic sites, in transgenic Thy1-YFPγ2 mice in which GABAA receptors are fluorescently tagged. We mapped YFPγ2 and PSD95CFP puncta distributions on three RGC types at postnatal day P12, shortly before eye opening, and at P21 when robust light responses in RGCs are present. The mature IGABA/E ratios varied among ON-Sustained (S) A-type, OFF-S A-type, and bistratified direction selective (DS) RGCs. These ratios were attained at different rates, before eye-opening for ON-S and OFF-S A-type, and after eye-opening for DS RGCs. At both ages examined, the IGABA/E ratio was uniform across the arbors of the three RGC types. Furthermore, measurements of the distances between neighboring PSD95CFP and YFPγ2 puncta on RGC dendrites indicate that their local relationship is established early in development, and cannot be predicted by random organization. These close spatial associations between glutamatergic and GABAergic postsynaptic sites appear to represent local synaptic arrangements revealed by correlative light and EM reconstructions of a single RGC's dendrites. Thus, although RGC types have different IGABA/E ratios and establish these ratios at separate rates, the local relationship between excitatory and inhibitory inputs appear similarly constrained across the RGC types studied.


Conflict of interest statement

Competing Interests: The authors have declared that no competing interests exist.

Figures

Figure 1
Figure 1. Pattern of YFPγ2 expression in retinas of Thy1-YFPγ2 transgenic mice.
(A) Maximum intensity projections (MIP) of confocal image stacks (2 µm total thickness) of vertical slices of Thy1-YFPγ2 retinas at postnatal day (P)12 and P21. Diffuse fluorescence expression in cell bodies within the ganglion cell layer (GCL) at both ages, and punctate expression throughout both OFF and ON layers of the inner plexiform layer (IPL) are apparent. There was no expression in the outer plexiform layer (OPL) or the outer nuclear layer (ONL) at either age. (B) Images of MIPs (∼20 µm thick) at various depths of a P21 flat mount Thy1-YFPγ2 retina. Inserts are 3× magnification of the images. (C) Western blot of whole brain lysates from Thy1-YFPγ2 (Tg) and wildtype (WT) mice. YFPγ2 (arrowhead) was detected with anti-GABAARγ2 (upper) and anti-GFP (lower).
Figure 2
Figure 2. YFPγ2 fluorescence correlates with immunostaining of inhibitory postsynaptic, but not excitatory postsynaptic sites.
(A, C) Vertical sections from P12 and P21 retinas immunostained with anti-GABAAR α1 raised in different hosts. Upper panels are MIPs of image stacks of 15 µm total thickness. Lower panels show single optical sections (0.3 µm) within the stack at higher magnification. (B, D) (Upper-Left) Normalized fluorescence intensities for GABAAR α1 ∼gp (green) and GABAAR α1 ∼rb (red) are plotted against the vertical (z) depth of the IPL. (Upper-right) The correlation coefficient obtained from the cross-correlation of the two fluorescent channels plotted against depth of the IPL. (Lower panels) 2D cross-correlation plots for the entire depth of the IPL (region between red lines in upper-right). Correlation between the two channels decreases when one channel is shifted in ‘x and y’ (left plot) away from 0,0 or if one channel is rotated 180° (right plot) with respect to the other. (E–H) Cross-correlation analysis was also performed for vertical sections from P12 and P21 Thy1-YFPγ2 retinas immunostained with anti-gephyrin, a protein found at inhibitory postsynaptic sites. (I–L) Similar plots for the excitatory postsynaptic marker, PSD95 at P12 and P21. Strong correlation between Thy1-YFPγ2 fluorescence and inhibitory, but not excitatory, postsynaptic markers is present early in postnatal development. Scale bars 5 µm.
Figure 3
Figure 3. YFPγ2 fluorescence correlates with immunostaining for GABAAR α subunits.
Cross-correlation analysis of vertical sections from P12 and P21 Thy1-YFPγ2 retinas stained with anti-GABAAR α1 (A–D), GABAAR α2 (E–H), or GABAAR α3 (I–L). (M) Image stack of a single ON RGC labeled by transfection of CMV:tdTomato in a Thy1-YFPγ2 retina, immunostained for GABAAR α3. (N) The dendritic label was used to mask out the YFPγ2 and GABAAR α3 fluorescence. (O) (Upper) YFPγ2 and GABAAR α3 puncta within sections of dendritic arbors identified by custom-written software. (Lower) Fraction of the population of YFPγ2 puncta that colocalized with GABAAR α3, and vice-versa (average and SEM of 4 cells). White arrowheads are examples of colocalized puncta, green and red arrowheads, non-colocalized puncta. Scale bars 5 µm.
Figure 4
Figure 4. Distributions of GABAergic and glutamatergic postsynaptic sites on dendritic arbors of distinct types of RGCs.
Biolistic transfection of individual ganglion cells in Thy1-YFPγ2 retinas with a cell label (tdTomato) and excitatory postsynaptic protein (PSD95CFP). (A) Representative flat mount (upper) and vertical (lower) MIPs of three distinct RGC types in P12 Thy1-YFPγ2 retina; ON-S A-type, OFF-S A-type, and bistratified DS RGCs. Inserts are 4x magnifications of a region of the arbor showing PSD95CFP and YFPγ2 found only within the dendrites. (B) MIPs of the reconstructed dendritic skeletons and identified postsynaptic sites from the cells in (A). Inserts represent the same regions as inserts in (A). (C, D) Example MIPs of the raw images of P21 cells (C), their skeletonized dendrites and identified postsynaptic sites (D).
Figure 5
Figure 5. Densities and ratios of GABAergic to glutamatergic postsynaptic sites of three types of RGCs across development.
Linear densities (left axis) and ratio (right axis) of PSD95CFP (white bars) and YFPγ2 puncta (gray bars) on P12 and P21 ON-S A-type cells (A), OFF-S A-type (B) and bistratified DS (C) RGCs. Lines link data points from the same cell. Statistical tests between ages were two sample student's t-test unequal variance, and within ages were two sample paired student's t-test. ***  =  P<0.001, ** =  P<0.01, *  =  P<0.05.
Figure 6
Figure 6. Spatial density heat maps of GABAergic and glutamatergic postsynaptic sites on RGC dendritic arbors.
(A) (Left) Dendritic skeletons of ON-S A-type RGCs at P12 and P21. (Middle) Synaptic density maps were created by convolving a 10 µm disk centered on each pixel of the MIP of the dendritic skeleton puncta linear density [puncta (#)/dendrite (µm)] for YFPγ2 (upper) and PSD95CFP (lower). (Right) Ratio of YFPγ2/ PSD95CFP puncta across ages. (B) YFPγ2/ PSD95CFP ratio plotted against eccentricity (distance from cell body). Each blue line represents a cell, black line is mean and red shading SEM. Analysis of OFF-S A-type RGC is shown in (C, D) and of ON and OFF arbors of bistratified DS RGCs in (E–H).
Figure 7
Figure 7. The nearest neighbor distance between PSD95CFP puncta and their nearest YFPγ2 punctum is established early in development.
(A) Plotted are the median nearest neighbor distances for each PSD95CFP punctum and its nearest neighbor (red box plot), each YFPγ2 punctum and its nearest neighbor (green box plot) and each PSD95CFP punctum and the nearest YFPγ2 punctum (black box plot) for ON-S A-type RGCs at P12 and P21. (B) The nearest neighbor distances calculated from simulating the same densities of PSD95CFP and YFPγ2 puncta from ON-S A-type RGCs randomly distributed over their dendritic arbors. Nearest neighbor analysis was also performed for OFF-S A-type (C–D), and bistratified DS RGCs (E–F). Box plots represent 25 and 75 percentiles. Inserts show cumulative nearest neighbor distributions for P12 (upper) and P21(lower). Dashed lines are individual cells, solid lines represent all cells. (Wilcoxon rank-sum test ***  =  P<0.001).
Figure 8
Figure 8. Correlation of fluorescent labeled GABAergic and glutamatergic postsynaptic sites with ultrastructure.
(A) (Left) MIP of an ON-S A-type RGC labeled by biolistic transfection of tdTomato and PSD95CFP in a Thy1-YFPγ2 retina. Shown here are PSD95CFP and YFPγ2 signal within the dendrites. (Middle) Image showing fiduciary marks burned at the level of the axon and cell body of the labeled RGC using the NIRBing technique . (Right) EM micrograph showing the NIRBed window, allowing identification of the cell (colored blue). (B) MIP of a small section of a primary dendrite from the box in (A, left) showing YFPγ2 (green arrowheads) and PSD95CFP (red arrowheads) signal, and serial EM sections 1–9 of this region. Colored numbers in MIP indicate the serial section in which the corresponding synapse was identified (see green and red asterisks). EM sections are 80 nm thick. (C) Magnified views of bipolar (red) and amacrine (green) cell synapses on the RGC dendrite (blue) in sections (2,9,6). (Left) A cone bipolar cell terminal (red) makes a non-dyad ribbon synapse with the RGC dendrite, where two ribbons appear at the same synaptic site (red asterisk). An inhibitory amacrine cell synaptic profile can also be observed in close proximity (green asterisk). (Middle) A characteristic dyad ribbon synapse (red asterisk) between a cone bipolar cell and the RGC dendrite and an amacrine cell process (green). (Right) A contact between the ganglion cell and a bipolar cell at a plane where the postsynaptic density is evident but the ribbon is not orthogonally aligned. The synapse can be identified by examining the serial profiles in which a partial ribbon is visible (sections 4–7 in B; Movie S1).
Figure 9
Figure 9. PSD95CFP and YFPγ2 puncta on RGC dendrites correspond to sites of bipolar cell and amacrine cell synapses.
(A) ON A-type RGC (gray) with identified PSD95 (red dots) and YFPγ2 (green dots). (B) Higher magnification of the boxed regions 1–3 in (A). (C) Three dimensional reconstructions of serial EM sections showing the locations of amacrine (conventional) and bipolar cell (ribbon) synapses on the reconstructed dendrites (gray). (D) Higher magnification of the boxed regions in (C) showing amacrine (red) and bipolar (green) cell processes apposed to the dendrite. Locations of synapses are marked by the colored dots (red, ribbon; green, conventional). The size of the dot is proportional to the length of the postsynaptic density at the synapse. (E) Table representing the number and correlation of fluorescence and anatomical profiles from the reconstructions.

References

    1. Jia H, Rochefort NL, Chen X, Konnerth A (2010) Dendritic organization of sensory input to cortical neurons in vivo. Nature 464: 1307–1312. - PubMed
    1. Chen X, Leischner U, Rochefort NL, Nelken I, Konnerth A (2011) Functional mapping of single spines in cortical neurons in vivo. Nature. - PubMed
    1. Petreanu L, Mao T, Sternson SM, Svoboda K (2009) The subcellular organization of neocortical excitatory connections. Nature 457: 1142–1145. - PMC - PubMed
    1. Bollmann JH, Engert F (2009) Subcellular topography of visually driven dendritic activity in the vertebrate visual system. Neuron 61: 895–905. - PMC - PubMed
    1. Megias M, Emri ZS, Freund TF, Gulyas AI (2001) Total number and distribution of inhibitory and excitatory synapses on hippocampal CA1 pyramidal cells. Neuroscience 102: 527–540. - PubMed

Publication types

MeSH terms

LinkOut - more resources