. 2013 Jul 29;8(7):e69833.
doi: 10.1371/journal.pone.0069833. Print 2013.

An activating mutation reveals a second binding mode of the integrin α2 I domain to the GFOGER motif in collagens

Affiliations

An activating mutation reveals a second binding mode of the integrin α2 I domain to the GFOGER motif in collagens

Federico Carafoli et al. PLoS One. .

Abstract

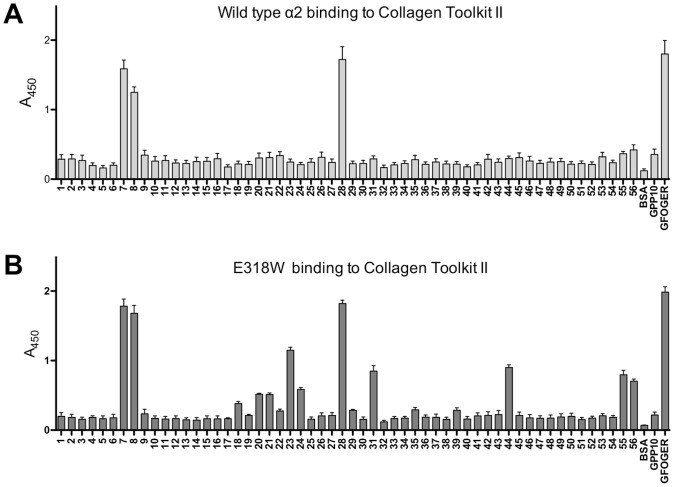
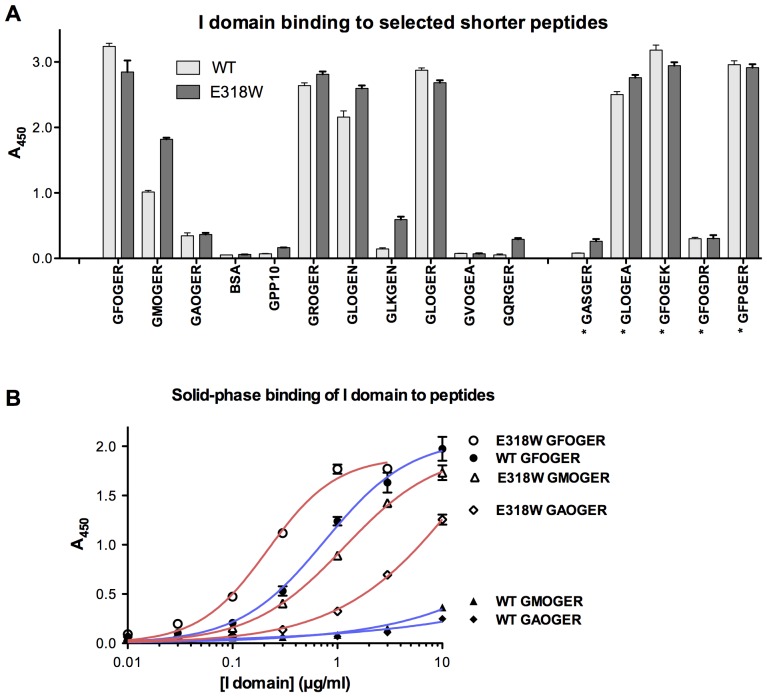
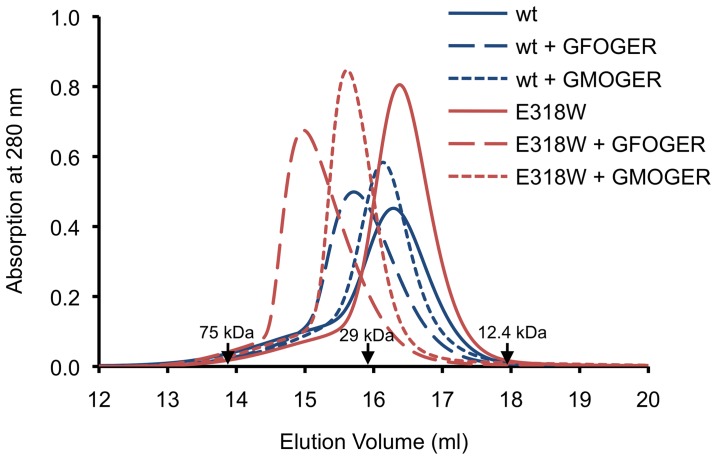
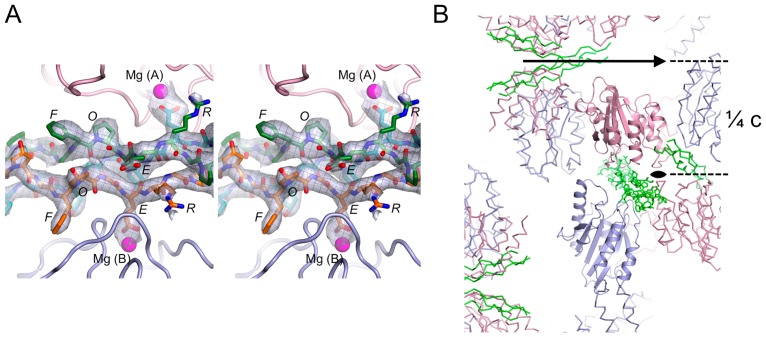
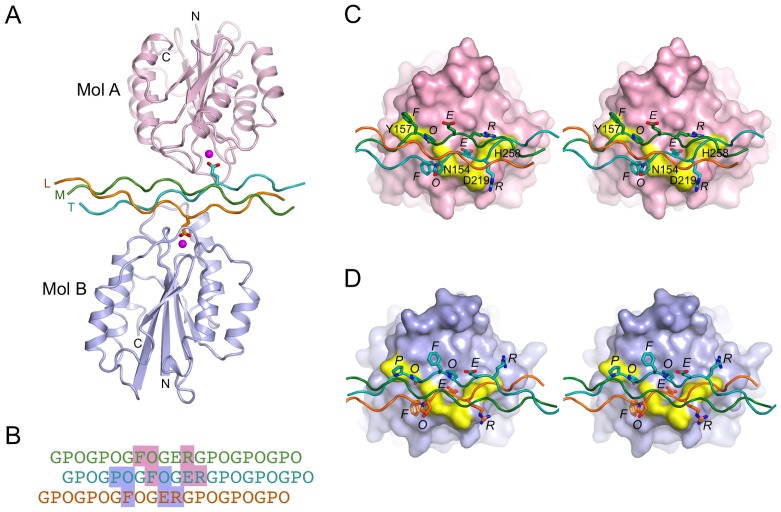
The GFOGER motif in collagens (O denotes hydroxyproline) represents a high-affinity binding site for all collagen-binding integrins. Other GxOGER motifs require integrin activation for maximal binding. The E318W mutant of the integrin α2β1 I domain displays a relaxed collagen specificity, typical of an active state. E318W binds more strongly than the wild-type α2 I domain to GMOGER, and forms a 2:1 complex with a homotrimeric, collagen-like, GFOGER peptide. Crystal structure analysis of this complex reveals two E318W I domains, A and B, bound to a single triple helix. The E318W I domains are virtually identical to the collagen-bound wild-type I domain, suggesting that the E318W mutation activates the I domain by destabilising the unligated conformation. E318W I domain A interacts with two collagen chains similarly to wild-type I domain (high-affinity mode). E318W I domain B makes favourable interactions with only one collagen chain (low-affinity mode). This observation suggests that single GxOGER motifs in the heterotrimeric collagens V and IX may support binding of activated integrins.


Conflict of interest statement

Competing Interests: The authors have declared that no competing interests exist.

Figures

Figure 1
Figure 1. Toolkit II analysis of the integrin α2 I domain E318W mutant.
I domain binding, detected using HRP-linked anti-GST, to immobilised Toolkit II peptides was performed as described in Materials and Methods. BSA, and the triple-helical peptide GPP10 acted as negative controls, and GFOGER as positive control. Mean A450± SEM is shown from n separate experiments, each performed in triplicate. (A) Wild-type α2 I domain (n = 10). (B) α2 I E318W (n = 12).
Figure 2
Figure 2. Binding of the integrin α2 I domain E318W mutant to selected peptides.
(A) Wild-type and E318W α2 I domains were used in binding assays as described in the legend to Fig. 1, with shorter triple-helical peptides as substrates. The sequence of the peptides is indicated on the x-axis, where an asterisk indicates sequences not found in collagens II and III. Six paired experiments were performed, each in triplicate, and data represent mean A450± SEM. (B) Increasing concentrations of wild-type and E318W I domains were applied to GFOGER, GMOGER and GAOGER coatings, and binding was measured as above. Curves shown are the best fit non-linear single-site binding curves, obtained using GraphPad Prism 5 for Mac, of 3 replicates in a single experiment.
Figure 3
Figure 3. Analytical size exclusion chromatography of integrin α2 I domain-collagen complexes.
The complexes were formed by incubating wild-type α2 I and α2 I E318W with the indicated peptides (peptide:I domain ≥2:1) and analysed on a Superdex 200 column. The peptides do not contribute to the absorbance at 280 nm. The elution volumes of three molecular mass standards are indicated by labelled arrows. The molecular mass of α2 I E318W is 25.1 kDa. The masses of the trimeric collagen peptides range from 5.7 to 5.9 kDa. The peaks at 14.9 and 15.6–15.7 ml are interpreted to contain, respectively, I domain-collagen complexes of 2:1 and 1:1 stoichiometry (see text).
Figure 4
Figure 4. Electron density and crystal packing of the α2 I E318W-GFOGER complex.
(A) Stereoview of the OMIT electron density of the collagen peptide. All collagen atoms were deleted from the final coordinate file and the partial structure was refined by simulated annealing to Rfree = 0.37. The map shown is the resulting Fobs-Fcalc map contoured at 2 σ. The final collagen model is superimposed onto the map. The two α2 I E318W molecules are shown in pink (molecule A) and light blue (molecule B). Mg2+ ions are shown as magenta spheres. The collagen peptide is shown in orange (leading chain), green (middle chain) and cyan (trailing chain). The register of the three chains is unambiguously defined by the distinctive electron density of the GFO triplets and the clear absence of imino acids at the GER triplets. (B) Lattice interactions in the α2 I E318W-GFOGER crystal. The two crystallographically independent α2 I E318W molecules are shown in pink (molecule A) and light blue (molecule B), and the collagen peptide is shown in green. One asymmetric unit is shown in cartoon representation. The c-axis of the tetragonal crystals is vertical and the 2-fold axes along the ab-diagonals are indicated.
Figure 5
Figure 5. Crystal structure of the integrin α2 I E318W-GFOGER complex.
(A) Cartoon representation of the asymmetric unit content. The two α2 I E318W molecules are shown in pink (molecule A) and light blue (molecule B). The collagen peptide is shown in orange (L, leading chain), green (M, middle chain) and cyan (T, trailing chain). Mg2+ ions are shown as magenta spheres. The two glutamic acid residues of the GFOGER peptide that are involved in I domain binding are shown as sticks. (B) Sequence of the GFOGER peptide and register of the L (orange), M (green) and T (cyan) chains. The footprint of the two α2 I E318W molecules is indicated by pink and light blue shading (molecules A and B, respectively). (C) Stereoview showing the interactions between α2 I E318W molecule A and the GFOGER peptide. The I domain is shown as a pink surface. The Mg2+ ion is in magenta, and selected residues important for collagen binding are in yellow and labelled. Selected collagen residues are shown as sticks and labelled. (D) Stereoview showing the interactions between α2 I E318W molecule B and the GFOGER peptide. The same colouring is used as in (C) except that the I domain is in light blue.

References

    1. Barczyk M, Carracedo S, Gullberg D (2010) Integrins. Cell Tissue Res 339: 269–280. - PMC - PubMed
    1. Leitinger B (2011) Transmembrane collagen receptors. Annu Rev Cell Dev Biol 27: 265–290. - PubMed
    1. Lee JO, Rieu P, Arnaout MA, Liddington R (1995) Crystal structure of the A domain from the α subunit of integrin CR3 (CD11b/CD18). Cell 80: 631–638. - PubMed
    1. Huang C, Springer TA (1995) A binding interface on the I domain of lymphocyte function-associated antigen-1 (LFA-1) required for specific interaction with intercellular adhesion molecule 1 (ICAM-1). J Biol Chem 270: 19008–19016. - PubMed
    1. Hynes RO (2002) Integrins: bidirectional, allosteric signaling machines. Cell 110: 673–687. - PubMed

Publication types

LinkOut - more resources