. 2013 Jul 29;8(7):e70277.
doi: 10.1371/journal.pone.0070277. Print 2013.

Persistent posttetanic depression at cerebellar parallel fiber to Purkinje cell synapses

Affiliations

Persistent posttetanic depression at cerebellar parallel fiber to Purkinje cell synapses

Astrid Bergerot et al. PLoS One. .

Abstract

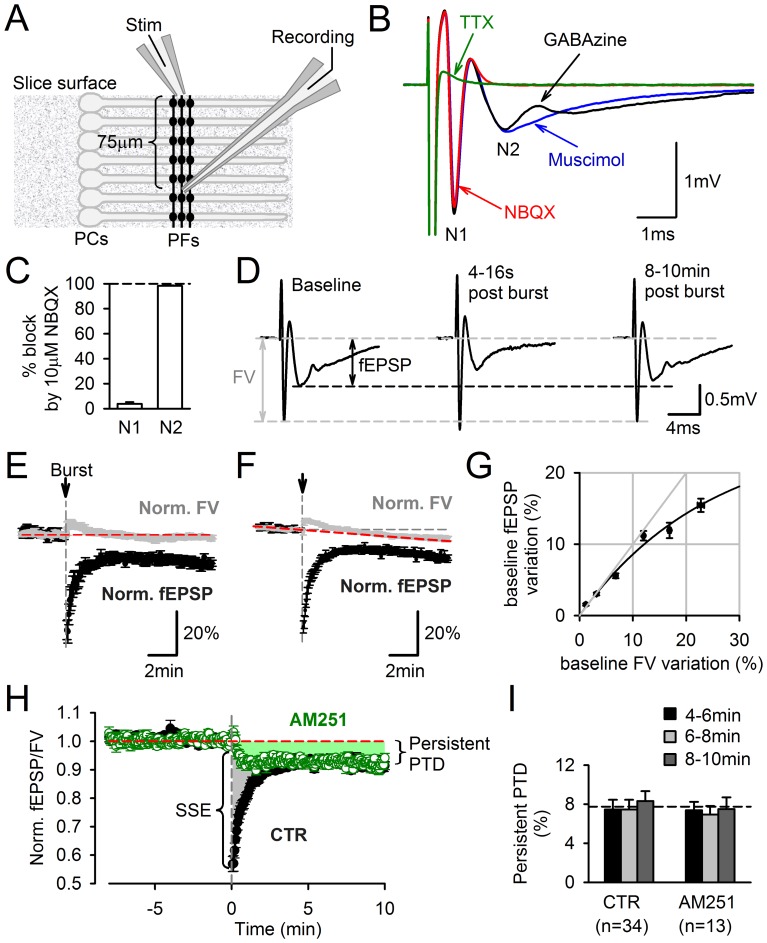
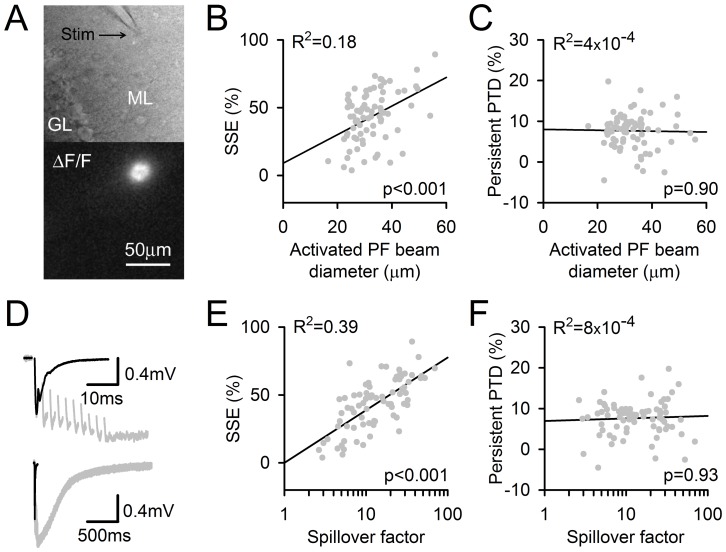
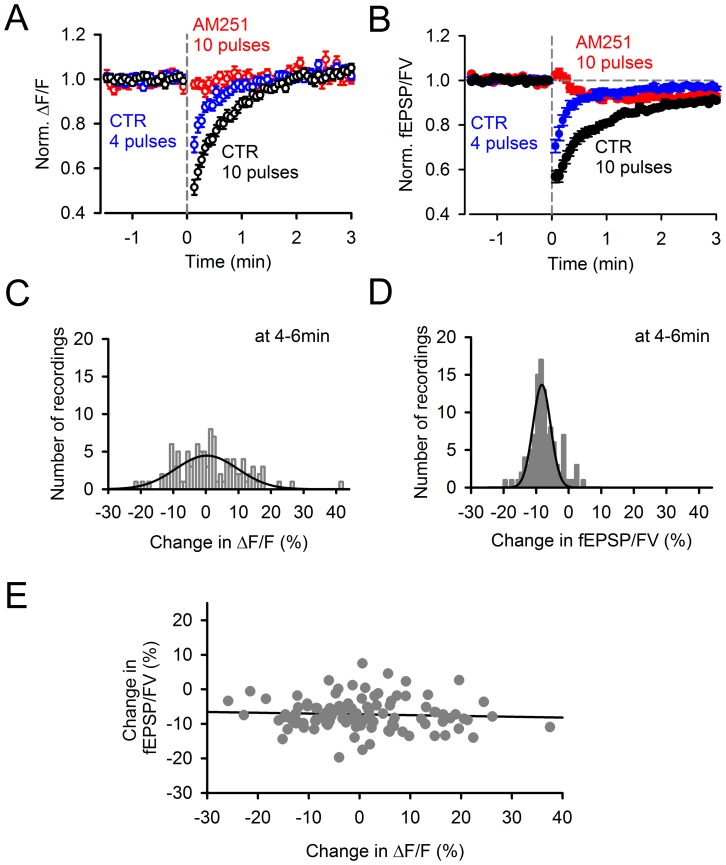
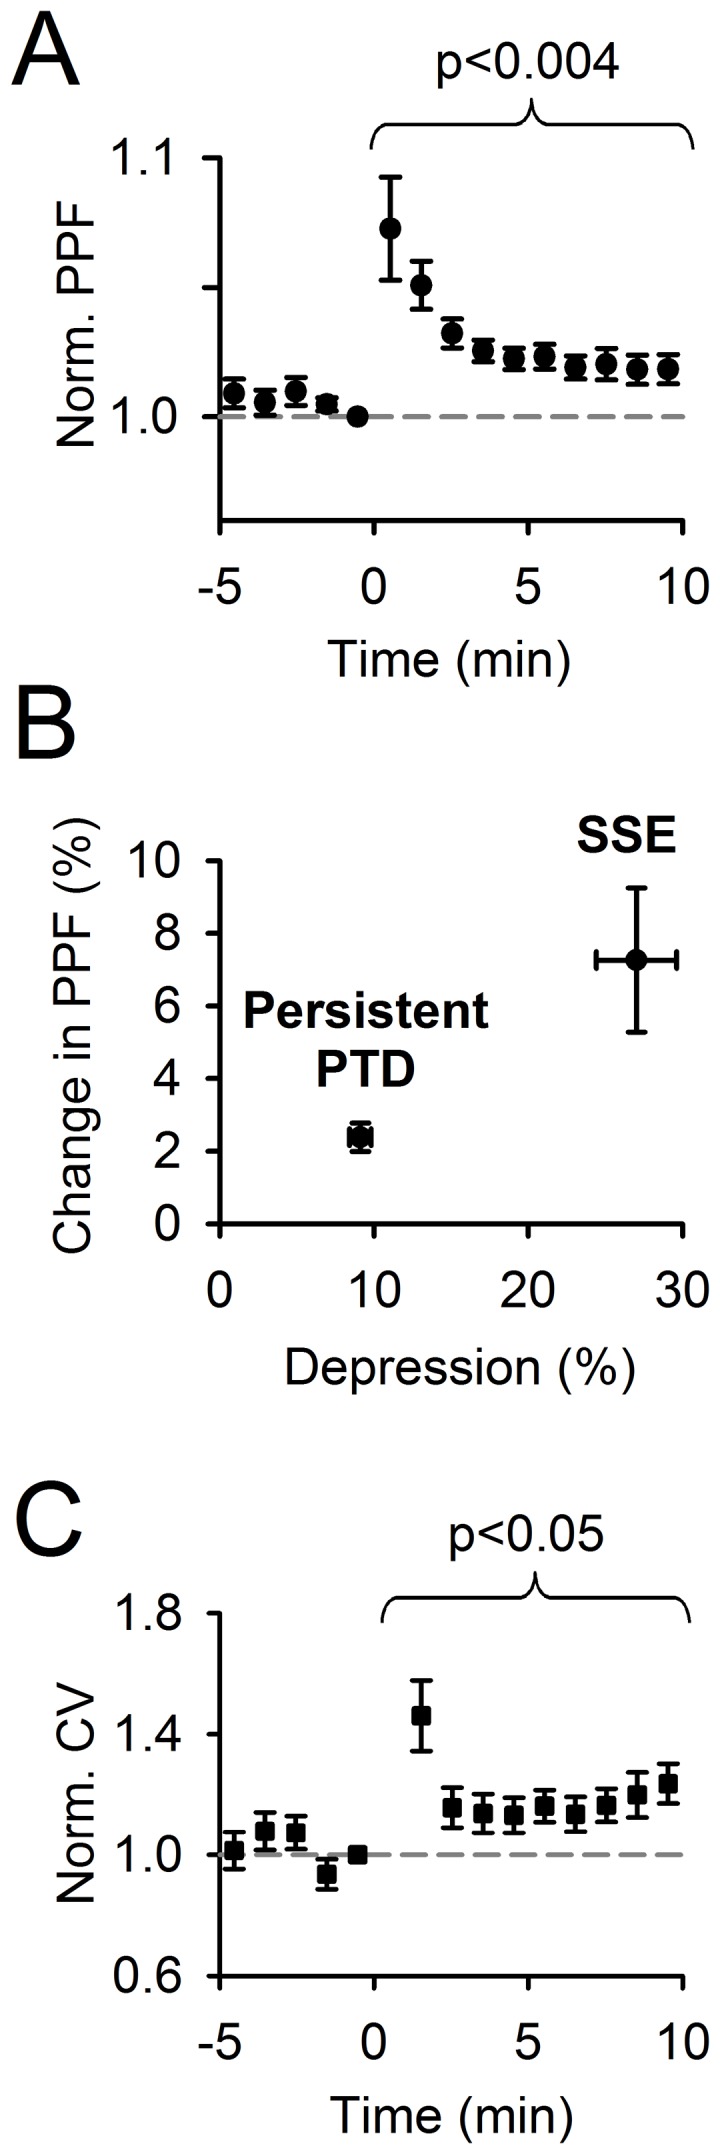
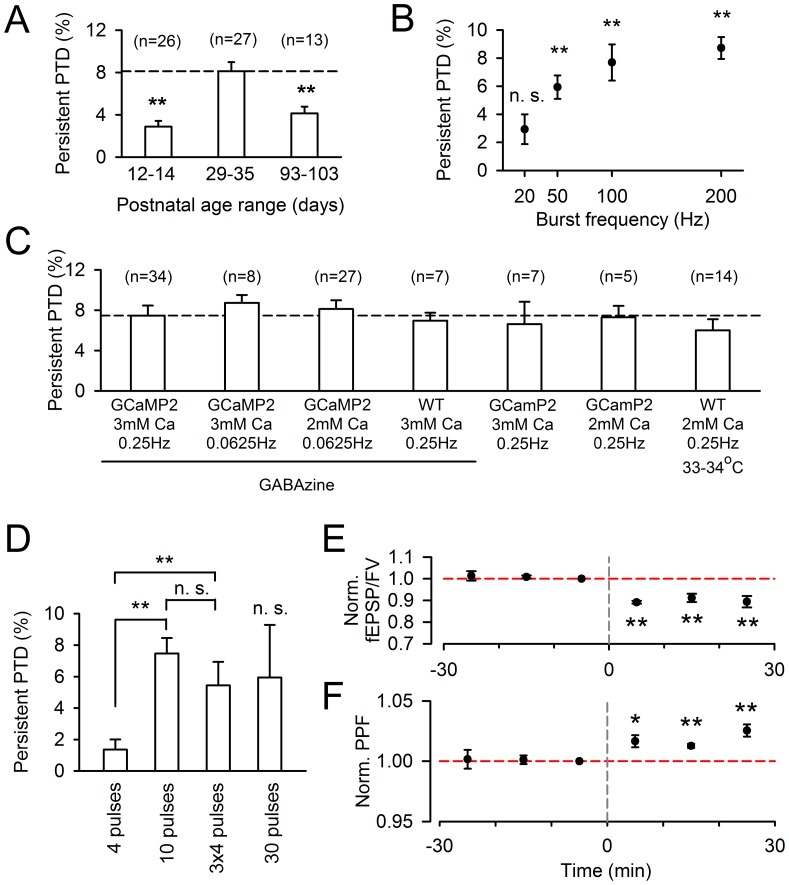
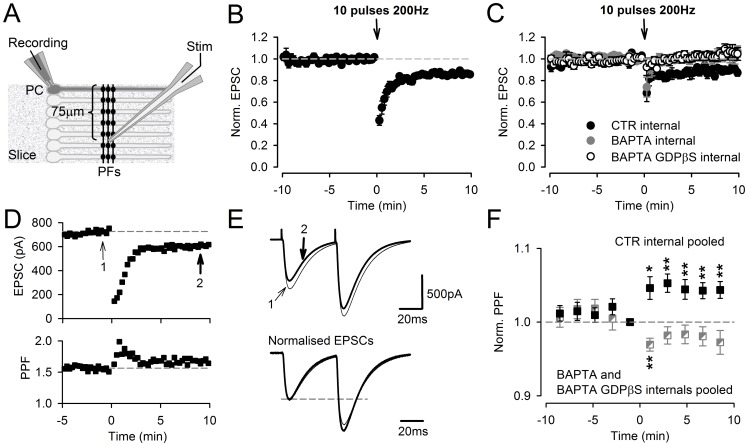
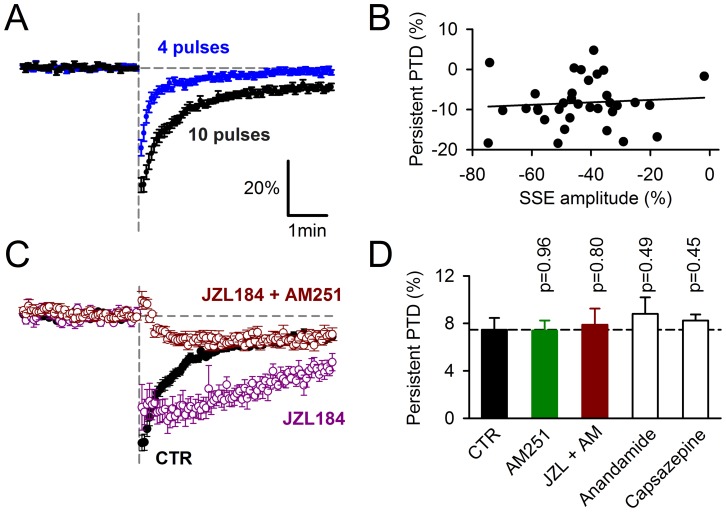
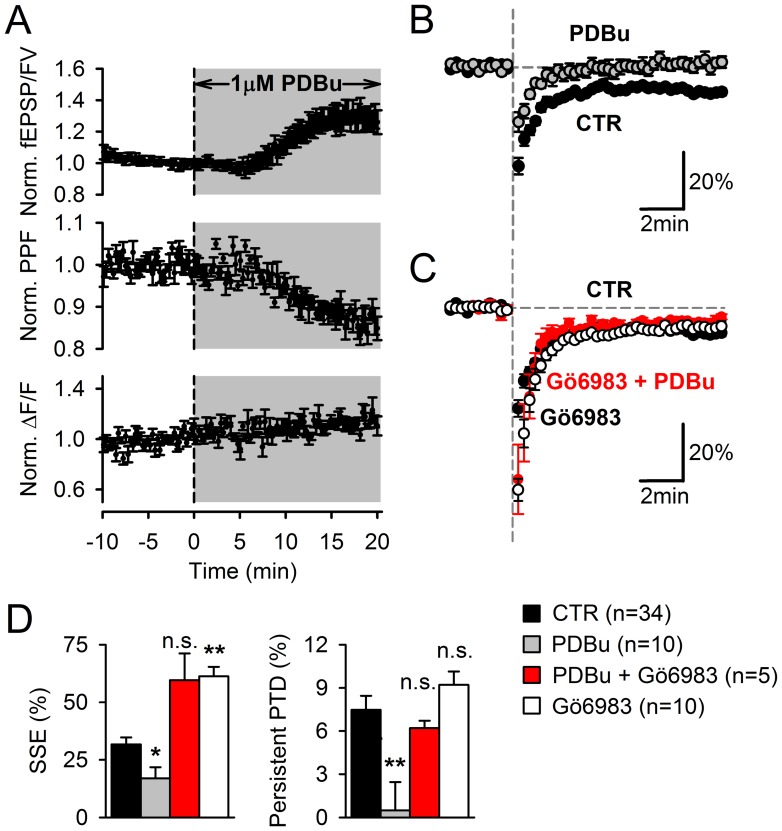
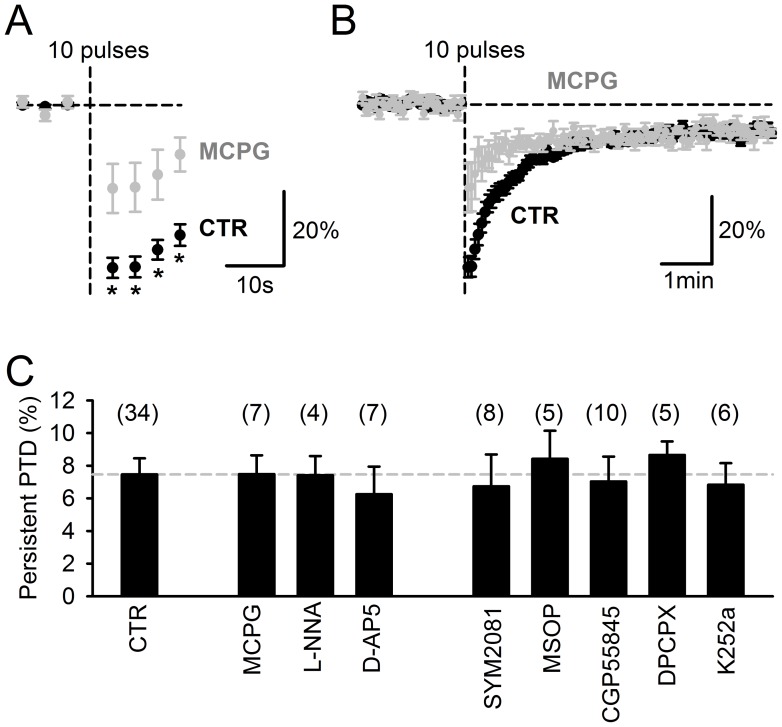
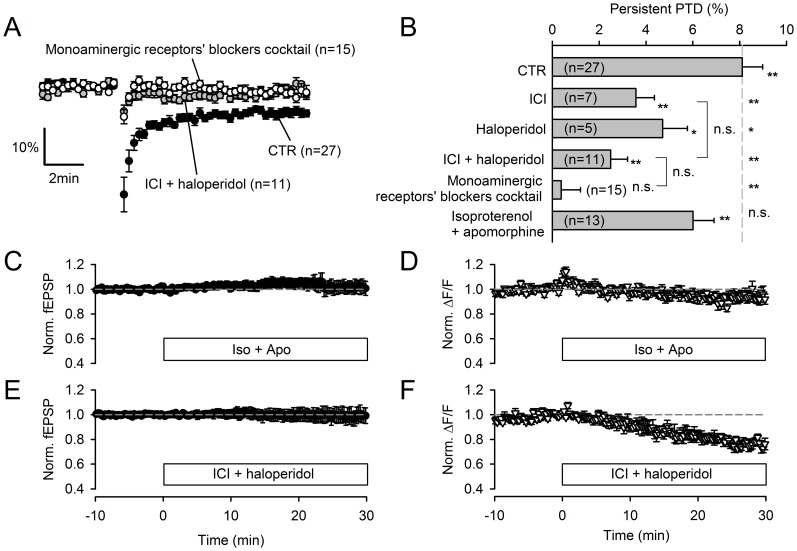
Plasticity at the cerebellar parallel fiber to Purkinje cell synapse may underlie information processing and motor learning. In vivo, parallel fibers appear to fire in short high frequency bursts likely to activate sparsely distributed synapses over the Purkinje cell dendritic tree. Here, we report that short parallel fiber tetanic stimulation evokes a ∼7-15% depression which develops over 2 min and lasts for at least 20 min. In contrast to the concomitantly evoked short-term endocannabinoid-mediated depression, this persistent posttetanic depression (PTD) does not exhibit a dependency on the spatial pattern of synapse activation and is not caused by any detectable change in presynaptic calcium signaling. This persistent PTD is however associated with increased paired-pulse facilitation and coefficient of variation of synaptic responses, suggesting that its expression is presynaptic. The chelation of postsynaptic calcium prevents its induction, suggesting that post- to presynaptic (retrograde) signaling is required. We rule out endocannabinoid signaling since the inhibition of type 1 cannabinoid receptors, monoacylglycerol lipase or vanilloid receptor 1, or incubation with anandamide had no detectable effect. The persistent PTD is maximal in pre-adolescent mice, abolished by adrenergic and dopaminergic receptors block, but unaffected by adrenergic and dopaminergic agonists. Our data unveils a novel form of plasticity at parallel fiber synapses: a persistent PTD induced by physiologically relevant input patterns, age-dependent, and strongly modulated by the monoaminergic system. We further provide evidence supporting that the plasticity mechanism involves retrograde signaling and presynaptic diacylglycerol.


Conflict of interest statement

Competing Interests: The authors have declared that no competing interests exist.

Figures

Figure 1
Figure 1. Persistent PTD evoked by a single burst of PF firing.
A, Schematic diagram of electrode positions in a sagittal cerebellar slice for field potential recording of the PF to PC synaptic transmission. The effect of PF stimulation was recorded extracellularly at least 70 µm vertically below the stimulation electrode. B, Typical field potential evoked by a single PF stimulation. In 10 µM GABAzine (black trace), three negative peaks were resolved. The second negative peak (N2) was abolished in 25 µM NBQX (red trace) and unaltered by the GAGAA agonist muscimol (10 µM). The N2 peak was assimilated to the field excitatory postsynaptic response (fEPSP). The first negative peak (N1), which remained in NBQX and was abolished in 1 µM TTX, was assimilated to the fiber volley (FV), i.e. the field potential associated to the action potential propagation along PFs. C, The N1 and N2 peaks are respectively 96.2±1.4% and 1.7±0.3% of control in 10 µM NBQX (n = 9). D, Effect of a burst of 10 stimuli at 200 Hz on the recorded field potential. Traces from left to right are averaged field potentials evoked by 15 consecutive stimulations for the 2 min before the burst, 4 consecutive stimulations starting 4 s after the burst, and 15 consecutive stimulations starting 8 min after the burst. A depression of the fEPSP is observed 8–10 min after the burst stimulation. This depression was named persistent PTD (see Text). E, Time course of FV (grey) and fEPSP (black) amplitudes normalized to their averaged values for the 2 min preceding the burst. Only recording showing no detectable change in FV amplitude over their duration are plotted (n = 13). F, Same as in E, but including all the recordings exhibiting an averaged change in the FV amplitude of less than 1%/min (n = 34). Although on average the FV decreased by 5.9±0.8% after 10 min, the fEPSP depression was significantly larger (14±0.8%, n = 34, p = 3·10−9). G, Average change in fEPSP amplitude plotted against change in FV amplitude. Data obtained from baseline recordings preceding burst stimulation (n = 34). The relationship between FV and fEPSP is sublinear rather than supralinear. H, The persistent PTD is not CB1 receptor-dependent. Synaptic transmission is plotted as fEPSP/FV normalized to the averaged value during the two minutes preceding the burst stimulation. In control condition (n = 34), the burst evokes an SSE (transient 40% depression, see Text) and a persistent PTD (remaining 8% depression until at least 10 min after burst). Following incubation with 2 µM AM251, the SSE (shaded grey) was abolished while the persistent PTD (shaded green) remained unchanged (n = 13). I, Average persistent PTD amplitude 4–6 min (black), 6–8 min (grey) and 8–10 min (dark grey) following the burst, in control and AM251, showing that steady amplitude is reached after 4 min.
Figure 2
Figure 2. The SSE and the persistent PTD are differentially affected by the input pattern and the amount of glutamate spillover.
A, Image of a beam of activated PFs in a sagittal slice. Top, position of the stimulating electrode in the molecular layer (ML). Bottom, ΔF/F signal arising from GCaMP2 in PFs, following their stimulation. The beam of stimulated PFs was assimilated to a cylinder, the diameter of which was calculated (see Methods). B, The SSE amplitude correlates with the PF beam diameter (p = 0.0004). C, The persistent PTD amplitude does not correlate with the PF beam diameter (p = 0.90). D, Specimen traces illustrating the spillover effects on postsynaptic responses. The fEPSP evoked by one pulse (black line) is superimposed to the fEPSP evoked by a 10-pulse 200 Hz train (grey; FV has been erased for clarity). The two fEPSPs are shown on a longer time scale to show the striking difference in their decay time course (bottom). The prolongation of this decay was used to calculate the spillover factor (see Text; (Marcaggi et al., 2003)). E, The SSE amplitude correlates to the spillover factor (p<2·10−7). F, In striking contrast, the persistent PTD does not correlate with the spillover factor (p = 0.93). R2, the square of the correlation coefficient between the data and their linear regression (black lines) is indicated for each plot. Data were collected from 76 recordings obtained for monitoring frequencies between 0.0625 and 0.25 Hz and lasting for at least 6 min following the 10-pulse burst at 200 Hz.
Figure 3
Figure 3. The persistent PTD is not associated with detectable changes in presynaptic calcium signaling.
A, Effect of a 200 Hz burst on the PF action potential-evoked residual presynaptic calcium transients. Presynaptic calcium transients evoked by double pulse stimulation were recorded as the normalized change in fluorescence (ΔF/F) of GCaMP2 expressed in the axons of granule cells. ΔF/F was reduced during the minute following induction by a train of 10 (n = 34; black) or 4 (n = 35; blue) pulses at 200 Hz. However, no reduction of ΔF/F was observed in 2 µM AM251 (n = 13; red). B, Normalized fEPSP/FV for the same data, on the same expanded time scale for comparison with (A). C, Distribution histogram of the change in ΔF/F 4–6 min after a 10-pulse burst at 200 Hz (n = 107; pooled control and conditions in which neither the persistent PTD nor synaptic transmission were affected). This distribution exhibits a high variability partly due to the low signal-to-noise of the ΔF/F recordings. Gaussian fit peaks at +0.3%. D, Distribution histogram of the change in fEPSP/FV 4–6 min following induction (i.e., the opposite of persistent PTD amplitude) for the same recordings. Gaussian fit peaks at −8.3%. E, Data shown in (D) plotted against data shown in (C). The persistent PTD amplitude does not correlate with ΔF/F (p = 0.6; Spearman Rank correlation).
Figure 4
Figure 4. Data supporting presynaptic expression of the persistent PTD.
A, Averaged change in the paired-pulse facilitation (PPF) of fEPSP/FV (n = 27). B, Averaged change in the PPF 0–1 min (SSE) and 8–10 min (persistent PTD) following induction plotted against averaged percentage depression over the same time ranges. C, Averaged change in coefficient of variation (CV) for the same data set. Actual averaged CV before the induction (at time point −1 min) was 3.0±0.4%.
Figure 5
Figure 5. Conditions determining the observation of the persistent PTD.
A, The persistent PTD is measured in slices from mice of postnatal ages 12–14 (average = 13.1±0.2, n = 26), 29–35 (average = 33.3±0.4, n = 27) and 93–103 (average = 98.4±0.9, n = 13). The persistent PTD is significant at all ages (p<0.02), but the amplitude is doubled for ages in the range of 29–35 (p<0.005). B, Persistent PTD amplitude plotted as a function of the frequency of 10-pulse bursts. 20, 50, 100 and 200 Hz are compared (n = 3, 5, 5 and 8 respectively). On average, the persistent PTD is significant for all frequencies above 50 Hz (p<0.004), but not for 20 Hz (p = 0.11). C, Persistent PTD amplitude plotted for different conditions. The persistent PTD is not dependent on the synaptic transmission monitoring rate, as there is no significant difference between rates 0.25 Hz (n = 34) and 0.0625 Hz (n = 8; p = 0.32), indicating that the persistent PTD is not due to a fatigue of neurotransmission. Initial experiments were done in 3 mM extracellular [Ca2+]. The persistent PTD has identical amplitude in 2 mM extracellular [Ca2+] (n = 27; p = 0.62). The persistent PTD is identical in wild type animals (n = 7; p = 0.69). The persistent PTD is similar in absence of GABAzine (n = 7; p = 0.73) and at a near-physiological temperature (n = 14; p = 0.33). D, Persistent PTD amplitude for different temporal patterns of 200 Hz trains. A 4 pulse train evokes a persistent PTD barely significant (p = 0.05; n = 35) and 6 times smaller than the persistent PTD evoked by a 10-pulse train (p = 3·10−6; n = 34). In comparison, the SSE evoked by a 4 pulse train is only 1.5 times smaller than the SSE evoked by a 10 pulse train (see Fig. 7A). Repeating the 4 pulse-trains 3 times with 100 ms intervals rescues the persistent PTD, which is not significantly different from the one induced by a 10 pulses train (p = 0.27; n = 11). A 30 pulse train led to high variability in the persistent PTD amplitude, which on average was not significant (not different from baseline; p = 0.11, n = 11). E-F, Following a ≥30 min stable baseline, the 10-pulse 200 Hz burst evokes a persistent PTD which lasts for at least 30 min. Averaged fEPSP/FV amplitude (E) and PPF (C) are normalized to the 10 min baseline prior burst stimulation. The change in PPF also appears to last for 30 min (p<0.01; two asterisks).
Figure 6
Figure 6. Patch-clamp recordings, the effect of postsynaptic calcium chelation.
A, Schematic diagram showing the arrangement of the patch-clamped PC and the stimulating electrode. B, SSE and persistent PTD recorded in voltage-clamp mode following a burst of ten stimulations at 200 Hz applied in current-clamp mode. The plot shows the averaged EPSP amplitude normalized to the two minutes baseline preceding the burst (n = 9). Actual averaged EPSC amplitude is 500±63 pA. C, Abolition of the persistent PTD by the chelation of postsynaptic calcium. The burst stimulation was applied at least 40 min following the seal break for complete dialysis of the PC cytosol with intracellular media containing 10 mM EGTA (control; see Methods), 40 mM BAPTA or 40 mM BAPTA and 2 mM GDPβs (filled, grey or open symbols, n = 8, 7 or 9 respectively). Actual averaged EPSC amplitudes are 430±71 pA, 573±140 pA, 539±99 pA, respectively. D, Specimen voltage-clamp recording from a PC where a large EPSC was evoked (larger than the averaged EPSC amplitude which was 467±47 pA over the 17 control recording shown in B, C and F), showing a clear increase in PPF (bottom). E, Double-pulse evoked EPSCs from the same specimen recording, averaged over two minutes before the burst (thin trace; arrow 1 in D) and 8–10 min following the burst (thick trace; arrow 2 in D), are superimposed (top). The same EPSCs are scales relative to the amplitude of the EPSC evoked by the first pulse, illustrating the increase in the PPF plotted in D (bottom). F, Averaged change in PPF following the burst, for recordings obtained with the control internal (pooled data from recordings shown in B and those obtained after 40 min dialysis shown in C, n = 17; filled symbols) and recordings obtained with BAPTA-containing internals (pooled data, n = 16; half filled and grey symbols). One or two asterisks are for p<0.01 and p<0.005 respectively.
Figure 7
Figure 7. The persistent PTD is unaffected by manipulations of endocannabinoid signaling.
A, Comparison of the averaged fEPSP/FV changes induced by 4 pulses (n = 35) or 10 pulses (n = 34) of PF stimulation at 200 Hz. B, Persistent PTD amplitude plotted against the SSE amplitude (10 pulses induction; n = 34). C, Prolongation of SSE in 1 µM JZL184. When 2 µM AM251 is added to JZL184, the remaining persistent PTD is undistinguishable from persistent PTD in AM251 alone (see Fig. 1H). D, Average persistent PTD amplitude in 2 µM AM251 (n = 13), 1 µM JZL184 and 2 µM AM251 (n = 12), 5 µM anandamide (n = 6), 10 µM capsazepine (n = 5).
Figure 8
Figure 8. Modulators of DAG pathway affect the SSE and the persistent PTD differently.
A, Application of 1 µM PDBu increases fEPSP/FV (top) and decreases PPF (middle) consistent with an increase in release probability. This increase in release probability does not appear to be mediated by an increase in presynaptic calcium signaling as indicated by the lack of effect of PDBu on ΔF/F signals arising from GCamP2 in PFs (bottom). B-C, fEPSP/FV is plotted. Vertical dashed grey line indicates stimulation with a 10-pulse burst at 200 Hz. In 1 µM PDBu, the SSE is reduced and the persistent PTD is abolished (n = 10) (B). When PDBu is applied in the presence of 2 µM Gö6983 (pre-incubated for 1 hour), a broad spectrum PKC blocker, the SSE is potentiated and the persistent PTD expression is rescued (n = 5) (C). Gö6983 alone has similar effects (n = 10) (C). D, Average effects of 1 µM PDBu, 1 µM PDBu +2 µM Gö6983 or 2 µM Gö6983 on the SSE or the persistent PTD amplitude. One or two asterisks are for p = 0.02 or p<0.01, respectively, relative to control conditions.
Figure 9
Figure 9. The persistent PTD is unaffected by the block of receptors reported to be required for postsynaptic LTD induction and involved in presynaptic modulation.
A, The SSE is significantly decreased in 1 mM MCPG. The plot shows the average (n = 7) fEPSP/FV normalized to its averaged baseline value 2 min prior the 10-pulse burst. Asterisks are for p<0.02. B, Same plot on a longer time scale, showing that MCPG does not affect the persistent PTD, in contrast to its effect of the SSE. C, Summary bar chart showing the persistent PTD amplitude, 4–6 min following a 10-pulse 200 Hz burst. Blocker concentrations were (µM): MCPG (1000); L-NNA (100); D-AP5 (50); SYM2081 (10); MSOP (200); CGP55845 (5); DPCPX (5); K252a (2). In all conditions, the persistent PTD is significant (p<0.01) and not different from control (p>0.35).
Figure 10
Figure 10. The persistent PTD is modulated by the monoaminergic system.
A, The block of β-adrenergic and dopamine receptors inhibits the persistent PTD expression. In 10 µM ICI-118,551 and 10 µM haloperidol (grey symbols), the SSE and the persistent PTD are strongly reduced in amplitude. Additional block of other monoamine receptors by an additional 7 blockers (1 µM doxasosin, 1 µM asenapine, 10 µM thioperamide, 0.1 µM GR125487, 0.1 µM granisetron, 1 µM yohimbine, 10 µM scopolamine; open symbols) slightly further inhibits (p = 0.07) the persistent PTD (when averaging the 4–6 min time range). B, Average effects of pharmacological manipulations of the monoaminergic system. Both 10 µM ICI-118,551 and 10 µM haloperidol significantly inhibits the persistent PTD amplitude (p = 0.004 and p = 0.02 respectively). In contrast to the effect of blockers, the β-adrenergic and dopamine agonists isoproterenol (10 µM) and apomorphine (10 µM) do not significantly affect the persistent PTD amplitude (p = 0.10). One and two asterisks are for p<0.05 and p<0.01 respectively, compared to baseline or control persistent PTD amplitude. C, Following superfusion with agonists isoproterenol (10 µM) and apomorphine (10 µM), no detectable effect on the fEPSP is detected (n = 6). D, The two agonists induce a transient rise in the ΔF/F signal arising from GCaMP2 in the PFs, suggesting that β-adrenergic and dopamine receptors are not saturated in basal conditions. E, Superfusion with antagonists ICI-118,551 (10 µM) and haloperidol (10 µM) produced no significant effect on the fEPSP amplitude, ruling out the possibility that the block of the persistent PTD (A-B) is due to a direct effect of these antagonists on basal synaptic transmission. F, The two antagonists however induce a steady decrease in ΔF/F, indicating an action on PF calcium signaling.

References

    1. Dean P, Porrill J, Ekerot CF, Jorntell H (2010) The cerebellar microcircuit as an adaptive filter: experimental and computational evidence. Nat Rev Neurosci 11: 30–43. - PubMed
    1. Ito M (2006) Cerebellar circuitry as a neuronal machine. Prog Neurobiol 78: 272–303. - PubMed
    1. Marr D (1969) A theory of cerebellar cortex. J Physiol 202: 437–470. - PMC - PubMed
    1. Ito M, Sakurai M, Tongroach P (1982) Climbing fibre induced depression of both mossy fibre responsiveness and glutamate sensitivity of cerebellar Purkinje cells. J Physiol 324: 113–134. - PMC - PubMed
    1. Bidoret C, Ayon A, Barbour B, Casado M (2009) Presynaptic NR2A-containing NMDA receptors implement a high-pass filter synaptic plasticity rule. Proc Natl Acad Sci U S A 106: 14126–14131. - PMC - PubMed

Publication types

LinkOut - more resources