. 2013 Jul 29;8(7):e70513.
doi: 10.1371/journal.pone.0070513. Print 2013.

Relationship between the magnitude of intraocular pressure during an episode of acute elevation and retinal damage four weeks later in rats

Affiliations

Relationship between the magnitude of intraocular pressure during an episode of acute elevation and retinal damage four weeks later in rats

Bang V Bui et al. PLoS One. .

Abstract

Purpose: To determine relationship between the magnitude of intraocular pressure (IOP) during a fixed-duration episode of acute elevation and the loss of retinal function and structure 4 weeks later in rats.

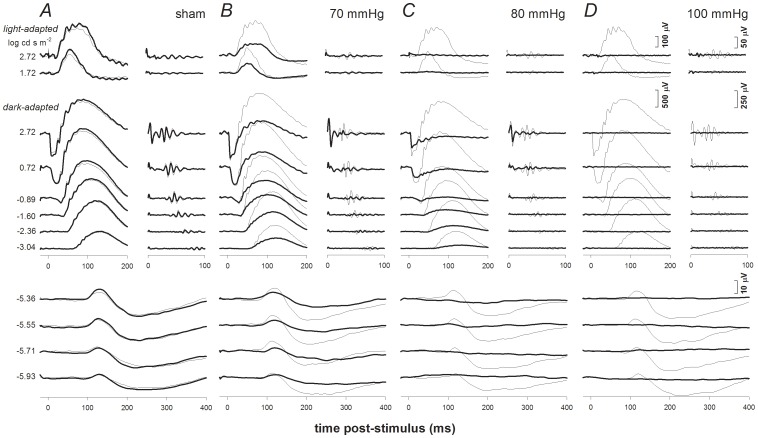
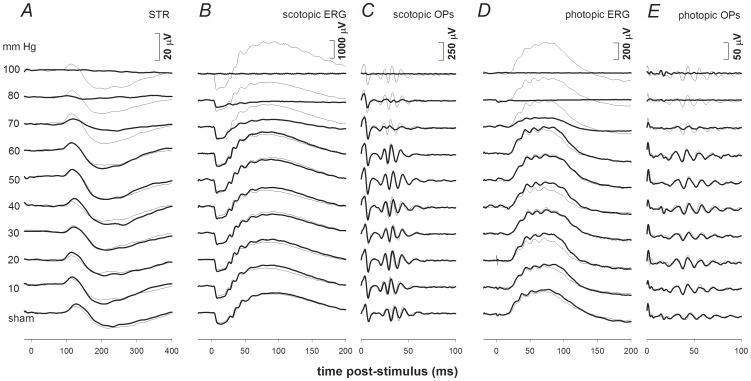
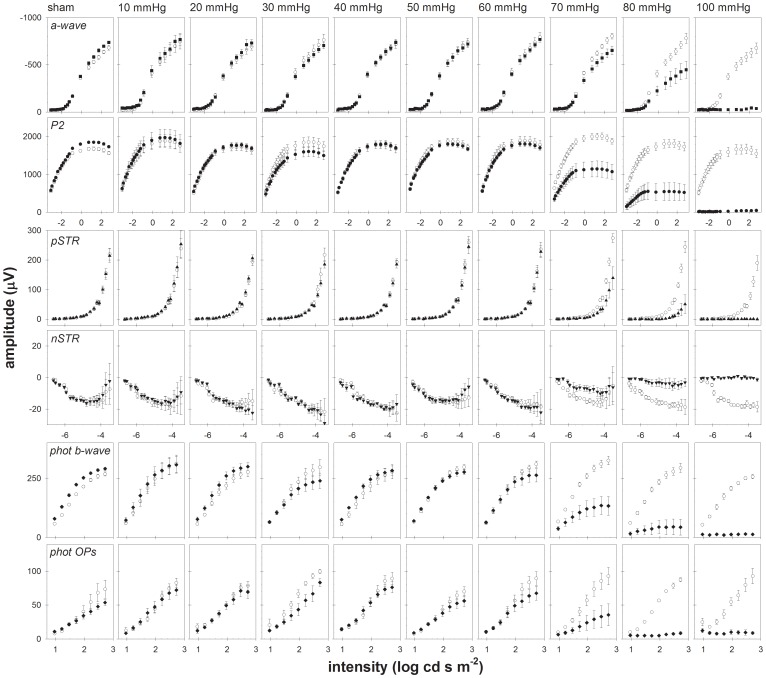
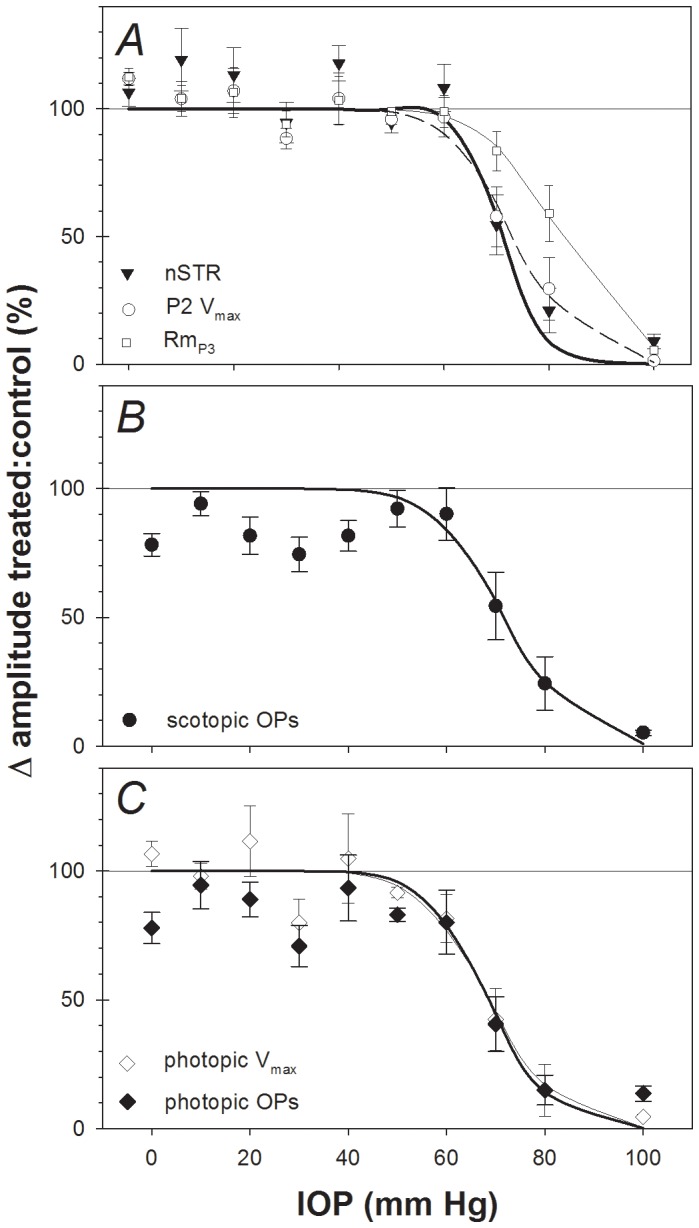
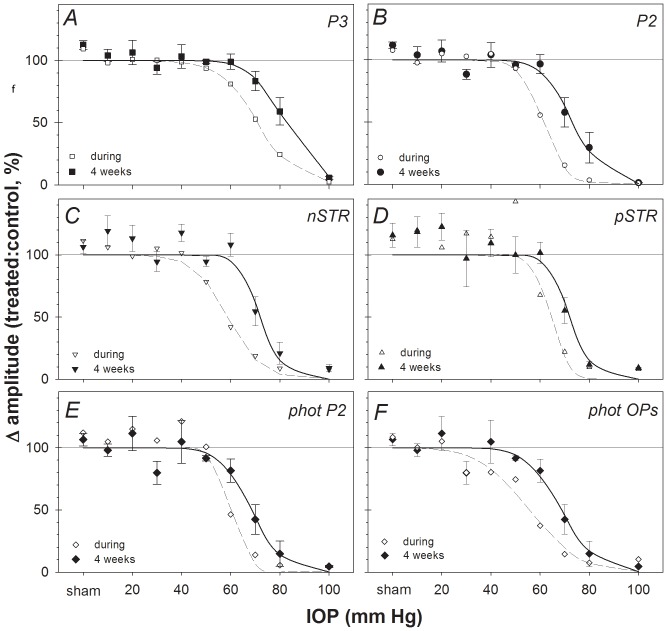
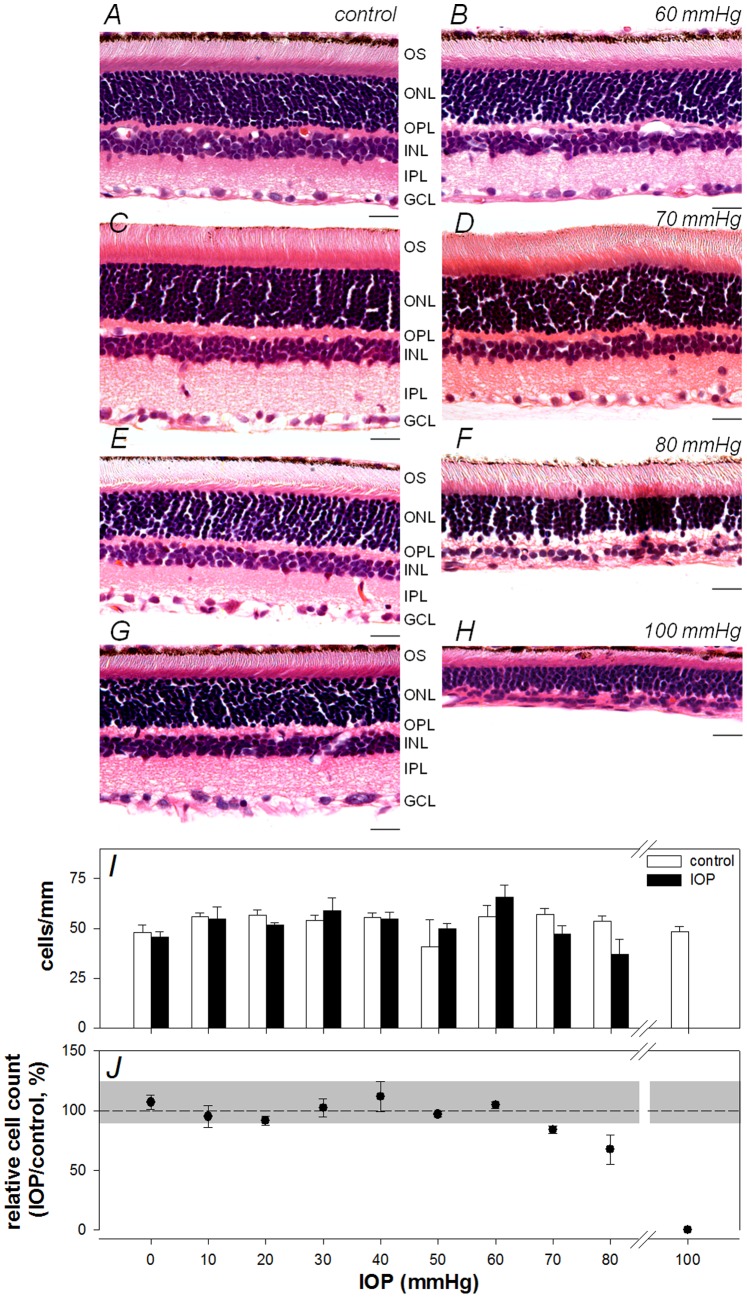
Methods: Unilateral elevation of IOP (105 minutes) was achieved manometrically in adult Brown Norway rats (9 groups; n = 4 to 8 each, 10-100 mm Hg and sham control). Full-field ERGs were recorded simultaneously from treated and control eyes 4 weeks after IOP elevation. Scotopic ERG stimuli were white flashes (-6.04 to 2.72 log cd.s.m(-2)). Photopic ERGs were recorded (1.22 to 2.72 log cd.s.m(-2)) after 15 min of light adaptation (150 cd/m(2)). Relative amplitude (treated/control, %) of ERG components versus IOP was described with a cummulative normal function. Retinal ganglion cell (RGC) layer density was determined post mortem by histology.

Results: All ERG components failed to recover completely normal amplitudes by 4 weeks after the insult if IOP was 70 mmHg or greater during the episode. There was no ERG recovery at all if IOP was 100 mmHg. Outer retinal (photoreceptor) function demonstrated the least sensitivity to prior acute IOP elevation. ERG components reflecting inner retinal function were correlated with post mortem RGC layer density.

Conclusions: Retinal function recovers after IOP normalization, such that it requires a level of acute IOP elevation approximately 10 mmHg higher to cause a pattern of permanent dysfunction similar to that observed during the acute event. There is a 'threshold' for permanent retinal functional loss in the rat at an IOP between 60 and 70 mmHg if sustained for 105 minutes or more.


Conflict of interest statement

Competing Interests: Co-authors Erica L. Fletcher and Bang V. Bui are PLOS ONE Editorial Board members. This does not alter the authors’ adherence to all the PLOS ONE policies on sharing data and materials.

Figures

Figure 1
Figure 1. Representative individual examples of ERG findings 4 weeks after acute IOP elevation for selected groups.
ERG responses for experimental eyes (bold traces) and their fellow control eyes (thin traces) are shown for the following groups: sham (Column A), 70 mmHg (Column B), 80 mmHg (Column C) and 100 mmHg (Column D). Stimulus flash intensities are listed at left for scotopic (below) and photopic (above) responses. Isolated OPs are shown to the right of corresponding waveforms.
Figure 2
Figure 2. Representative ERG findings for experimental eyes (bold traces) 4 weeks after challenge for all IOP levels.
Selected stimulus conditions are shown to emphasize various components of the ERG: scotopic threshold response (STR, −5.55 log cd s m−2, Column A) the scotopic bright flash ERG (2.22 log cd s m−2, Column B) and OPs (Column C), as well as the photopic ERG (2.72 log cd s m−2, Column D) and Ops (Column E). ERG responses for fellow control eyes are shown by the thin traces in each column. IOP levels are indicated on the left.
Figure 3
Figure 3. Recovery of ERG components as a function of stimulus intensity.
Averaged group (± SEM) data for control eyes (unfilled symbols) and experimental eyes (filled symbols).
Figure 4
Figure 4. Relative change across ERG components 4 weeks following acute IOP insult.
(A) nSTR (filled triangles), P2 amplitude (Vmax, open circles) and photoreceptoral amplitude (RmP3, filled squares). For comparison, the corresponding best-fit cumulative normal functions are also plotted in panel A for the nSTR (thin solid curve), P2 (Vmax, dashed curve) and a-wave (RmP3, bold curve). (B) Scotopic OP amplitude. (C) Photopic b-wave amplitude (Vmax, open diamonds) and photopic OP amplitude (filled diamonds). For clarity, the best-fit cumulative normal functions are omitted from panels B and C.
Figure 5
Figure 5. ERG component amplitudes recorded during acute IOP elevation vs.
after 4 weeks recovery. Group mean relative amplitude (ratio of treated/fellow control eyes, %, filled symbols, ± SEM) for (A) a-wave (RmP3, P3), (B) b-wave (Vmax, P2), (C) nSTR, (D) nSTR, (E) Photopic b-wave (Vmax, P2) and (F) photopic OP components 4 weeks following acute IOP elevation for each level of IOP (solid curves represent best-fit cumulative normal functions). For comparison, the relative amplitudes of each component recorded during acute IOP elevation are re-plotted from a previous report (unfilled symbols, dashed curves represent best-fit cumulative normal functions).
Figure 6
Figure 6. The effect of acute IOP elevation on retinal structure.
Representative histological sections for selected IOP levels, 60 mmHg (A: control, B: IOP), 70mmHg (C: control, D: IOP), 80 mmHg (E: control, F: IOP), 100 mmHg (G: control, H: IOP). Scale bar = 20 µm (I) Mean (± SEM) RGC layer density for control (unfilled) and IOP treated eyes (filled) is shown across increasing IOP levels. (J) Relative RGC layer density (treated/fellow control eye, mean ± SEM, %) as a function of IOP. Grey area represents 95% confidence limits for % difference between eyes of the sham group.

References

    1. Goldblum D, Mittag T (2002) Prospects for relevant glaucoma models with retinal ganglion cell damage in the rodent eye. Vision Res 42: 471–478. - PubMed
    1. Libby RT, Anderson MG, Pang IH, Robinson ZH, Savinova OV, et al. (2005) Inherited glaucoma in DBA/2J mice: pertinent disease features for studying the neurodegeneration. Visual Neuroscience 22: 637–648. - PubMed
    1. Pang IH, Clark AF (2007) Rodent models for glaucoma retinopathy and optic neuropathy. J Glaucoma 16: 483–505. - PubMed
    1. Morrison JC, Johnson E, Cepurna WO (2008) Rat models for glaucoma research. Prog Brain Res 173: 285–301. - PubMed
    1. Zhi Z, Cepurna WO, Johnson EC, Morrison JC, Wang RK (2012) Impact of intraocular pressure on changes of blood flow in the retina, choroid, and optic nerve head in rats investigated by optical microangiography. Biomed Opt Express 3: 2220–2233. - PMC - PubMed

Publication types

LinkOut - more resources