. 2013 Jul 26;8(7):e70813.
doi: 10.1371/journal.pone.0070813. Print 2013.

Circadian adaptation to night shift work influences sleep, performance, mood and the autonomic modulation of the heart

Affiliations

Circadian adaptation to night shift work influences sleep, performance, mood and the autonomic modulation of the heart

Philippe Boudreau et al. PLoS One. .

Abstract

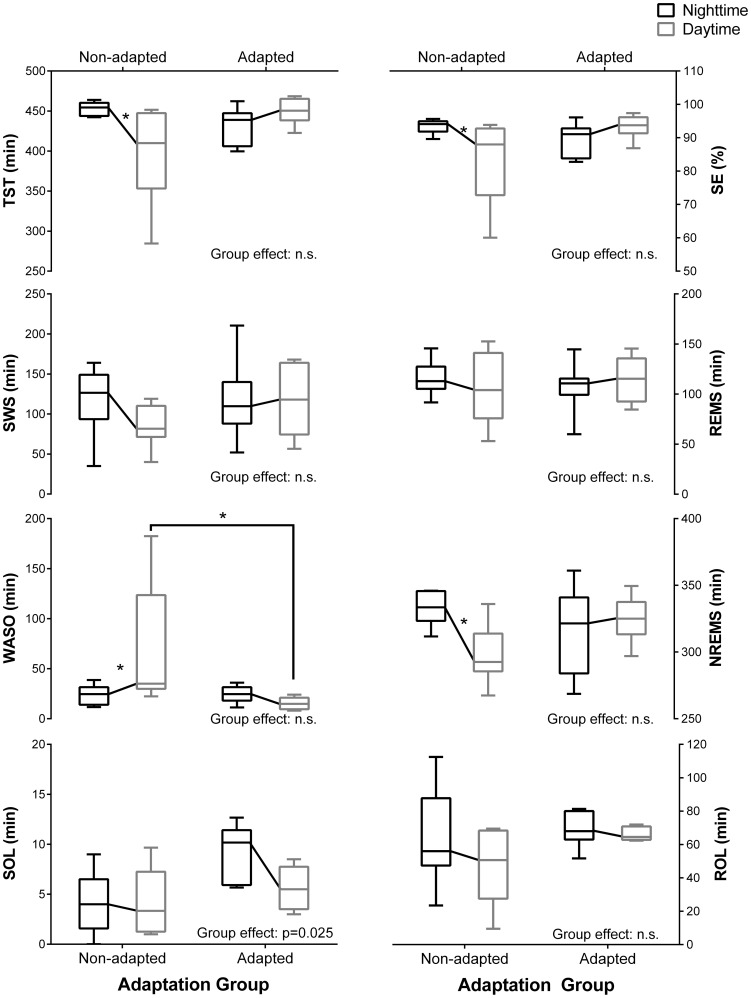
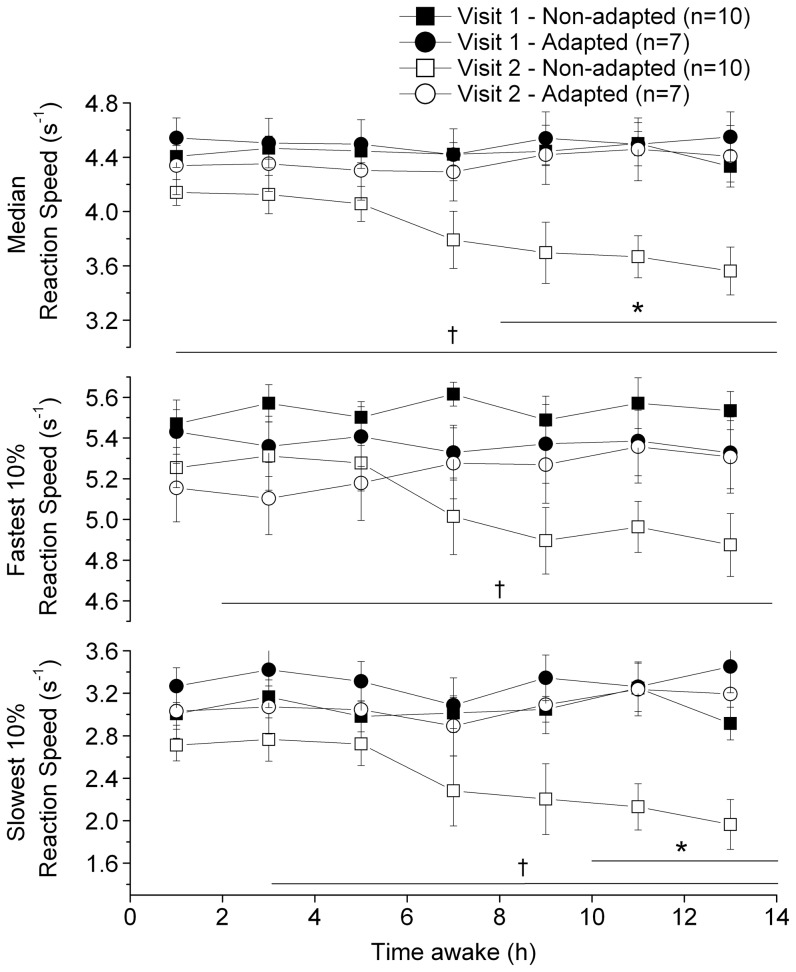
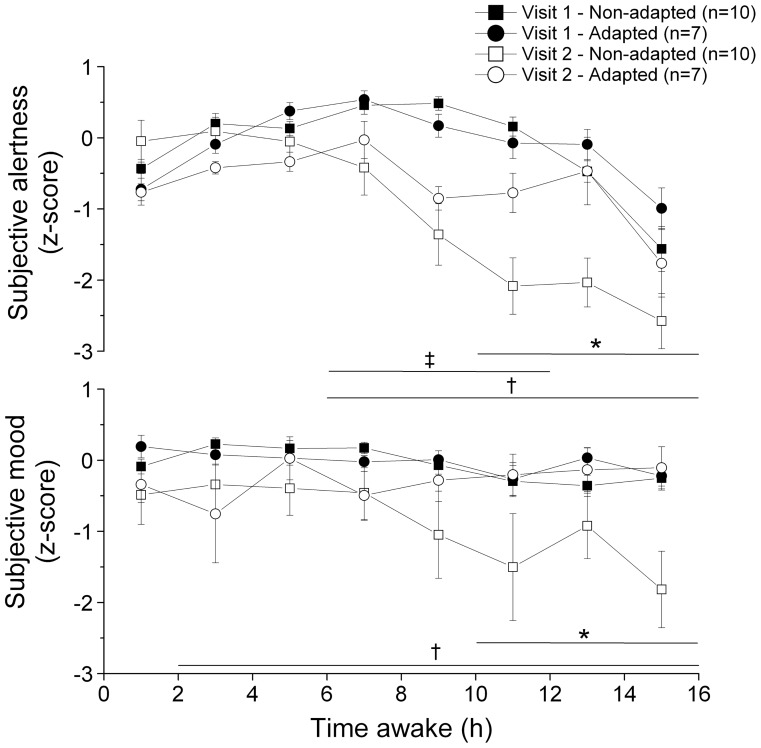
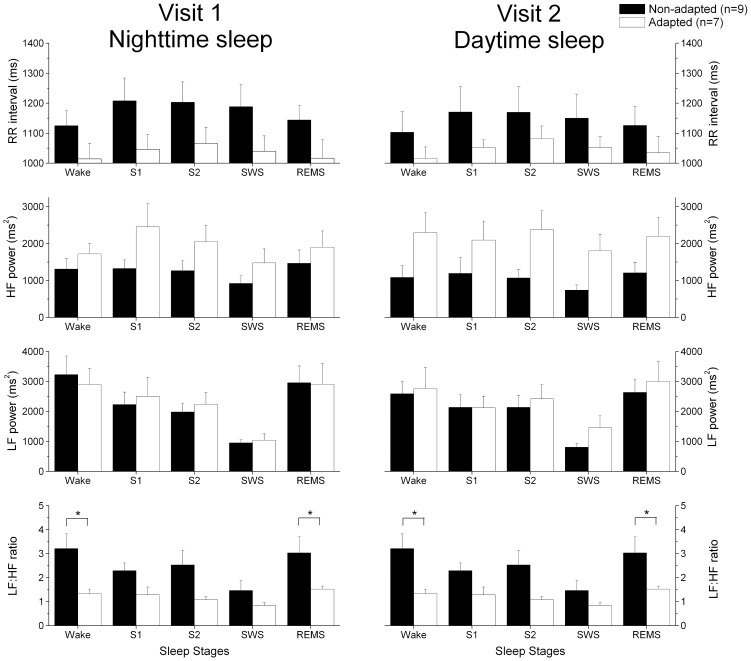
Our aim was to investigate how circadian adaptation to night shift work affects psychomotor performance, sleep, subjective alertness and mood, melatonin levels, and heart rate variability (HRV). Fifteen healthy police officers on patrol working rotating shifts participated to a bright light intervention study with 2 participants studied under two conditions. The participants entered the laboratory for 48 h before and after a series of 7 consecutive night shifts in the field. The nighttime and daytime sleep periods were scheduled during the first and second laboratory visit, respectively. The subjects were considered "adapted" to night shifts if their peak salivary melatonin occurred during their daytime sleep period during the second visit. The sleep duration and quality were comparable between laboratory visits in the adapted group, whereas they were reduced during visit 2 in the non-adapted group. Reaction speed was higher at the end of the waking period during the second laboratory visit in the adapted compared to the non-adapted group. Sleep onset latency (SOL) and subjective mood levels were significantly reduced and the LF∶HF ratio during daytime sleep was significantly increased in the non-adapted group compared to the adapted group. Circadian adaptation to night shift work led to better performance, alertness and mood levels, longer daytime sleep, and lower sympathetic dominance during daytime sleep. These results suggest that the degree of circadian adaptation to night shift work is associated to different health indices. Longitudinal studies are required to investigate long-term clinical implications of circadian misalignment to atypical work schedules.


Conflict of interest statement

Competing Interests: DB Boivin is the founder/CEO of Alpha Logik Consultants Inc. Under this company, she did receive honoraria for lectures, did consultation work, medico-legal expertises. She received travel grants from Servier Canada and a small financial support from Servier Canada for a book launch on sleep for the general public. The other authors have declared that no competing interests exist. This does not alter the authors' adherence to all the PLOS ONE policies on sharing data and materials.

Figures

Figure 1
Figure 1. Experimental protocol, light exposure, and mean expression of salivary melatonin during both laboratory visits.
The panels on the left show the results of the non-adapted group, whereas the panels on the right show the results of the adapted group. The upper panels (A and B) show the experimental protocol and the average sleep times for each adaptation group. The sleep/darkness periods are indicated by black bars, the wake periods in the laboratory are indicated by hatched bars, and the work shifts are indicated by grey bars. Panels C and D illustrate the mean 24-h pattern of light exposure (log transformed) during the ambulatory period. For each adaptation group, the mean night shift work period is illustrated by a light gray box, and the mean day sleep period is illustrated by a dark gray box. Asterisks (*) linked with a horizontal line indicate significantly greater levels of light exposure (p<0.05) in the adapted group compared to the non-adapted group during the night shift. Panels E and F illustrate the mean salivary melatonin rhythm in the non-adapted group (square symbols) and adapted group (circle symbols) during laboratory visit 1 (filled symbols, solid lines) and laboratory visit 2 (open symbols, dashed lines). For each adaptation group, the mean day and night sleep periods in the laboratory are illustrated by dark gray boxes. The mean acrophases were averaged across the adaptation groups and laboratory visits and are illustrated by inverted triangles. The mean melatonin level was averaged across adaptation groups for each laboratory visit based on clock time. To facilitate visualization, all panels are double plotted, and in panels C to F, the night shift work and sleep periods were only added for the second 24 hours. All values are means ± SEM.
Figure 2
Figure 2. Variation in the PSG sleep measurements during nighttime and daytime sleep (laboratory visits 1 and 2) in both adaptation groups.
Nighttime (black boxes) and daytime (grey boxes) sleep measurements are illustrated by boxplots. The bottom and top of each box are the first and third quartiles of each group, respectively, and the band inside each box is the median. The top and bottom whiskers illustrate the 5th and 95th percentile, respectively, for each group. TST: total sleep time; SE: sleep efficiency; SWS: slow wave sleep; REMS: rapid eye movement sleep; WASO: wake after sleep onset; NREMS: non-REM sleep; SOL: sleep onset latency; ROL: REMS onset latency. The PSG sleep measurements were compared using a linear mixed effect model with visit and adaptation group as factors. Asterisks (*) indicates a significant difference (p<0.05) between laboratory visits or between groups.
Figure 3
Figure 3. PVT performances as a function of time awake during laboratory visits 1 and 2 in both adaptation groups.
The results of the non-adapted group (square symbols) and adapted group (circle symbols) obtained during laboratory visit 1 (filled symbols) and laboratory visit 2 (open symbols) are illustrated. The top, middle, and bottom panels illustrate the median reaction speed, fastest 10% reaction speed, and slowest 10% reaction speed, respectively. A linear mixed effect model with time awake, laboratory visit and adaptation group as factors was used to compare the PVT measurements. The time periods during which this model revealed significant differences are illustrated by horizontal lines. Asterisks (*) linked with a horizontal line indicate slower reaction speed (p<0.05) in the non-adapted group compared to the adapted group during laboratory visit 2. † linked with a horizontal line indicate a significant reduction (p<0.05) in the performance measurements between laboratory visits in the non-adapted group. No such difference was observed in the adapted group. For illustrative purposes, the reaction speeds were binned every 2 h and the results are illustrated as means ± SEM at mid-bin.
Figure 4
Figure 4. Subjective alertness (upper panel) and subjective mood (lower panel) levels with time awake during laboratory visits 1 (filled symbols) and 2 (open symbols) in the adapted (circles) and non-adapted (squares) groups.
Higher values indicate higher scores. A linear mixed effect model with time awake, sleep time and adaptation group as factors was used to compare the subjective alertness and mood levels. The time periods during which this model revealed significant differences are illustrated by horizontal lines. Asterisks (*) linked with a horizontal line indicate lower alertness or mood levels in the non-adapted group compared to the adapted group during laboratory visit 2. † linked with a horizontal line indicate significant differences (p<0.05) in subjective alertness or mood between laboratory visits in the non-adapted group. ‡ linked with and a horizontal line indicates a significant difference between visits in the adapted group. For illustrative purposes, the alertness and mood z-scores were binned every 2 h and the results are illustrated as means ± SEM at mid-bin.
Figure 5
Figure 5. Variation in the consecutive RR intervals, HF power, LF power and LF∶HF ratio during nighttime (visit 1) and daytime (visit 2) sleep.
Wake: wake from lights out to lights on; S1: stage 1 sleep; S2: stage 2 sleep; SWS: slow wave sleep; REMS: rapid eye movement sleep. A linear mixed effect model was applied to the data for each subject using the mixed SAS procedure. We used 3 comparison factors: adaptation group, laboratory visit, and sleep stages. A significant main effect of sleep stage was observed for all HRV parameters (p≤0.004). There was a trend for the HF power to be increased in the adapted group compared to the non-adapted group (p = 0.07). A significant adaptation group×sleep stages interaction was also observed (p = 0.01). Asterisks (*) indicate a significant differences between the adaptation groups (p<0.05). All values are means ± SEM.

References

    1. Alterman T, Luckhaupt SE, Dahlhamer JM, Ward BW, Calvert GM (2012) Prevalence rates of work organization characteristics among workers in the U.S.: Data from the 2010 National Health Interview Survey. Am J Ind Med - PMC - PubMed
    1. Eurofound (2012) Fifth European Working Conditions Survey. Luxembourg.
    1. Boivin DB, Boudreau P, James FO, Kin NM (2012) Photic resetting in night-shift work: impact on nurses' sleep. Chronobiol Int 29: 619–628. - PubMed
    1. Ferguson SA, Baker AA, Lamond N, Kennaway DJ, Dawson D (2010) Sleep in a live-in mining operation: The influence of start times and restricted non-work activities. Appl Ergon - PubMed
    1. Garde AH, Hansen AM, Hansen J (2009) Sleep length and quality, sleepiness and urinary melatonin among healthy Danish nurses with shift work during work and leisure time. Int Arch Occup Environ Health 82: 1219–1228. - PubMed

Publication types