. 2013 Jul 29;8(7):e70863.
doi: 10.1371/journal.pone.0070863. Print 2013.

Abundant intracellular IgG in enterocytes and endoderm lacking FcRn

Affiliations

Abundant intracellular IgG in enterocytes and endoderm lacking FcRn

Sudhasri Mohanty et al. PLoS One. .

Abstract

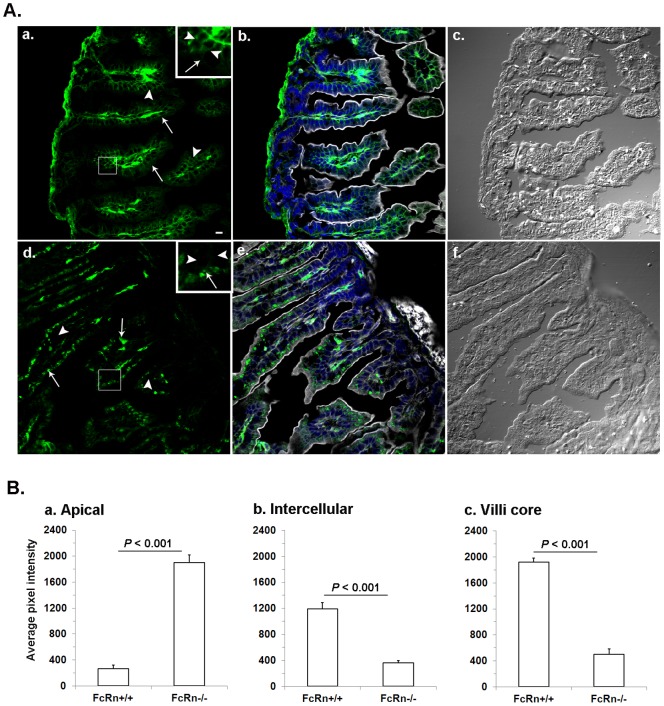
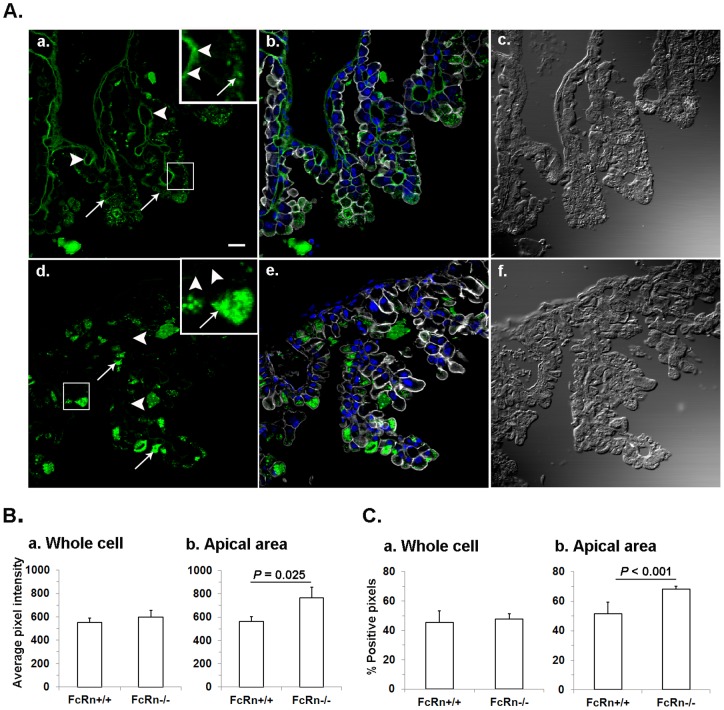
FcRn, a non-classical MHCI molecule, transports IgG from mother to young and regulates the rate of IgG degradation throughout life. Brambell proposed a mechanism that unified these two functions, saying that IgG was pinocytosed nonspecifically by the cell into an FcRn-expressing endosome, where, at low pH, it bound to FcRn and was exocytosed. This theory was immediately challenged by claims that FcRn specificity for ligand could be conferred at the cell surface in neonatal jejunum. Assessing Brambell's hypothesis we found abundant nonspecifically endocytosed IgG present in the cytoplasm of FcRn(-/-) enterocytes. Further, IgG was present in the intercellular clefts and the cores of FcRn(+/+) but not FcRn(-/-) jejunum. FcRn specificity for ligand could be determined within the cell.


Conflict of interest statement

Competing Interests: The authors have declared that no competing interests exist.

Figures

Figure 1
Figure 1. Cartoon of cells illustrating how regions of interest were drawn.
Solid black lines represent cell margins. Dashed black lines represent nucleus (N) border. Red lines denote regions of interest, either within or between the red lines. Arrows point toward lumen. Schemes for quantifying both FcRn (A) and IgG (B) are shown. Details are in text, in Quantitation Method of the Materials and Methods.
Figure 2
Figure 2. FcRn expression along the linear length of neonatal intestine.
A. An immunoblot using rabbit anti-rat FcRn antibody shows FcRn expression along a 7 cm length of neonatal intestine cut into 1 cm pieces from pylorus through duodenum and into jejunum, comparing tissue lysates from FcRn+/+ and FcRn−/− strains. Numbers at left margin shown are MW markers in kDa. The top arrow at right margin indicates two prominent native FcRn proteins in gut, and the bottom arrow indicates recombinant FcRn protein, soluble mouse (sm) FcRn. Arrowheads mark top and bottom of the gel. Figure is representative of 3 immunoblots. B. Bar graph expressing the means and standard deviations of immunoblot-derived band densities for FcRn expression in cm 1 thru cm 7 intestinal pieces from FcRn+/+ and FcRn−/− strain tissues (n = 3 FcRn+/+ and 3 FcRn−/− mice). The P values shown on bar graphs indicate that FcRn expression only in cm 4 and cm 5 of the intestine from FcRn+/+ strains was statistically significantly greater than in the FcRn−/− tissues.
Figure 3
Figure 3. Specificity of hamster anti-mFcRn antibody in IF assay.
Photomicrographs illustrating gut sections from FcRn+/+ (a, b, c) and FcRn−/− (d, e, f) strain neonates labeled to visualize FcRn (red) with Armenian hamster anti-mouse FcRn antibody. The phalloidin (gray) and DAPI (blue) labeling were used to mark cell boundaries and nucleus, respectively, shown in b and e. For orientation DIC images in c and f are shown. The bar = 10 µm. See the complete lack of FcRn labeling in FcRn−/− tissues (d) treated in parallel and in identical manner with FcRn+/+ tissues.
Figure 4
Figure 4. FcRn (red) distribution patterns in gut enterocytes and YS endoderm.
Photomicrographs illustrating gut sections from FcRn+/+ neonates (a, b, c) and YS from FcRn+/+ tissues (d, e, f) are shown. The phalloidin (gray) and DAPI (blue) labeling were used to mark the cell boundaries and nucleus, respectively. For orientation DIC images in c and f are shown. Solid arrows point basilar and arrow heads point apical margins of the cells. The bar = 10 µm.
Figure 5
Figure 5. A comparison of IgG distribution between FcRn+/+ and FcRn−/− neonatal gut.
A. Photomicrographs illustrating gut sections from FcRn+/+ (a, b, c) and FcRn−/− (d, e, f) neonates labeled to visualize IgG (green) with goat anti-mouse IgG heavy chain Fc antibody. The phalloidin (gray) and DAPI (blue) labeling were used to mark cell boundaries and nucleus, respectively, as shown in b and e. For orientation DIC images in c and f are shown. The bar = 10 µm. The insets of a and b contain a higher magnified view of an outlined area of FcRn+/+ and FcRn−/− neonatal gut villi, respectively. The arrow heads point to the dense green labeling in intercellular areas of FcRn+/+ enterocytes and lack of it in FcRn−/−. The presence or lack, respectively, of dense green blobs in FcRn−/− and FcRn+/+ apical areas is marked by a solid arrow. B. Quantitative analyses of IgG in apical, intercellular and core villi areas are shown. Fluorescence images such as shown in panel A (a and c) were collected on a confocal microscope. The images were quantified, averaged for 300 cells, and the average intensity plus or minus standard deviations was plotted for each strain (n = 3 FcRn+/+ and 3 FcRn−/− mice). a. The FcRn−/− apical area filled with green structures measured to be ∼7 times more intense than FcRn+/+ areas. b. The intercellular IgG in FcRn+/+ is ∼3 times more intense than FcRn−/− intercellular areas. c. IgG in the FcRn+/+ jejunum villi core is ∼4 times more intense than the FcRn−/− villi core areas.
Figure 6
Figure 6. Comparison of distribution of IgG between FcRn+/+ and FcRn−/− YS endoderm.
A. Photomicrographs illustrating YS sections from FcRn+/+ (a, b, c) and FcRn−/− (d, e, f) YS labeled to visualize IgG (green) as was done in Fig. 5. The phalloidin (gray) and DAPI (blue) labeling were used to mark cell boundaries and nucleus, respectively, shown in b and e. For orientation DIC images in c and f are shown. The solid arrows and arrow heads point to IgG in apical endoderm and mesenchyme, respectively. The bar = 10 µm. The inset of a and b, containing a higher magnified view of an outlined area of FcRn+/+ and FcRn−/− yolk sac are shown. The solid arrows and arrow heads, respectively, point to IgG in apical and in mesenchyme areas in FcRn+/+. The lack of IgG in FcRn−/− mesenchyme and the presence of dense blobs in apical areas are shown by arrow heads and solid arrows respectively. B. Quantitative comparison of IgG (average intensity) between FcRn+/+ and FcRn−/− in whole cell and apical areas of ED. Fluorescence images such as shown in panel A (a and c) were collected on a confocal microscope. The images were quantified, averaged for 300 cells, and plotted as average intensity for each strain (n = 3 FcRn+/+ or 3 FcRn−/− mice). a. The image shows that total IgG in FcRn−/− is slightly higher but not statistically different than FcRn+/+ (P = 0.681). b. The image shows that IgG is more intense in FcRn−/−apical areas than in FcRn+/+. C. Number of pixels positive for IgG signal was quantified. Fluorescent images were converted to binary images and then used for quantifying the percent positive pixels. a. A difference could not be found in the percent of pixels positive for IgG in whole cell of FcRn+/+ and FcRn−/− were almost equal (P = 0.554). b. Percent positive pixels in FcRn−/− apical portion was significantly higher than in FcRn+/+.

References

    1. Brambell FWR (1966) The transmission of immunity from mother to young and catabolism of immunoglobulins. Lancet ii: 1087–1093. - PubMed
    1. Brambell FWR (1970) The Transmission of Passive Immunity from Mother to Young. Amsterdam: North Holland Publishing Company. 385 p.
    1. Simister NE, Mostov KE (1989) An Fc receptor structurally related to MHC class I antigens. Nature. 337: 184–187. - PubMed
    1. Ahouse JJ, Hagerman CL, Mittal P, Gilbert DJ, Copeland NG, et al. (1993) Mouse MHC class I-like Fc receptor encoded outside the MHC. J Immunol. 151: 6076–6088. - PubMed
    1. Burmeister WP, Gastinel LN, Simister NE, Blum ML, Bjorkman PJ (1994) Crystal structure at 2.2 Å resolution of the MHC-related neonatal Fc receptor. Nature. 372: 336–343. - PubMed

Publication types

MeSH terms