. 2013 Jul 29;8(7):e71014.
doi: 10.1371/journal.pone.0071014. Print 2013.

ß-blocker timolol prevents arrhythmogenic Ca²⁺ release and normalizes Ca²⁺ and Zn²⁺ dyshomeostasis in hyperglycemic rat heart

Affiliations

ß-blocker timolol prevents arrhythmogenic Ca²⁺ release and normalizes Ca²⁺ and Zn²⁺ dyshomeostasis in hyperglycemic rat heart

Erkan Tuncay et al. PLoS One. .

Abstract

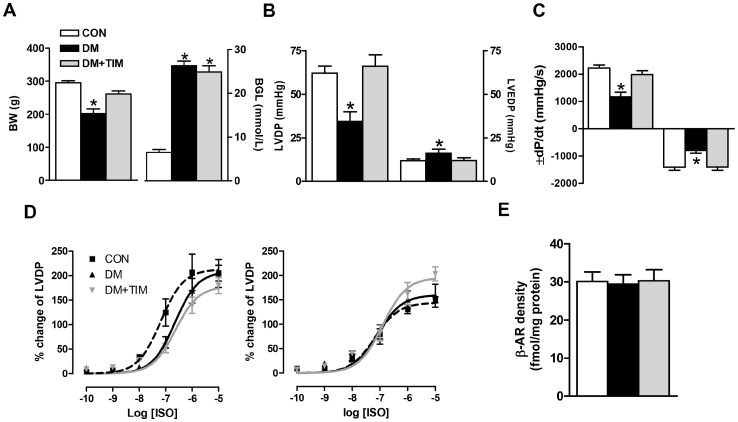
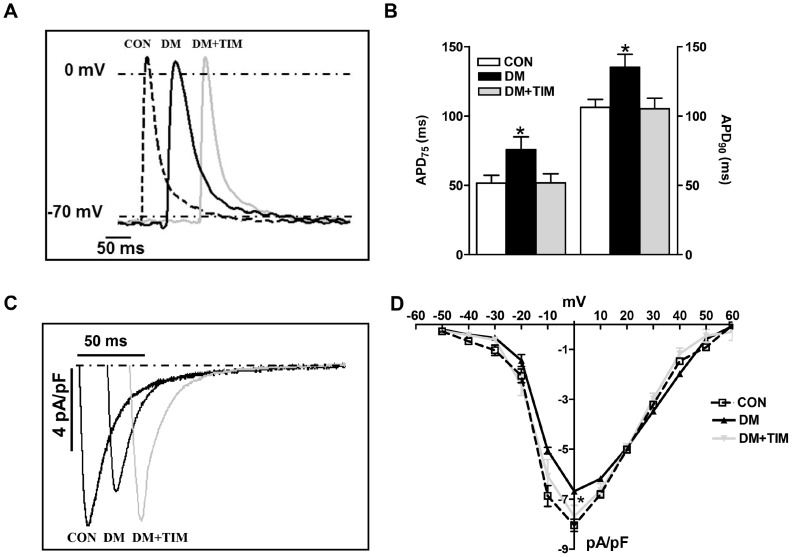
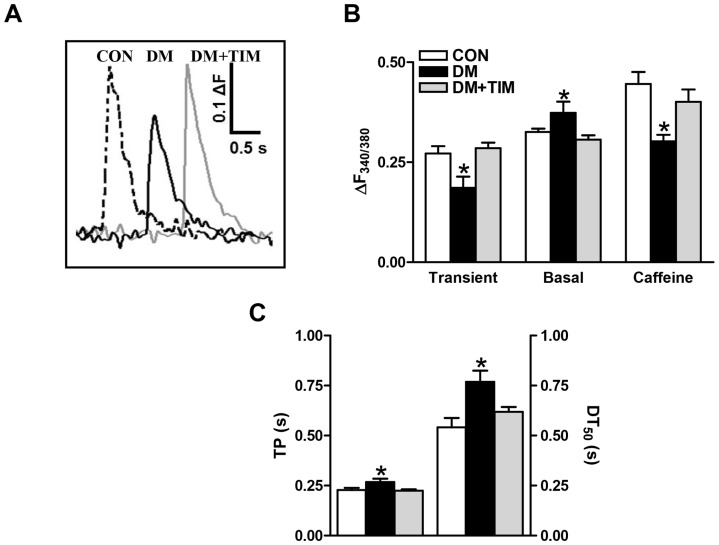
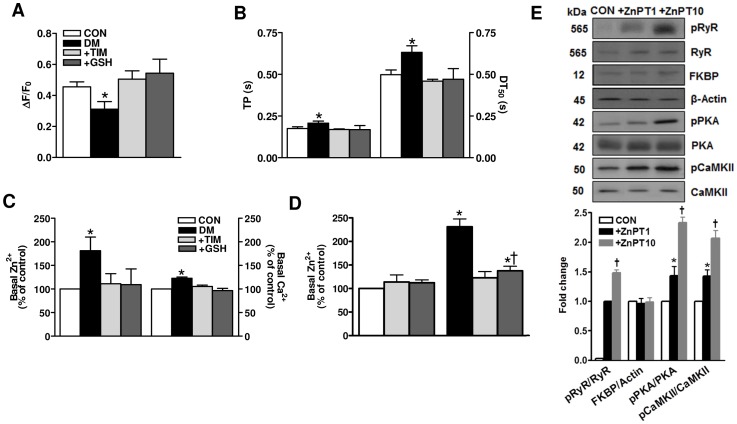
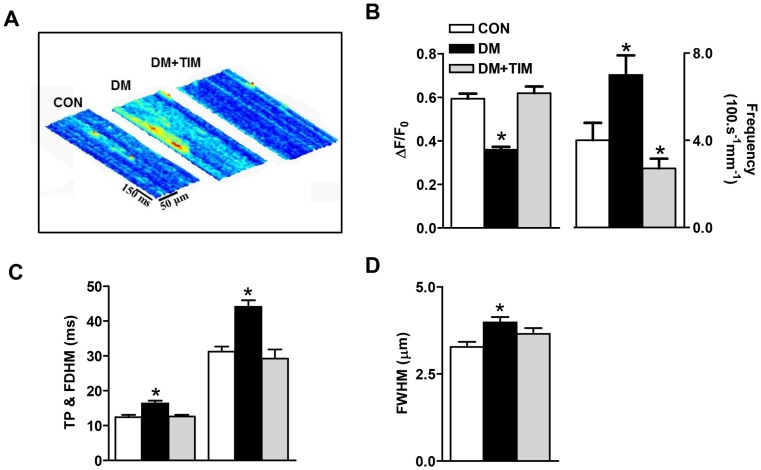
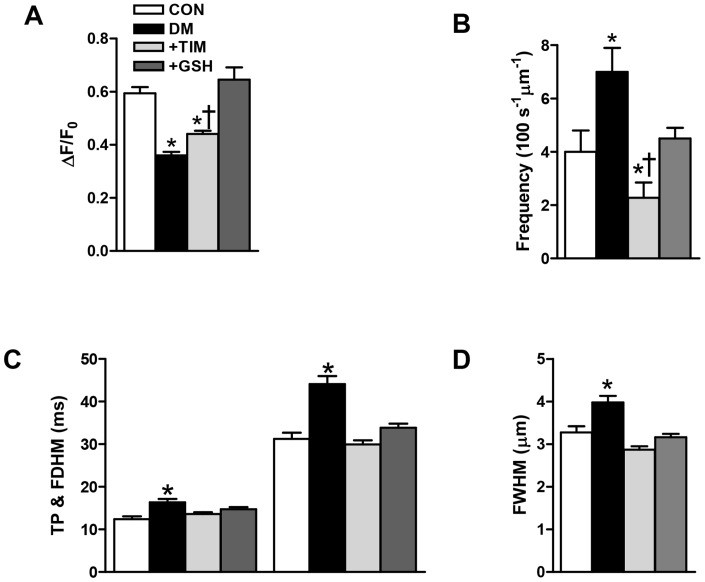
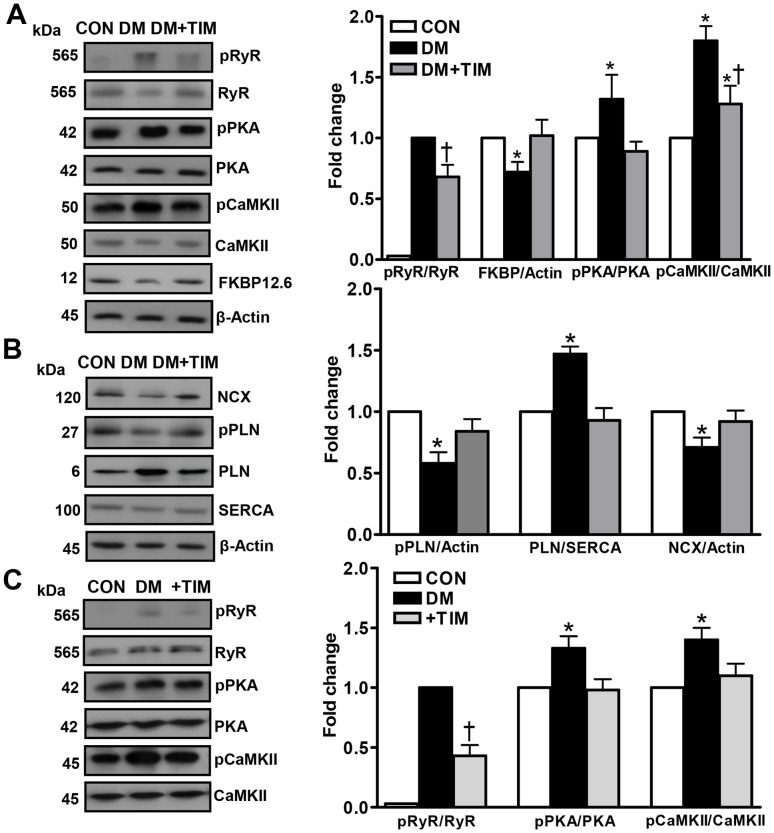
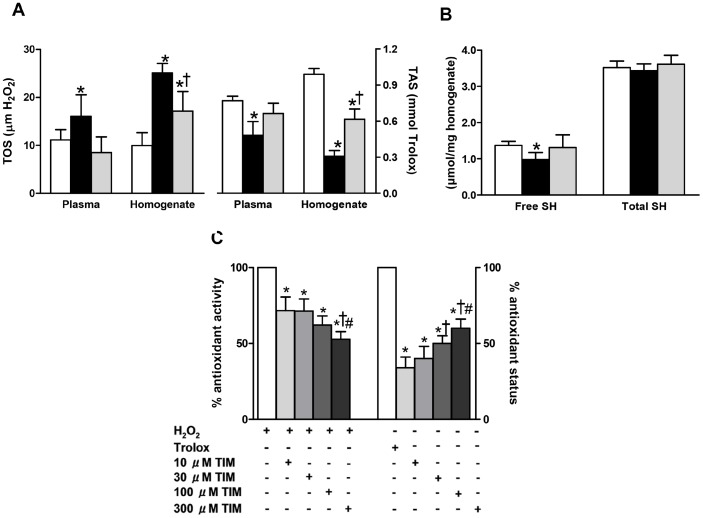
Defective cardiac mechanical activity in diabetes results from alterations in intracellular Ca(2+) handling, in part, due to increased oxidative stress. Beta-blockers demonstrate marked beneficial effects in heart dysfunction with scavenging free radicals and/or acting as an antioxidant. The aim of this study was to address how β-blocker timolol-treatment of diabetic rats exerts cardioprotection. Timolol-treatment (12-week), one-week following diabetes induction, prevented diabetes-induced depressed left ventricular basal contractile activity, prolonged cellular electrical activity, and attenuated the increase in isolated-cardiomyocyte size without hyperglycemic effect. Both in vivo and in vitro timolol-treatment of diabetic cardiomyocytes prevented the altered kinetic parameters of Ca(2+) transients and reduced Ca(2+) loading of sarcoplasmic reticulum (SR), basal intracellular free Ca(2+) and Zn(2+) ([Ca(2+)]i and [Zn(2+)]i), and spatio-temporal properties of the Ca(2+) sparks, significantly. Timolol also antagonized hyperphosphorylation of cardiac ryanodine receptor (RyR2), and significantly restored depleted protein levels of both RyR2 and calstabin2. Western blot analysis demonstrated that timolol-treatment also significantly normalized depressed levels of some [Ca(2+)]i-handling regulators, such as Na(+)/Ca(2+) exchanger (NCX) and phospho-phospholamban (pPLN) to PLN ratio. Incubation of diabetic cardiomyocytes with 4-mM glutathione exerted similar beneficial effects on RyR2-macromolecular complex and basal levels of both [Ca(2+)]i and [Zn(2+)]i, increased intracellular Zn(2+) hyperphosphorylated RyR2 in a concentration-dependent manner. Timolol also led to a balanced oxidant/antioxidant level in both heart and circulation and prevented altered cellular redox state of the heart. We thus report, for the first time, that the preventing effect of timolol, directly targeting heart, seems to be associated with a normalization of macromolecular complex of RyR2 and some Ca(2+) handling regulators, and prevention of Ca(2+) leak, and thereby normalization of both [Ca(2+)]i and [Zn(2+)]i homeostasis in diabetic rat heart, at least in part by controlling the cellular redox status of hyperglycemic cardiomyocytes.


Conflict of interest statement

Competing Interests: The authors have declared that no competing interests exist.

Figures

Figure 1
Figure 1. Timolol treatment prevents cardiac dysfunction via normalizing basal mechanical activity.
(A) Body weights (left) and blood glucose levels (right) of the rats at the end of the 12-week experimental period. Left ventricular developed pressure, LVDP (B, left) and left ventricular end diastolic pressure, LVEDP (B, right), the rates of changes in the developed pressure (±dP/dt) (C). Bar graphs in A to C represent mean ± SEM values from control, diabetic, and timolol-treated diabetic groups (number of rats in the groups; nCON = 18, nDM = 24, and nDM+TIM = 18, respectively) Effects of submaximal concentrations of a non-specific agonist, isoproterenol (ISO) on LVDP responses measured in short-term (left) and long-term (right) timolol-treated as well as untreated diabetic rats (D). Concentration–response curves for ISO represent the inotropic responses as % of their initial values and the LogEC50 value, which is equal to the concentration required to produce 50% of the maximal response induced by the agonist as determined from log-probit plots of individual response vs. concentration. LogEC50 values for ISO responses: −7.2±0.2, −6.6±0.2, −6.6±0.1 for short-term (4-week) protocol groups and −7.2±0.1, −7.1±1.2, −6.9±0.1 for long-term (12-week) protocol groups, in CON (n = 7/8 for 4-week/12-week), DM (n = 6/7 for 4-week/12-week), and DM+TIM (n = 7/7 for 4-week/12-week), respectively. The total β-AR density was measured in the crude membrane preparation from the hearts of long-term protocol groups by using saturation-binding technique with 125I-cyanopindolol (E). Bar graphs and the data points in each curve represent mean ± SEM values from CON (n = 6), DM (n = 7), DM+TIM (n = 6) groups. Significant at *p<0.05 vs. CON.
Figure 2
Figure 2. Timolol treatment restores prolonged action potential duration in the papillary muscle strips of the left ventricle and the depressed L-type Ca2+-channel currents in the ventricular cardiomyocytes from the diabetic rat heart.
(A) Representative intracellular action potential recordings in papillary muscle strips from left ventricle (inset). In here, traces are shifted for sake of clarify. (B) The mean changes in the action potential duration (as % repolarization at 75, 90; APD75,90) are presented as bar graphs (represents mean ± SEM from control, CON with white bars; from 8 rats, diabetic, DM with black bars; from 7 rats, and timolol treated diabetic rats, DM+TIM with gray bars; from 8 rats). (C) Representative L-type Ca2+-channel currents recorded at 0 mV depolarization (inset; time shifted for clarity), and (D) current–voltage relationship as current density (calculated by dividing their amplitude to their cell capacitance) in freshly isolated cardiomyocytes from control, diabetic and timolol-treated diabetic rats (CON; n = 20 cells from 6 rats, DM; n = 26 cells from 6 rats, and DM+TIM; n = 34 cells from 7 rats). Currents were recorded at room temperature (22±2°C) in the presence of cesium to inhibit K+ currents and Na+ current was inhibited after a voltage ramp protocol from a holding potential of –80 mV to –50 mV. Voltage pulses were applied from a holding potential of −80 mV to between −60 mV and +60 mV, with 10 mV voltage-steps. Data points on the curves represent mean ± SEM values. Significant at *p<0.05 vs. CON.
Figure 3
Figure 3. Effect of timolol treatment of diabetic rats on intracellular global Ca2+ changes.
(A) Representative Ca2+ transients in freshly isolated cardiomyocytes loaded with Fura-2 and field-stimulated at 0.2 Hz, (B) changes in peak amplitude of the fluorescence related with global Ca2+ transients (ΔF340/380 = F340/380Peak-F340/380Basal) (left), basal level of intracellular Ca2+ (middle), and caffeine-induced peak Ca2+ transients elicited in the cardiomyocytes (right), and the effect of timolol-treatment of diabetic rats (DM+TIM) on the time course (time to peak fluorescence, TP and half-decay time of fluorescence (left), DT50 shifts between groups were estimated by a trend-fitting to whole Ca2+ transients evoked by field stimulation of intracellular global Ca2+ changes (right) recorded from freshly isolated ventricular cardiomyocytes (C). Bar graphs represents mean ± SEM of 12–17 cells from at least 5 animals for each group protocol. Significant at *p<0.05 vs. CON.
Figure 4
Figure 4. Acute effect of timolol on intracellular global Ca2+ changes, and the basal levels of intracellular both free Zn2+ and Ca2+ in ventricular hyperglycemic cardiomyocytes.
(A) Incubation of diabetic cardiomyocytes with either 10-μM TIM or, for comparison 4-mM GSH for 1 hour enhanced the intensity of intracellular free Ca2+ transients under electric-field stimulation at 0.2 Hz (left) and shortened their time courses as well, significantly (right) (B). Diabetic cardiomyocytes were incubated for 1 hour with either 10-μM TIM or 4-mM GSH. (C) To record basal levels of both intracellular free Zn2+ and Ca2+ in resting cells in parallel, we used a ratiometric Fura-2 (4-µM Fura-2 AM) loaded cells and 50-µM N,N,N′,N′-tetrakis (2-pyridylmethyl) ethylenediamine (TPEN) (for more information about methods, see [28]). (D) FluoZin-3 (3-μM FluoZin-3 AM) loaded cells used to measure basal level of intracellular free Zn2+. Incubation of cardiomyocytes isolated from either normal or diabetic rat hearts with either TIM or GSH did not affect FluoZin-3 intensity related with basal level of intracellular free Zn2+, while these both incubations induced significant decreases the increased FluoZin-3 intensity in the diabetics. (E) Incubation of cardiomyocytes with a zinc-ionophore of 1-hydroxypyridine-2-thione (ZnPT; 1-μM and 10-μM) at 37°C for 20–30 min did not affect total protein levels of RyR2 and its accessory protein of RyR2 macromolecular complex FKBP12.6 and two important kinases PKA and CaMKII while phosphorylation levels of RyR2 as well as PKA and CaMKII (pPKA and pCaMKII, respectively) increased markedly with ZnPT incubation in a concentration-dependent manner. Values for controls (CON; nrat = 5, ncell = 25), diabetics (DM; nrat = 5, ncell = 30), TIM- or GSH-incubated (+TIM or +GSH) diabetics (nrat = 6, ncell = 24 or ncell = 22), and ZnPT incubated controls (nrat = 5, ncell = 30 for each protocol) are expressed as mean ± SEM. Significant at *p<0.05 vs. CON.
Figure 5
Figure 5. Prevention of increased intracellular basal free Ca2+ with timolol in diabetic cardiomyocytes is closely correlated with restoration in Ca2+ spark parameters.
(A) Representative 3D-reconstruction of a representative line-scan recordings demonstrate the characteristic spreads of fluorescence in space and time in freshly isolated cardiomyocytes from three groups of rats. (B) Bar graphs from control (CON), diabetic (DM), and timolol treated diabetic rats (DM+TIM) are representing peak amplitude (left) and frequency (right), (C) time to peak amplitude TP (left) and full duration at half maximum, FDHM (right), and (D) full width of half maximum of Ca2+ sparks (nrat = 5, ncell = 44, nspark = 150; nrat = 5, ncell = 55, nspark = 165; nrat = 5, ncell = 38, nspark = 135 in control CON, diabetic DM, and timolol-treated diabetic DM+TIM groups, respectively). Significant at *p<0.05 vs. CON.
Figure 6
Figure 6. In vitro experiments with either timolol or glutathione confirmed the cardioprotective effects of timolol via prevention of increased basal free Ca2+ in diabetic cardiomyocytes due to a restoration in Ca2+ spark parameters.
Effects of either 10-μM TIM or 4-mM GSH incubation of diabetic cardiomyocytes for 1 hour on the fluorescence changes related with Ca2+ sparks amplitude (A), sparks frequency (B), time to peak amplitude TP (left) and full duration half maximum, FDHM (right) (C), and full width of half maximum of the Ca2+ sparks (D). Bars represent control (CON; nrat = 5, ncell = 30, nspark = 102), diabetic (DM; nrat = 5, ncell = 35, nspark = 122) and TIM or GSH incubated (+TIM or +GSH) diabetic (nrat = 6, ncell = 38 or ncell = 32, nspark = 120 or nspark = 104) groups, respectively. Values are expressed as mean ± SEM. Significant at *p<0.05 vs. CON, p<0.05 vs. DM.
Figure 7
Figure 7. Effects of timolol on phosphorylation and protein levels of both SR Ca2+ release channel (RyR2) and some Ca2+ handling regulators.
Data presented in (A) and (B) are obtained from homogenates from control (CON), diabetic (DM), and timolol treated diabetic (DM+TIM) rat hearts. (A) Left: representative Western blotting for 565 kDa phospho-RyR2-Ser2808 (pRyR2) and total RyR2, 42 kDa phospho-PKA-Thr198 (pPKA) and PKA, 50 kDa phospho-CaMKII-Thr286 (pCaMKII) and CaMKII, 12 kDA FKBP12.6, and 45 kDa β-actin, respectively. Right: quantification for the ratio of pRyR2 to RyR2, FKBP12.6 to β-actin pPKA to PKA, and pCaMKII to CaMKII, respectively. (B) Left: Western blotting for 120 kDa sarcolemmal NCX, 27 kDa phopho-PLN (Thr-17) and 6 kDa total PLN (L-15), 100 kDa SERCA2 (N-19), and 45 kDa β-actin, respectively. Right: quantification for the ratio of pPLN/actin, PLN/SERCA, and NCX/actin, respectively. The parameters given in section (C) are presented for ratio of 565 kDa pRyR2 to total RyR2, pPKA/PKA, and pCaMKII/CaMKII, respectively (right) in the isolated cardiomyocytes from the diabetic (DM) rats incubated with either 10-μM TIM (+TIM) or 4-mM glutathione, GSH (+GSH) (1 hour). Left: representative Western blotting for 565 kDa pRyR2 and total RyR2, 42 kDa pPKA (Thr198) and PKA, and 50 kDa pCaMKII-Thr286 and CaMKII, respectively. Bars represent mean ± SEM, n = 5–6 for hearts/group/protocol (double assays in each sample from each group for each type of measurement). Significant at *p<0.05 vs. CON and p<0.05 vs. DM.
Figure 8
Figure 8. Confirmation of antioxidant effect of timolol on the contractile activity of diabetic rat heart via using different biochemical approaches.
The total oxidant status measured with respect to H2O2 and the total antioxidant status measured with respect to trolox (A) in both plasma and heart homogenate of control rats (CON group; white bar) and diabetic rats without treatment (DM group; black bar) or with TIM treatment (DM+TIM group; gray bar) for 4-week following the one week of diabetic status confirmation. (B) The total and free protein thiol levels measured in heart homogenate of the groups. Bars represent mean ± SEM. The number of rats is 12–17 for rats/group/protocol. Significant at *p<0.05 vs. CON group, p<0.05 vs. DM group. (C) In vitro antioxidant activity and antioxidant status of TIM was measured with colorimetric methods. Antioxidant activity of increasing concentration of TIM is evaluated with absorbance changes in H2O2-induced signal. Bar graphs represent mean ± SEM values for 10-30-100-300 μM TIM applications on H2O2 included samples for expressing antioxidant activity. Bar graphs represent mean ± SEM values from Trolox or 10-30-100-300 μM TIM applications on ABTS chromogen solution for expressing antioxidant status (triple assays in each sample for each type of measurement). Significant at *p<0.05 vs. H2O2 or Trolox, and p<0.05 vs. 10-μM TIM, #p vs. 30-μM TIM.

Similar articles

Cited by

References

    1. Rubler S, Dlugash J, Yuceoglu YZ, Kumral T, Branwood AW, et al. (1972) New type of cardiomyopathy associated with diabetic glomerulosclerosis. Am J Cardiol 30: 595–602. - PubMed
    1. Fein FS, Kornstein LB, Strobeck JE, Capasso JM, Sonnenblick EH (1980) Altered myocardial mechanics in diabetic rats. Circ Res 47: 922–933. - PubMed
    1. Yaras N, Ugur M, Ozdemir S, Gurdal H, Purali N, et al. (2005) Effects of diabetes on ryanodine receptor Ca release channel (RyR2) and Ca2+ homeostasis in rat heart. Diabetes 54: 3082–3088. - PubMed
    1. Ganguly PK, Pierce GN, Dhalla KS, Dhalla NS (1983) Defective sarcoplasmic reticular calcium transport in diabetic cardiomyopathy. Am J Physiol 244: E528–535. - PubMed
    1. Pierce GN, Kutryk MJ, Dhalla NS (1983) Alterations in Ca2+ binding by and composition of the cardiac sarcolemmal membrane in chronic diabetes. Proc Natl Acad Sci U S A 80: 5412–5416. - PMC - PubMed

Publication types

MeSH terms