. 2013 Jul 26;8(7):e71018.
doi: 10.1371/journal.pone.0071018. Print 2013.

Aggregation of lipid-anchored full-length H-Ras in lipid bilayers: simulations with the MARTINI force field

Affiliations

Aggregation of lipid-anchored full-length H-Ras in lipid bilayers: simulations with the MARTINI force field

Hualin Li et al. PLoS One. .

Abstract

Lipid-anchored Ras oncoproteins assemble into transient, nano-sized substructures on the plasma membrane. These substructures, called nanoclusters, were proposed to be crucial for high-fidelity signal transmission in cells. However, the molecular basis of Ras nanoclustering is poorly understood. In this work, we used coarse-grained (CG) molecular dynamics simulations to investigate the molecular mechanism by which full-length H-ras proteins form nanoclusters in a model membrane. We chose two different conformations of H-ras that were proposed to represent the active and inactive state of the protein, and a domain-forming model bilayer made up of di16:0-PC (DPPC), di18:2-PC (DLiPC) and cholesterol. We found that, irrespective of the initial conformation, Ras molecules assembled into a single large aggregate. However, the two binding modes, which are characterized by the different orientation of the G-domain with respect to the membrane, differ in dynamics and organization during and after aggregation. Some of these differences involve regions of Ras that are important for effector/modulator binding, which may partly explain observed differences in the ability of active and inactive H-ras nanoclusters to recruit effectors. The simulations also revealed some limitations in the CG force field to study protein assembly in solution, which we discuss in the context of proposed potential avenues of improvement.


Conflict of interest statement

Competing Interests: The authors have declared that no competing interests exist.

Figures

Figure 1
Figure 1. Two modes of membrane binding by H-Ras were observed in previous simulations .
(a) An approximately perpendicular orientation of the catalytic domain with respect to the membrane plane. This conformation, which we refer to as conf1, was frequently sampled during GDP-H-ras simulations . (b) Semi-parallel orientation of the catalytic domain with respect to the membrane plane, which we refer to here as conf2. These two conformations were used as starting structures for the current simulations. Helices 4 and 5, as well as the bound nucleotide, are labeled. The canonical switches SI and SII are at the bottom of the image surrounding the nucleotide. Also shown in space-filling representation are side chains of the HVR along with Arg128 and Arg135 on helix 4, as well as the three lipid modifications (two palmitoyls at positions 181 and 184 and a farnesyl at position 186).
Figure 2
Figure 2. Snapshots and aggregation profiles derived from simulations B1 and B2.
Top view of initial (a) and final configurations of conf1 (b), and conf2 (c), in a 5:3:2 DPPC:DLiPC:CHOL ternary bilayer. The 32 H-ras proteins are colored in yellow, DPPC in red, DLiPC and CHOL in blue and white. (d) The number of total clusters during the simulations.
Figure 3
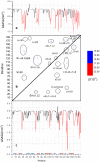
Figure 3. Protein-protein contact probability map for conf1 (upper half) and conf2 (lower half) during different stages of the simulations: (a) 1–2 µs, (b) 9–10 µs, (c) 19–20 µs, and (d) 24–25 µs.
The color scale on the right refers to the P value (the same scale is in Figures 4b and S4). All P values were calculated from the number of residue-residue contacts normalized as indicated in eqn2. The critical contact regions are highlighted with circles and labeled by Ln: linker, An: anchor, L: loop, SI: switch I, SII: switch II, α: α helix, β: β-strand.
Figure 4
Figure 4. Contour maps of P for the snapshots sampled from the 24–25 µs window, with key regions highlighted as in Figure 3 (upper half: conf.1, lower half: conf2).
The corresponding ΔSASA distributions are displayed next to the contour maps. Residues with ΔSASA>0.75 nm2 are highlighted in red. Average SASA was calculated on 4ns-spearated frames and averaged over the last and first 1 µs windows. Major secondary structure are indicated schematically with helices in red and strands in blue in (c).
Figure 5
Figure 5. Snapshots illustrating inter-protein interactions in Ras aggregates derived from simulations with Ras in conf1 (left) and conf2 (right).
Shown are side (a & b) and top views of conf1 and conf2 aggregates. The color scheme for the lipid molecules is the same as in Figure 1 (except for DPPC, which is in now tan). Proteins are shown in different colors.
Figure 6
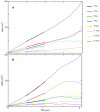
Figure 6. Mean square displacements of conf1 (a) and conf2 (b) during the indicated time windows.
The lateral diffusion coefficient was calculated from a linear fit to the MSD curve in the time interval highlighted by bold lines.

Similar articles

Cited by

References

    1. Barbacid M (1987) ras Genes. Annual Review of Biochemistry 56: 779–827. - PubMed
    1. Wennerberg K, Rossman KL, Der CJ (2005) The Ras superfamily at a glance. Journal of Cell Science 118: 843–846. - PubMed
    1. Yan J, Roy S, Apolloni A, Lane A, Hancock JF (1998) Ras Isoforms Vary in Their Ability to Activate Raf-1 and Phosphoinositide 3-Kinase. Journal of Biological Chemistry 273: 24052–24056. - PubMed
    1. Voice JK, Klemke RL, Le A, Jackson JH (1999) Four Human Ras Homologs Differ in Their Abilities to Activate Raf-1, Induce Transformation, and Stimulate Cell Motility. Journal of Biological Chemistry 274: 17164–17170. - PubMed
    1. Rodriguez-Viciana P, Sabatier C, McCormick F (2004) Signaling Specificity by Ras Family GTPases Is Determined by the Full Spectrum of Effectors They Regulate. Molecular and Cellular Biology 24: 4943–4954. - PMC - PubMed

Publication types