. 2013 Sep;140(18):3777-86.
doi: 10.1242/dev.093948. Epub 2013 Aug 7.

Notch signaling represses p63 expression in the developing surface ectoderm

Affiliations

Notch signaling represses p63 expression in the developing surface ectoderm

Ana Mafalda Baptista Tadeu et al. Development. 2013 Sep.

Abstract

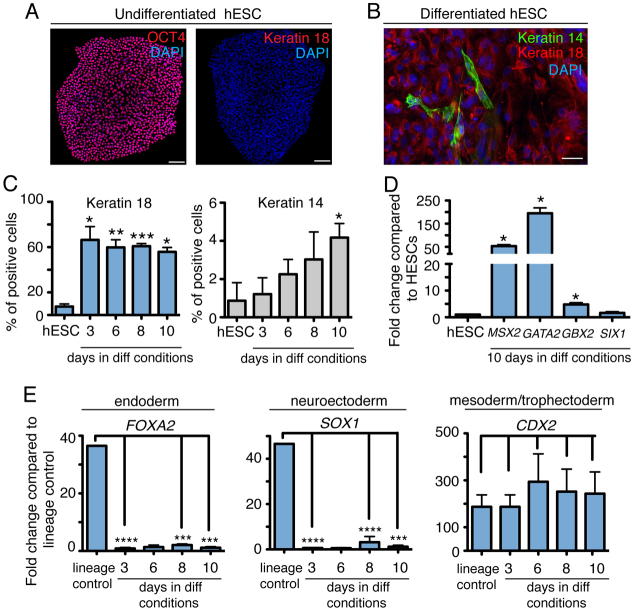
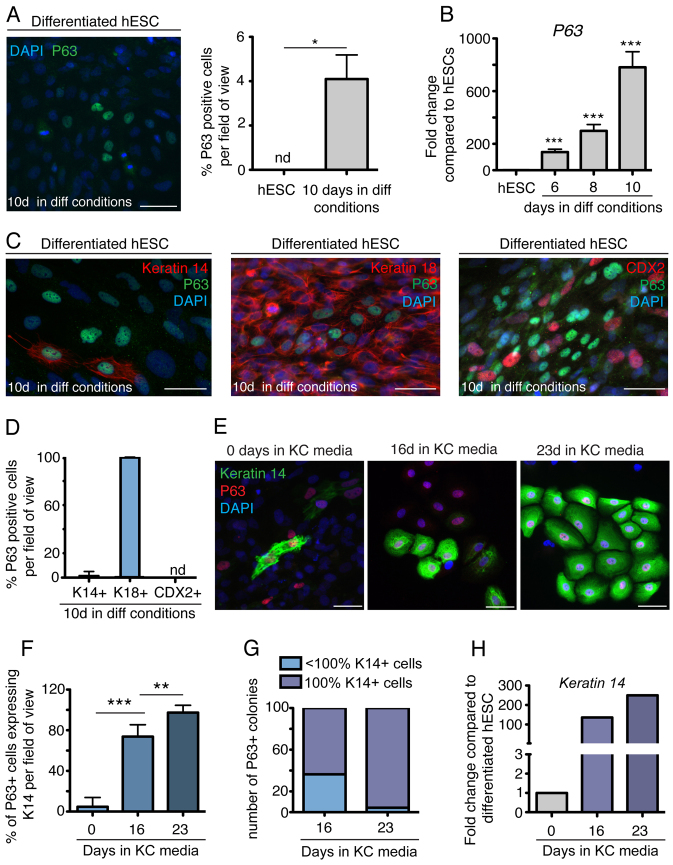
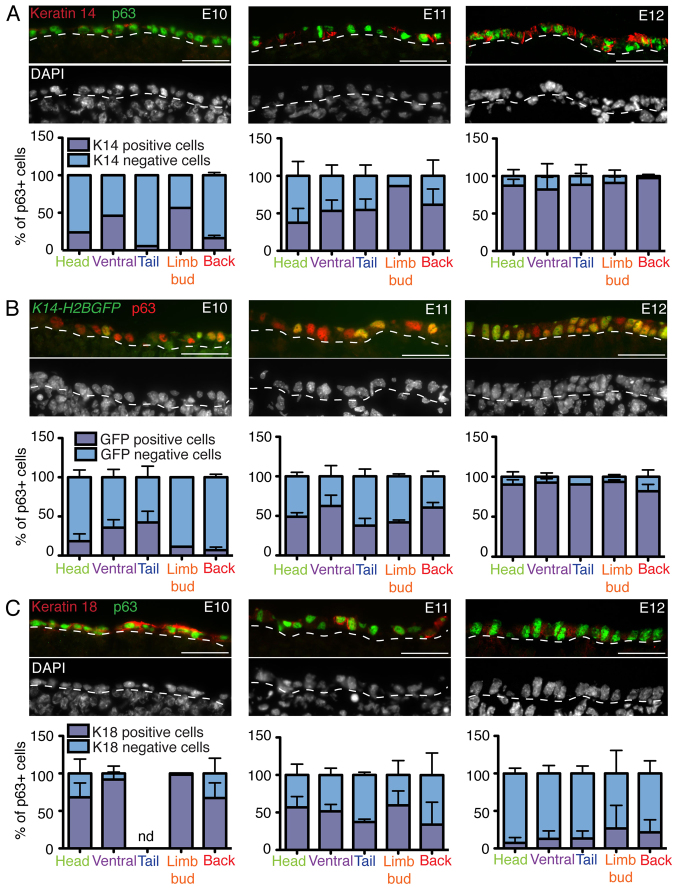
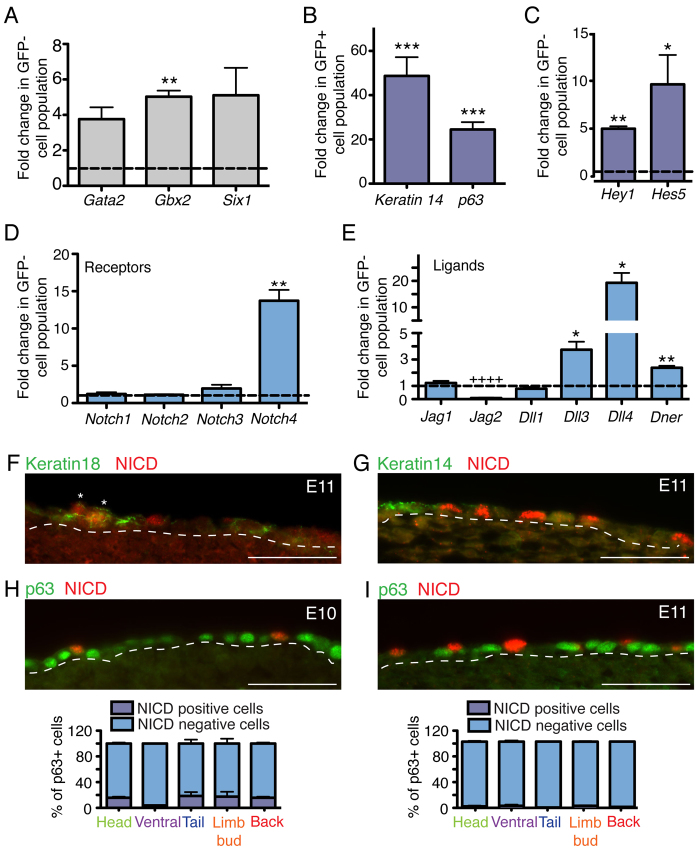
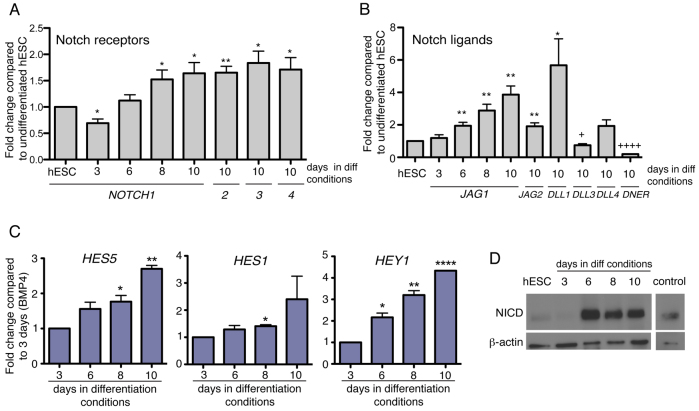
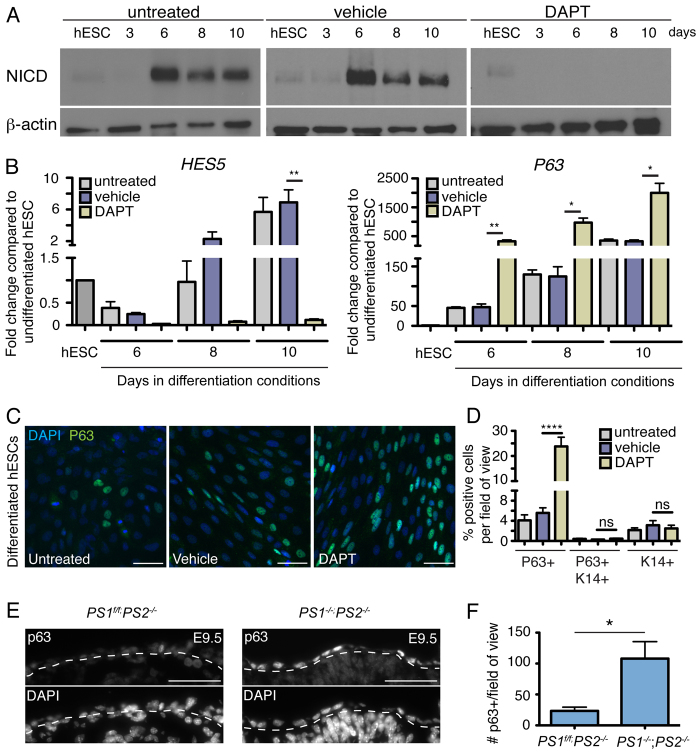
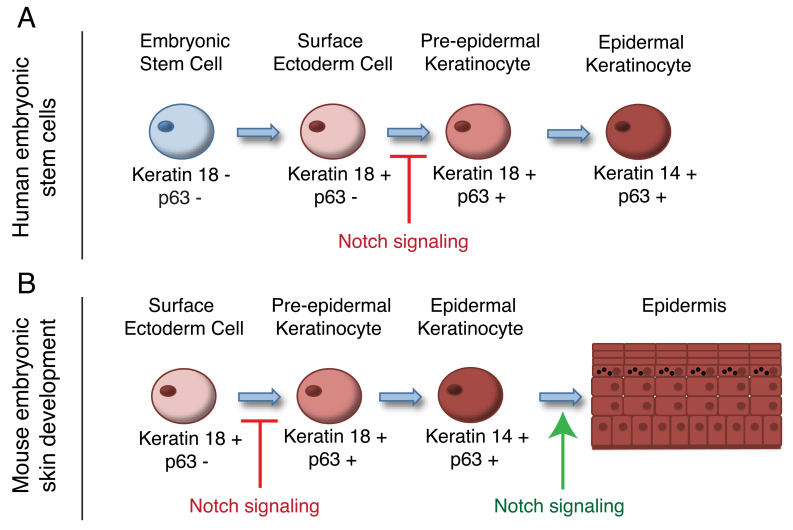
The development of the mature epidermis requires a coordinated sequence of signaling events and transcriptional changes to specify surface ectodermal progenitor cells to the keratinocyte lineage. The initial events that specify epidermal keratinocytes from ectodermal progenitor cells are not well understood. Here, we use both developing mouse embryos and human embryonic stem cells (hESCs) to explore the mechanisms that direct keratinocyte fate from ectodermal progenitor cells. We show that both hESCs and murine embryos express p63 before keratin 14. Furthermore, we find that Notch signaling is activated before p63 expression in ectodermal progenitor cells. Inhibition of Notch signaling pharmacologically or genetically reveals a negative regulatory role for Notch signaling in p63 expression during ectodermal specification in hESCs or mouse embryos, respectively. Taken together, these data reveal a role for Notch signaling in the molecular control of ectodermal progenitor cell specification to the epidermal keratinocyte lineage.

Keywords: Ectoderm; Keratinocyte specification; Notch signaling; p63.


Figures

Fig. 1.
Fig. 1.
Ectoderm specification in hESCs. (A) Undifferentiated hESCs are positive for OCT4 (red) and negative for K18 as assayed by immunofluorescence. (B) Following treatment of hESCs with 0.5 nM BMP4 for 3 days and serum for 7 days, the majority of the cells are positive for K18 (red) and a small percentage of the cells are positive for K14 (green). (C) Analysis of K14 and K18 protein levels during ectoderm specification of hESCs as assayed by FACS (n=4-6 independent experiments for each bar). (D) Quantitative real-time analysis of the levels of several ectoderm markers after ectoderm specification of hESCs (n=3 independent differentiation experiments for each graph). (E) Ectoderm specification does not induce endoderm or neuroectoderm lineage specification as indicated by quantitative real-time PCR analysis of FOXA2 or SOX1 expression, respectively. Analysis of mRNA levels of CDX2 indicates that mesoderm/trophectoderm development was initiated (n=3 independent differentiation experiments for each graph bar). All data are ± s.d. (***/****P<0.001, **0.001<P<0.01, *0.01<P<0.05). Scale bars: 100 μm in A; 50 μm in B.
Fig. 2.
Fig. 2.
P63 expression during ectoderm and keratinocyte differentiation of hESCs. (A) Ectoderm-specified hESCs express P63 (green) (n=38 fields of view containing 1.65×10⁴-2.0×10⁴ cells from three independent experiments). (B) Real-time PCR analysis of mRNA levels of P63 during differentiation compared to undifferentiated hESCs (n=9 independent differentiation experiments for each bar). (C) Ten days after ectoderm specification of hESCs, P63+ cells (green) express K14 (red) and K18 (red) but are negative for CDX2 (red). (D) Quantification of the percentage of P63+ cells that are positive for K14, K18 or CDX2 (n=38 fields of view containing 1.65×10⁴-2.0×10⁴ cells from three independent experiments). (E) Ectoderm-specified hESCs after 10 days of differentiation were plated in keratinocyte (KC) media for indicated time points and assayed by immunofluorescence for the presence of P63 (red) and K14 (green). (F) Quantification of the percentage of P63+/K14+ cells revealed an increase in the number of keratinocytes after 16 and 23 days in culture with keratinocyte medium (n=10 fields of view containing 200-792 P63+ cells). (G) The number of colonies containing 100% P63+/K14+ increased after 23 days in culture with keratinocyte medium (n=10 fields of view containing 200-792 P63+ cells). (H) Quantification of the mRNA levels of K14 after plating ectoderm-specified hESCs in keratinocyte medium. All data are ± s.e.m. (***/****P<0.001, **0.001<P<0.01, *0.01<P<0.05). nd, not detected. Scale bars: 50 μm.
Fig. 3.
Fig. 3.
p63 expression during murine keratinocyte development. (A) Immunofluorescence analysis of K14 (red) and p63 (green) expression during murine skin development at E10-E12. Quantification of the percentage of p63+ cells that are K14+ or K14- at E10-E12 in indicated regions of the embryo (n=3 embryos per bar). (B) Immunofluorescence analysis of p63 (red) expression in K14-H2BGFP mice during murine skin development at E10-E12. Quantification of the percentage of p63+ cells that are GFP+ or GFP- at E10-E12 in indicated regions of the embryo (n=3 embryos per bar). (C) Immunofluorescence analysis of K18 (red) and p63 (green) expression during murine skin development at E10-E12. Quantification of the percentage of p63+ cells that are K18+ or K18- at E10-E12 in indicated regions of the embryo (n=3 embryos per bar). The dotted line indicates surface epithelium boundary. nd, not determined. Scale bars: 50 μm.
Fig. 4.
Fig. 4.
Notch signaling is activated in ectodermal progenitor cells during development. (A) Quantitative real-time PCR analysis shows upregulation of the ectoderm markers Gata2, Gbx2 and Six1 mRNA levels in E-cadherin+, α6 integrin+, GFP- cells (n=3 independent FACS-purified cell populations for each bar). (B) Quantitative real-time PCR analysis shows upregulation of K14 and p63 mRNA expression in FACS purified E-cadherin+, α6 integrin+, GFP+ (n=8 independent FACS-purified cell populations for each bar). (C) Quantitative real-time PCR analysis of the mRNA levels of Hey1 and Hes5 shows an upregulation in E11 E-cadherin+, α6 integrin+, GFP- cells (n=8 independent FACS purified cell populations for each bar). (D,E) Quantitative real-time PCR analysis reveals an upregulation of mRNA levels of the Notch4 receptor (D) as well as the Notch ligands Jag1, Jag2, Dll1, Dll3, Dll4 and DNER (E) in E-cadherin+, α6 integrin+, GFP- cells at E11 (n=4 independent FACS-purified cell populations for each bar). (F) Notch signaling pathway is activated in K18+ cells (green) as shown by immunofluorescence for the NICD (red) at E11. Asterisks indicate K18+/NICD+ cells. (G) At E11 K14+ cells (green) are negative for NICD (red). (H,I) Immunofluorescence analysis of NICD (red) and p63 (green) expression during murine skin development at E10 (H) and E11 (I). Quantification of the percentage of p63+ cells that are NICD+ or NICD- at E10 (H) or E11 (I) in indicated regions of the embryo (n=3 embryos per bar). All data are ± s.d. (++++P<0.001, ***P<0.001, **0.001<P<0.01, *0.01<P<0.05). The dotted line indicates surface epithelium boundary. Scale bars: 50 μm.
Fig. 5.
Fig. 5.
Notch signaling is activated during ectoderm specification in hESCs. (A,B) Quantitative real-time PCR analysis of mRNA levels of all four Notch receptors (NOTCH1-4) and ligands JAG1, JAG2, DLL1, DLL3, DLL4 and DNER in differentiated hESCs at indicated days after induction compared with undifferentiated cells. (C) Quantitative real-time PCR analysis of mRNA levels of HES1, HES5 and HEY1 indicates activation of Notch signaling in differentiated hESCs. (D) Notch signaling pathway is activated during ectoderm specification of hESCs as shown by western blot for NICD. Western blot for β-actin was carried out as a loading control. The positive control sample is protein from P0 murine kidney (all quantitative real-time PCR analyses are n=6 independent differentiation experiments for each bar). All data are ± s.d. (++++/****P<0.001, **0.001<P<0.01, *0.01<P<0.05).
Fig. 6.
Fig. 6.
Inactivation of Notch signaling promotes p63 expression during ectoderm specification. (A) hESCs were treated with the γ-secretase inhibitor DAPT during ectoderm differentiation. Inactivation of the Notch signaling pathway was confirmed by the absence of NICD by western blot analysis. Western blot for β-actin was carried out as a loading control. (B) Quantitative real-time PCR analysis of mRNA levels of HES5 and P63 in untreated, vehicle- or DAPT-treated hESCs during ectoderm differentiation (n=5 independent differentiation experiments for each graph bar). (C) Untreated, vehicle- and DAPT-treated hESCs after 10 days of ectoderm specification were immunostained for P63 (green). (D) Quantification of the number of P63+, K14+ cells or P63+/K14+ cells in untreated, vehicle- and DAPT-treated hESCs after 10 days of ectoderm specification (n=38 fields of view containing 1.65×10⁴-2.0×10⁴ cells from three independent experiments). ns, not significant. (E) Sections of control (PS1f/f;PS2-/-) or PS null (PS-/-;PS2-/-) embryos at E9.5 were stained with antibodies against p63. (F) Quantification of p63 cells per field of view (n=3-5 embryos per bar). For B, data are ± s.d. (**0.001<P<0.01,*0.01<P<0.05), for D and F data are ± s.e.m. (****P<0.001,*0.01<P<0.05). The dotted line indicates the surface epithelium boundary. Scale bars: 50 μm.
Fig. 7.
Fig. 7.
Model for keratinocyte specification during epidermal development. Keratinocyte specification occurs in multiple steps during (A) in vitro differentiation of hESCs and during (B) in vivo murine skin development. Surface ectoderm progenitor cells express K18 and display activated Notch signaling. Upon release of Notch signaling, K18+ cells upregulate p63 expression to initiate keratinocyte lineage commitment. p63+ cells express K14 to generate a fully committed keratinocyte, which upon later Notch signals promote stratification and the formation of the mature epidermis.

References

    1. Aberdam E., Barak E., Rouleau M., de LaForest S., Berrih-Aknin S., Suter D. M., Krause K.-H., Amit M., Itskovitz-Eldor J., Aberdam D. (2008). A pure population of ectodermal cells derived from human embryonic stem cells. Stem Cells 26, 440–444 - PubMed
    1. Bernando A. S., Faial T., Gardner L., Niakan K. K., Ortmann D., Senner C. E., Callery E. M., Trotter M. W., Hemberger M., Smith J. C., et al. (2011). BRACHYURY and CDX2 mediate BMP-induced differentiation of human and mouse pluripotent stem cells into embryonic and extraembryonic lineages. Cell Stem Cell 9, 144–155 - PMC - PubMed
    1. Blanpain C., Fuchs E. (2006). Epidermal stem cells of the skin. Annu. Rev. Cell Dev. Biol. 22, 339–373 - PMC - PubMed
    1. Blanpain C., Lowry W. E., Pasolli H. A., Fuchs E. (2006). Canonical notch signaling functions as a commitment switch in the epidermal lineage. Genes Dev. 20, 3022–3035 - PMC - PubMed
    1. Bouras T., Pal B., Vaillant F., Harburg G., Asselin-Labat M.-L., Oakes S. R., Lindeman G. J., Visvader J. E. (2008). Notch signaling regulates mammary stem cell function and luminal cell-fate commitment. Cell Stem Cell 3, 429–441 - PubMed

Publication types

MeSH terms

LinkOut - more resources