. 2013 Nov;94(5):877-84.
doi: 10.1189/jlb.0213084. Epub 2013 Aug 7.

Type 2 innate lymphoid cells constitutively express arginase-I in the naive and inflamed lung

Affiliations

Type 2 innate lymphoid cells constitutively express arginase-I in the naive and inflamed lung

Jennifer K Bando et al. J Leukoc Biol. 2013 Nov.

Abstract

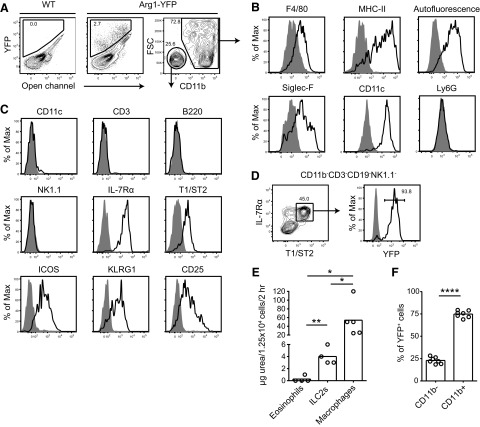
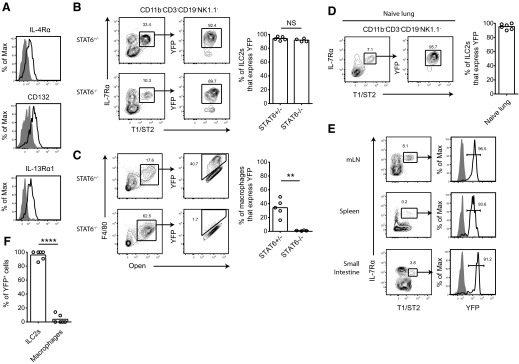
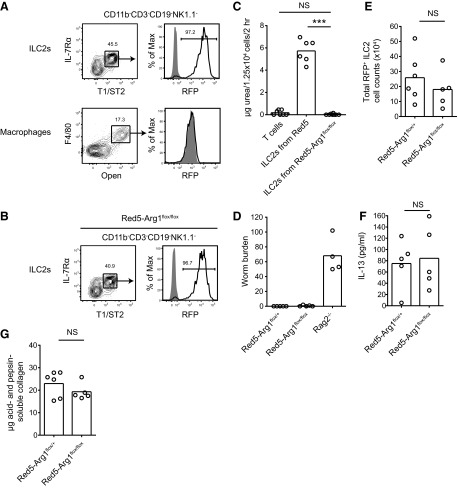
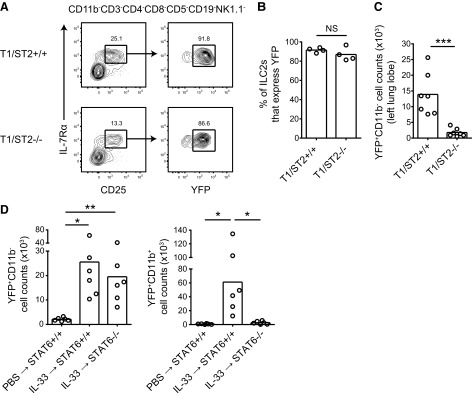
Arg1 is produced by AAMs and is proposed to have a regulatory role during asthma and allergic inflammation. Here, we use an Arg1 reporter mouse to identify additional cellular sources of the enzyme in the lung. We demonstrate that ILC2s express Arg1 at rest and during infection with the migratory helminth Nippostrongylus brasiliensis. In contrast to AAMs, which express Arg1 following IL-4/IL-13-mediated STAT6 activation, ILC2s constitutively express the enzyme in a STAT6-independent manner. Although ILC2s deficient in the IL-33R subunit T1/ST2 maintain Arg1 expression, IL-33 can regulate total lung Arg1 by expanding the ILC2 population and by activating macrophages indirectly via STAT6. Finally, we find that ILC2 Arg1 does not mediate ILC2 accumulation, ILC2 production of IL-5 and IL-13, or collagen production during N. brasiliensis infection. Thus, ILC2s are a novel source of Arg1 in resting tissue and during allergic inflammation.

Keywords: Arg1-YFP; ILC2; Nippostrongylus brasiliensis; Yarg; alternatively activated macrophages.


Figures

Figure 1.
Figure 1.. Arg1 is expressed by ILC2s and AAMs in the lung during N. brasiliensis infection.
(A) Flow cytometric analysis of YFP expression at Day 9 of N. brasiliensis infection in Arg1-YFP mouse lungs. A WT control was used to set gates (left plot), and an open channel was used to identify autofluorescence. CD11b expression in YFP+ cells is shown in the right plot. (B) Characterization of cell surface markers expressed by YFP+CD11b+ cells by flow cytometry. Shaded histograms represent isotype controls, except in the histogram depicting autofluorescence, where the shaded plot represents autofluorescence in lymphocytes. (C) Cell surface markers expressed by YFP+CD11b cells determined by flow cytometry. Shaded histograms are isotype controls. (D) Expression of YFP in LinIL-7Rα+T1/ST2+ ILC2s. Cells were previously gated on live CD11bCD3CD19NK1.1 cells. The shaded histogram is from a WT control. (E) Arginase enzyme assay in sorted lung populations from infected C57BL/6 mice. Cells (1.25×10⁴) of each population were sorted from Day 12-infected lungs, lysed, and assayed for urea production in a 2-h reaction in the presence of arginine. Data are representative of two independent experiments; n = 4–5/group, with each symbol representing a sort from an individual animal. *P ≤ 0.05; **P ≤ 0.01. (F) Percent of YFP+ cells that are CD11b (ILC2s) or CD11b+ (macrophages); n = 7, pooled from two independent experiments. ****P ≤ 0.0001.
Figure 2.
Figure 2.. ILC2s constitutively express Arg1.
(A) Expression of receptor subunits for type I and type II IL-4R in LinIL-7Rα+T1/ST2+ ILC2s by flow cytometry. Mice were infected with N. brasiliensis, and lung cells were stained on Day 9. Shaded histograms represent isotype controls. (B) YFP expression in lung ILC2s and (C) macrophages in STAT6-deficient mice. Cells were obtained from N. brasiliensis-infected lungs on Day 9. Flow cytometry plots on the left show the gating scheme used to obtain percentages graphed in the right panel. ILC2 plots were gated previously on live CD11bCD3CD19NK1.1 cells. Data are representative of two independent experiments; n = 4–5. **P ≤ 0.01. (D) YFP expression in ILC2s isolated from the lungs of naive mice. Plots were gated previously on live CD11bCD3CD19NK1.1 cells; n = 6, pooled from two independent experiments. (E) YFP expression in LinIL-7Rα+T1/ST2+ cells from the mesenteric LNs (mLN), spleen, and small intestine of naive mice. Plots were gated previously on CD11bCD3CD19NK1.1 cells for the mesenteric LNs, and CD11bCD3CD5CD19NK1.1 cells for the spleen and small intestine. (F) Percent of YFP+ cells that are ILC2s or macrophages in the naive lung; n = 6, pooled from two independent experiments. ****P ≤ 0.0001.
Figure 3.
Figure 3.. Arg1 deficiency does not affect ILC2 numbers or cytokine production.
(A) RFP expression in ILC2s (upper) or macrophages (lower) in Red5 lungs on Day 10 of N. brasiliensis infection. The shaded histograms represent WT controls. Plots for ILC2s were gated previously on live CD11bCD3CD19NK1.1 cells. (B) RFP expression in ILC2s from Red5-Arg1flox/flox lungs at Day 10 of infection. The shaded histogram represents a WT control. Plots were gated previously on live CD11bCD3CD19NK1.1 cells. (C) Arginase enzyme assay on ILC2s sorted from Red5-Arg1flox/flox lungs. LinIL-7Rα+T1/ST2+ cells (1.25×10⁴) or CD4+ T cells were sorted from lungs at Day 10 of N. brasiliensis infection, lysed, and assayed for urea production after a 2-h reaction in the presence of arginine; n = 6; pooled from two independent experiments, with each n as a sort from an individual mouse. ***P ≤ 0.001. (D) Worm burden in Red5-Arg1flox/flox, Red5-Arg1flox/+, and Rag2-deficient positive controls at Day 10 of infection. Data are representative of two independent experiments; n = 4–5. (E) Total lung RFP+ ILC2 counts in Red5-Arg1flox/flox mice compared with Red5-Arg1flox/+ controls at Day 10 of infection. Data are representative of three independent experiments; n = 5–6. (F) IL-13 detected in the supernatants of unstimulated cultures of ILC2s, which were sorted from Day 10-infected mouse lungs and incubated in complete RPMI for 8 h. Data are representative of two independent experiments; n = 5. (G) Assessment of uncross linked collagen in Red5-Arg1flox/flox mice at Day 10 of infection. Acid- and pepsin-soluble collagen was extracted from the right superior lobe of the lung. Data are representative of two independent experiments; n = 5–6.
Figure 4.
Figure 4.. IL-33 can regulate Arg1+ cell numbers in lung tissue.
(A) Identification of ILC2s in T1/ST2-deficient mouse lungs using IL-7Rα and CD25. Cells are from Day 9 of N. brasiliensis infection. (B) Percent of lung ILC2s that express YFP in T1/ST2-deficient mice during inflammation. Cells were isolated from the left lung lobe at Day 9 of N. brasiliensis infection; n = 4. (C) Total lung YFP+CD11b (ILC2) cell counts from infected, T1/ST2-deficient mice. Cell counts are from the left lung lobe at Day 9 of N. brasiliensis infection. Data are pooled from two independent experiments; n = 7. ***P ≤ 0.001. (D) Total lung YFP+CD11b (ILC2) and YFP+CD11b+ (AAM) cell counts after administration of intranasal IL-33 in STAT6-deficient and -sufficient mice. rIL-33 (500 ng) was administered daily for 3 days, and cell counts in the whole lung were determined on Day 4; n = 6 and are the pooled data from two independent experiments. *P ≤ 0.05; **P ≤ 0.01.

Comment in

References

    1. Morris S. M., Jr., (2002) Regulation of enzymes of the urea cycle and arginine metabolism. Annu. Rev. Nutr. 22, 87–105 - PubMed
    1. Sandler N. G., Mentink-Kane M. M., Cheever A. W., Wynn T. A. (2003) Global gene expression profiles during acute pathogen-induced pulmonary inflammation reveal divergent roles for Th1 and Th2 responses in tissue repair. J. Immunol. 171, 3655–3667 - PubMed
    1. Reece J. J., Siracusa M. C., Scott A. L. (2006) Innate immune responses to lung-stage helminth infection induce alternatively activated alveolar macrophages. Infect. Immun. 74, 4970–4981 - PMC - PubMed
    1. Zimmermann N., King N. E., Laporte J., Yang M., Mishra A., Pope S. M., Muntel E. E., Witte D. P., Pegg A. A., Foster P. S., Hamid Q., Rothenberg M. E. (2003) Dissection of experimental asthma with DNA microarray analysis identifies arginase in asthma pathogenesis. J. Clin. Invest. 111, 1863–1874 - PMC - PubMed
    1. Pesce J. T., Ramalingam T. R., Mentink-Kane M. M., Wilson M. S., El Kasmi K. C., Smith A. M., Thompson R. W., Cheever A. W., Murray P. J., Wynn T. A. (2009) Arginase-1-expressing macrophages suppress Th2 cytokine-driven inflammation and fibrosis. PLoS Pathog. 5, e1000371. - PMC - PubMed

Publication types