. 2013 Aug 15;500(7462):301-6.
doi: 10.1038/nature12446. Epub 2013 Aug 7.

Coordination of bacterial proteome with metabolism by cyclic AMP signalling

Affiliations

Coordination of bacterial proteome with metabolism by cyclic AMP signalling

Conghui You et al. Nature. .

Abstract

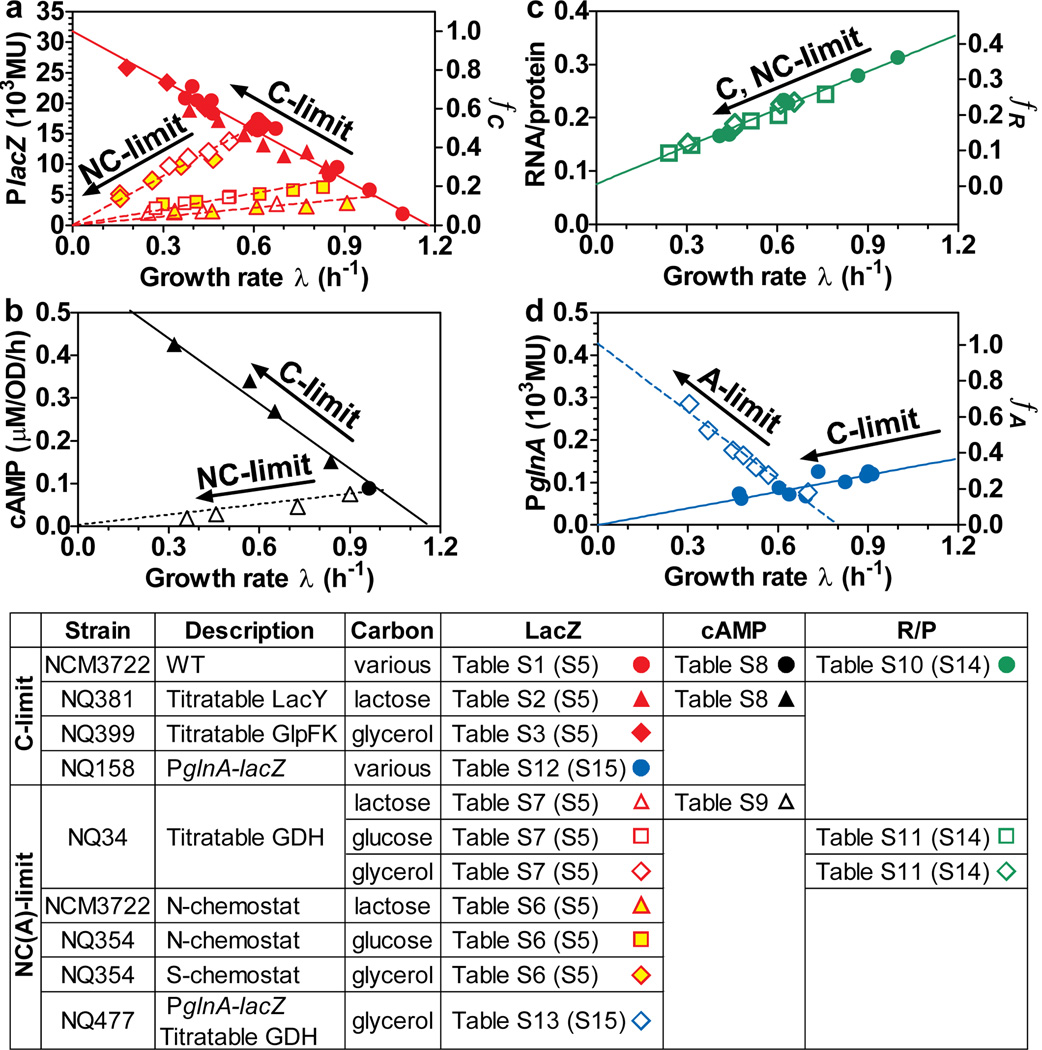
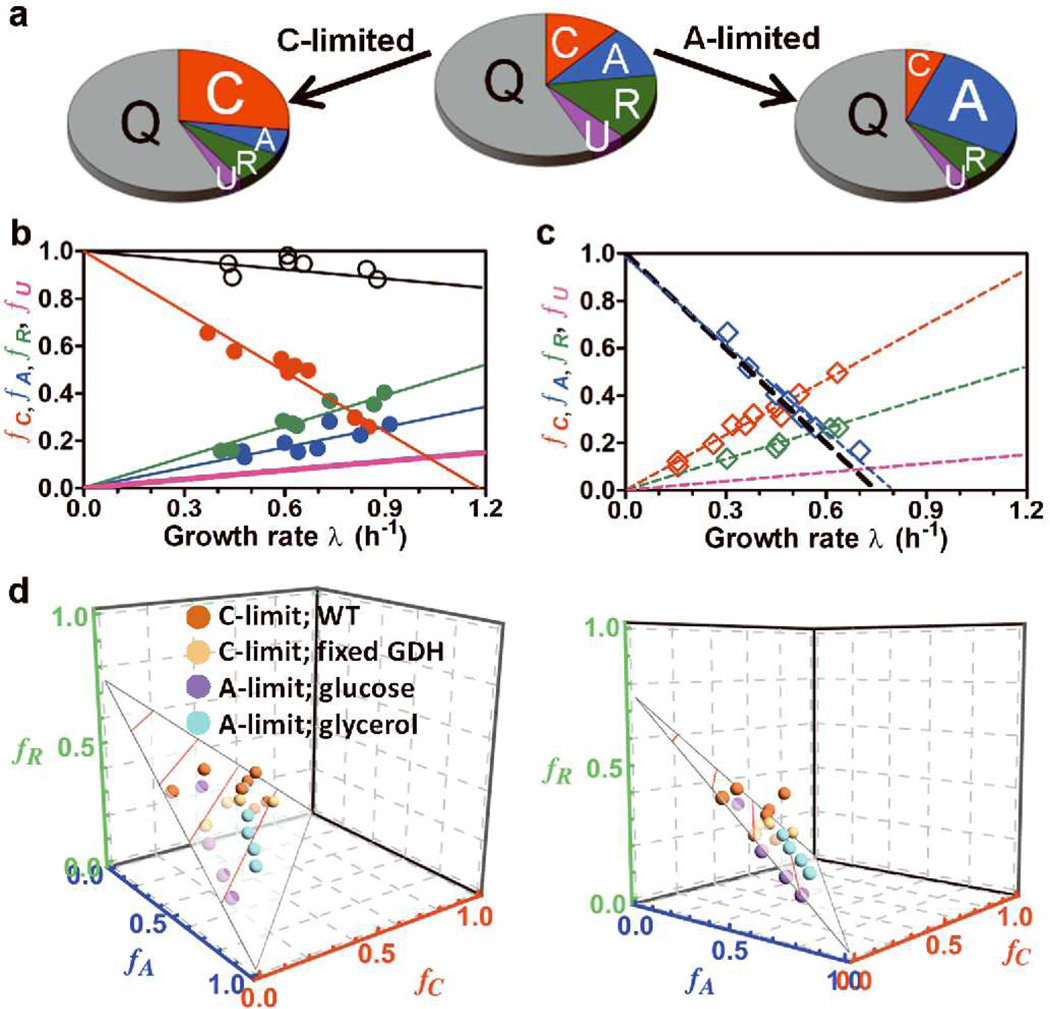
The cyclic AMP (cAMP)-dependent catabolite repression effect in Escherichia coli is among the most intensely studied regulatory processes in biology. However, the physiological function(s) of cAMP signalling and its molecular triggers remain elusive. Here we use a quantitative physiological approach to show that cAMP signalling tightly coordinates the expression of catabolic proteins with biosynthetic and ribosomal proteins, in accordance with the cellular metabolic needs during exponential growth. The expression of carbon catabolic genes increased linearly with decreasing growth rates upon limitation of carbon influx, but decreased linearly with decreasing growth rate upon limitation of nitrogen or sulphur influx. In contrast, the expression of biosynthetic genes showed the opposite linear growth-rate dependence as the catabolic genes. A coarse-grained mathematical model provides a quantitative framework for understanding and predicting gene expression responses to catabolic and anabolic limitations. A scheme of integral feedback control featuring the inhibition of cAMP signalling by metabolic precursors is proposed and validated. These results reveal a key physiological role of cAMP-dependent catabolite repression: to ensure that proteomic resources are spent on distinct metabolic sectors as needed in different nutrient environments. Our findings underscore the power of quantitative physiology in unravelling the underlying functions of complex molecular signalling networks.


Figures

Figure 1
Figure 1. Catabolic and biosynthetic gene expression under nutrient limitations
For clarity, growth conditions and depository of data are summarized in the legend table. Parenthesis indicates the supp. tables containing the parameters of the best-fit lines. (a) Correlation of PlacZ expression with the growth rate under C-limitations (solid symbols) and NC-limitations (open symbols). The left y-axis shows LacZ expression per OD600 (Miller Unit or MU), which is proportional to per total protein; see Supp. Methods and Fig. S14. The right y-axis shows the equivalence in normalized fractions fC (Supp. Note 3). (b) Internal cAMP level as indicated by the cAMP excretion rate (Fig. S11) for cells grown under C- and NC- limitations (filled and open symbols, respectively). (c) RNA/protein ratio for both C- and NC- limited growth (filled and open symbols, respectively). The right y-axis shows the equivalence in normalized fractions fR (Supp. Note 3). (d) PglnA-lacZ expression under C- and A-limited growth (filled and open symbols, respectively). The right y-axis shows the equivalence in normalized fractions fA (Supp. Note 3).
Figure 2
Figure 2. Proteome fractions and the partition model
(a) Illustration of the proteome partition model: Upon C-limitation, the C-sector increases and the A-, R-, U- sectors decrease, while upon A-limitation, the A-sector increases and the C-, R-, U- sectors decrease ; see Supp. Note 1. (b) Normalized responses (fC, fA, fR) indicated by the C-, A-, R- sector reporters upon C-limitation (solid red, green, blue circles respectively from Figs. 1a, 1c, 1d). The black circles show the sum fC + fA + fR at each growth rate; they decrease linearly with the growth rate (black line). The purple line is the predicted U-sector fraction fU based on Eq. [3]. (c) fC, fA, fR upon A-limitation with glycerol as the carbon source (open red, green, blue diamonds respectively from Figs. 1a, 1c, 1d). Taking fU (purple line) to be the same as that in panel b (fU = 0.3· fR), Eq. [3] predicts fA to follow the black line, and blue line shows the best fit. (d) fC, fA, fR for the four sets of C- and A- limited growth conditions characterized (panels b, c and Figs. S19, S20) are plotted in a 3D plot. (Unavailable data for fR, fA are generated from the straight line fit.) Two views are shown. The data are seen to fall on the predicted surface (Eq. [3] with fU = 0.3· fR).
Figure 3
Figure 3. Transient repression by metabolic precursors
(a) A coarse-grained view of metabolism, focusing on the biosynthesis of amino acids from the carbon and nitrogen influxes (JC and JN respectively). Carbon precursors such as α-ketoacids (K) sense the difference between JC and JN. An integral feedback scheme employing the regulation of catabolic and anabolic enzymes (ϕC and ϕN respectively) by K can coordinate these metabolic sectors in a parameter-free manner; see Supp. Note 5 for details. (b) PlacZ-lacZ expression was characterized for wild-type NCM3722 cells grown exponentially in various carbon sources and with 1 mM IPTG to deactivate LacI. At time zero, 20 mM oaa was added; a transient repression period of ~30 min is shaded in grey. PlacUV5-lacZ expression in strain NQ1053 was characterized in a same way (black squares; right y-axis). (c) LacZ expression levels before and during the repression period (Figs. 3b, S23–S27) are summarized by the open and grey bars. Striped bars show the results of PlacUV5-lacZ. (d) cAMP concentrations in the medium were monitored for wild-type cells grown in glycerol and the two PTS-deletion strains, NQ721 (Δpts) and NQ506 (Δ5EI Δpts), grown in lactose. 20 mM oaa was added at time zero. (e) Relative cAMP excretion rates were quantified before and during the repression period; see Supp. Method. In (c) and (e), data were expressed as mean ± s.e.m (n ≥ 3).
Figure 4
Figure 4. Mechanism of cAMP-dependent signalling
(a) oaa transiently repressed PlacZ-lacZ expression in PTS-deleted cells, NQ721 (Δpts) and NQ506 (Δ5EI Δpts), grown exponentially in lactose. 20 mM oaa was supplied at time zero. The response of WT cells to oaa in Fig. 3b (red triangles) was plotted for comparison. (b) The magnitudes of transient repression by oaa and akg were quantified as in Fig. 3c, based on the data in Figs. 4a, S30, S31. (c) Steady state PlacZ-lacZ expression in PTS mutants under various modes of C-limitations; see Table S18 for data and conditions. Dashed lines show the best linear fit (Table S19). The C-line of Fig. 1a is shown in red for reference. (d) in vitro AC activities in strains NQ385 (pts+), NQ976 (Δpts) and NQ977 (Δ5EI Δpts) were assayed with or without 10 mM of various candidate inhibitors; see Supp. Methods for details. These strains are also deleted of the cAMP phosphodiesterase which is not primary to signalling in cAMP-dependent CCR; see Fig. S33. In (b) and (d), data were expressed as mean ± s.e.m (n ≥ 3).

Comment in

References

    1. Laub MT, Goulian M. Specificity in two-component signal transduction pathways. Annu Rev Genet. 2007;41:121–145. - PubMed
    1. Potrykus K, Cashel M. (p)ppGpp: still magical? Annu Rev Microbiol. 2008;62:35–51. - PubMed
    1. Hengge R. Principles of c-di-GMP signalling in bacteria. Nature reviews. Microbiology. 2009;7:263–273. - PubMed
    1. Porter SL, Wadhams GH, Armitage JP. Signal processing in complex chemotaxis pathways. Nature reviews. Microbiology. 2011;9:153–165. - PubMed
    1. Brent R. Cell signaling: what is the signal and what information does it carry? FEBS Lett. 2009;583:4019–4024. - PubMed

Publication types

MeSH terms