. 2013 Oct;41(19):9090-104.
doi: 10.1093/nar/gkt698. Epub 2013 Aug 7.

Direct assessment of transcription fidelity by high-resolution RNA sequencing

Affiliations

Direct assessment of transcription fidelity by high-resolution RNA sequencing

Masahiko Imashimizu et al. Nucleic Acids Res. 2013 Oct.

Abstract

Cancerous and aging cells have long been thought to be impacted by transcription errors that cause genetic and epigenetic changes. Until now, a lack of methodology for directly assessing such errors hindered evaluation of their impact to the cells. We report a high-resolution Illumina RNA-seq method that can assess noncoded base substitutions in mRNA at 10(-4)-10(-5) per base frequencies in vitro and in vivo. Statistically reliable detection of changes in transcription fidelity through ∼10(3) nt DNA sites assures that the RNA-seq can analyze the fidelity in a large number of the sites where errors occur. A combination of the RNA-seq and biochemical analyses of the positions for the errors revealed two sequence-specific mechanisms that increase transcription fidelity by Escherichia coli RNA polymerase: (i) enhanced suppression of nucleotide misincorporation that improves selectivity for the cognate substrate, and (ii) increased backtracking of the RNA polymerase that decreases a chance of error propagation to the full-length transcript after misincorporation and provides an opportunity to proofread the error. This method is adoptable to a genome-wide assessment of transcription fidelity.


Figures

Figure 1.
Figure 1.
Experimental setup for transcription-error analysis. (A) Schematic representation of reverse transcription and two PCR steps used to produce barcoded cDNA libraries. The five libraries were made from each of the RNA samples corresponding to the five transcription conditions (Mg2+, Mn2+, GreAB/Mg2+ and GreAB/Mn2+ for in vitro and E.coli cell). The RT primers ‘a’ and ‘b’ (the green arrowheads) replace transcription errors with the chemical oligonucleotide synthetic errors during reverse transcription step. Similarly, in a course of PCR, the first PCR primers (green and yellow lines) replace (green lines) or dilute by >10-fold (yellow lines) transcription errors in the corresponding regions to which these primers hybridize (shown by empty boxes). A six-bases barcode (purple line) and Illumina-specific sequencing adapters (orange and red lines) are introduced to the libraries during first and second PCR steps. (B) The cDNA and internal control regions in the PCR fragment used for Illumina paired-end sequencing. The lengths and directions of the first and the second sequencing reads are indicated. Both sequencing reads contain ∼20 bases of the primer-hybridizing regions where transcription errors are significantly depleted during cDNA preparation (internal controls). All colors are the same as in panel A, except that the DNA regions lacking the original mRNA are white-shaded. (C) Scatter plot of transition-error rates for Mn2+ and Mg2+ RNA products in vitro. Positions in cDNA and internal control are indicated by red and blue colors. The diagonal dotted lines represent y = 2 x (upper), y = x (middle) and y = 1/2 x (lower). Correlation coefficient (R) of the two samples with or without cutoff value >3 × 10⁻⁴ b−1 is shown. (D) Transition-error rates in the second read (lower) of the paired-end sequencing are higher than those in the first read (upper). Transition-error rates averaged by the five different RNA preparations and the six sequence segments (see panel A) are plotted against DNA positions with the standard deviations. Red line indicates the cutoff value.
Figure 2.
Figure 2.
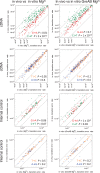
Scatter plots of transition-error rates. The error rates per position in the cDNA and internal control are plotted for error-prone/standard (left column), error-prone/error-proof (middle column) and moderate-error-proof/error-proof (right column) sets of conditions as shown on the top. The error rates ≤3 × 10⁻⁴ b−1 were used for the statistical analysis. P value of two-tailed nonparametric t-test for the two samples is shown. For the cDNA, n = 132 (G→A), n = 142 (C→T), n = 104 (T→C) and n = 162 (A→G). For the internal control, n = 39 (G→A), n = 26 (C→T), n = 30 (T→C) and n = 30 (A→G).
Figure 3.
Figure 3.
Scatter plot of transition-error rates for in vivo and in vitro Mg2+ samples with (left) or without (right) GreA/B in the cDNA (top) and internal control (bottom). All symbols are the same as in Figure 2. The cutoff for the error rates is applied for two-tailed nonparametric t-test, but not for the scatter plots. The n for the t-test is same as in Figure 2.
Figure 4.
Figure 4.
Mn2+-sensitivity and frequency of G→A errors depend on propensity of RNAP to backtrack at the error site. (A) Hierarchical clustering was performed with MeV v4.7.0. G→A error rates exceeding 3 × 10⁻⁴ b−1 at 132 DNA positions are used to generate the clustering diagram. Each error rate is subtracted by the mean of five different RNA preparations to distinguish the error rate difference among the transcription conditions per position. Clusters A–G are indicated by boxes. The 10-nt DNA sequences (nontranscribed strand, 5′-to-3′ direction) where the G→A error occurred at the 3′ RNA end are shown. The number on the left side of each sequence indicates position of G residue analyzed by the RNA-seq. Two sequences from clusters A and F (170 G and 474 G, respectively) that were used for biochemical analyses are underlined. (B) G→A transition rates at the positions 170 G and 474 G in the five RNA preparations analyzed by the RNA-seq. (C) Schematic representations of reversible backtracking of TEC18 bearing the 10-nt sequence of 170G or 474G from +10 to +19 position, where +1 is 5′ end of the RNA. The access of Exo III form the rear end of RNAP is also shown. (D) ExoIII footprinting of the TEC18A and TEC18C. The reaction scheme is shown on the top. The rear-end boundaries of RNAP in the active and backtracked states are shown. The bottom panel shows the 18-nt RNA transcripts in the TECs. The capital letter following the number indicates the base of the 3′ RNA and the RNA length in TEC. AMP-misincorporation at the position 19 is marked by asterisk.
Figure 5.
Figure 5.
Effects of backtracking on the efficiencies of mismatch extension (ME) and intrinsic transcript cleavage, and their dependences on Mn2+. (A) Reaction scheme for AMP misincorporation followed by ME. (B) RNA and downstream nontemplate DNA sequences in the TECs with long (18 nt) and short (8 nt) transcripts used in the assay. (C) Incubations of TEC18C/474 G with the noncognate ATP in the presence of Mg2+ or Mn2+. Arrows indicate the original 18-nt RNA, misincorporation (marked by asterisks) and ME. (D) 5′ RNA shortening to 8-nt length in TEC18C (making TEC8C) increases ME. (E) Quantification of the ME (% of the total fraction in each detection time) from the panels C and D. The curves represent the single-exponential fit of the data; apparent rate constants (k) are shown. Note for lager k in ‘Long, Mg2+’ compared with ‘Long, Mn2+’ condition: This difference is due to the intrinsic transcript cleavage of 19 A* product of misincorporation, which occurs substantially faster in Mg2+ compared with Mn2+. The faster cleavage in Mg2+ leads to apparent earlier than expected saturation of the ME reaction under these conditions. Although the plotting of ME appeared to follow single exponential kinetics, they result from a superposition of 3 different processes of 19 A* misincorporation, 19 A* cleavage and 19 A* extension with the next cognate NMP.
Figure 6.
Figure 6.
A 3′ residue in the nascent transcript determines the G→A error rate. (A) DNA logo derived from a sequence alignment around the dG residues coding for the low or high G→A error rate. Top lowest 10% (left) and top highest 10% (right) of all G→A error rates (<1 × 10⁻³) averaged by five different RNA preparations are used for the analysis. The residue frequencies from n − 2 to n + 1 (G→A error occurs at n site) were plotted with WebLogo (63). Y-axis is not shown as typical log base 2, but it represents the actual number to depict the residue types. (B) DNA/RNA scaffold for testing the effect of dC→dA substitution in the n − 1 site of DNA. TEC18C (n − 1 = C) and TEC18A (n − 1 = A) on the 474 G sequence are shown. (C) Biochemical G→A error rates in TEC18C or 18 A as determined by NTP competition assay (see text for more details) (64,65). (D) Time course of AMP misincorporation for GMP in TEC18C or TEC18A. The curves represent the double exponential (TEC18C) or single exponential (TEC18A) fit of the data; apparent rate constants (k) are shown. The slower misincorporation rate obtained from the double-exponential fitting curve for TEC18C data was related to the intrinsic cleavage of 3′ RNA in this complex.
Figure 7.
Figure 7.
Multiple pathways for control of RNAP fidelity. Transcription error rate is determined by the 3′ RNA–DNA base pair in TEC (preincorporation substrate selection) and by backtracking propensity of RNAP (postincorporation proofreading). The 3′ RNA–DNA base pair controls misincorporation rate of a noncognate substrate (indicated by an asterisk). The DNA sequences such as A/T-rich tracts and protein factors that promote backtracking increase fidelity by decreasing extension of the 3′ RNA error with the next cognate NMP (shaded). The error is corrected by the intrinsic or Gre-assisted transcript cleavage in backtacked TEC. The irreversible backtrack arrest of TEC carrying the 3′ RNA error may derive from the inefficient transcript cleavage in the backtracked complex (the dead-end pathway).

References

    1. Strathern JN, Jin DJ, Court DL, Kashlev M. Isolation and characterization of transcription fidelity mutants. Biochim. Biophys. Acta. 2012;1819:694–699. - PMC - PubMed
    1. Gordon AJ, Halliday JA, Blankschien MD, Burns PA, Yatagai F, Herman C. Transcriptional infidelity promotes heritable phenotypic change in a bistable gene network. PLoS Biol. 2009;7:e44. - PMC - PubMed
    1. Goldsmith M, Tawfik DS. Potential role of phenotypic mutations in the evolution of protein expression and stability. Proc. Natl Acad. Sci. USA. 2009;106:6197–6202. - PMC - PubMed
    1. Paoloni-Giacobino A, Rossier C, Papasavvas MP, Antonarakis SE. Frequency of replication/transcription errors in (A)/(T) runs of human genes. Hum. Genet. 2001;109:40–47. - PubMed
    1. Rodin SN, Rodin AS, Juhasz A, Holmquist GP. Cancerous hyper-mutagenesis in p53 genes is possibly associated with transcriptional bypass of DNA lesions. Mutat. Res. 2002;510:153–168. - PubMed

Publication types

MeSH terms

Substances

Associated data