. 2013 Aug 8;500(7461):175-81.
doi: 10.1038/nature12450.

A visual motion detection circuit suggested by Drosophila connectomics

Affiliations

A visual motion detection circuit suggested by Drosophila connectomics

Shin-ya Takemura et al. Nature. .

Abstract

Animal behaviour arises from computations in neuronal circuits, but our understanding of these computations has been frustrated by the lack of detailed synaptic connection maps, or connectomes. For example, despite intensive investigations over half a century, the neuronal implementation of local motion detection in the insect visual system remains elusive. Here we develop a semi-automated pipeline using electron microscopy to reconstruct a connectome, containing 379 neurons and 8,637 chemical synaptic contacts, within the Drosophila optic medulla. By matching reconstructed neurons to examples from light microscopy, we assigned neurons to cell types and assembled a connectome of the repeating module of the medulla. Within this module, we identified cell types constituting a motion detection circuit, and showed that the connections onto individual motion-sensitive neurons in this circuit were consistent with their direction selectivity. Our results identify cellular targets for future functional investigations, and demonstrate that connectomes can provide key insights into neuronal computations.


Figures

Figure 1
Figure 1
Motion detection and the Drosophila visual system. (a) Rightward motion component of the Hassenstein-Reichardt elementary motion detector (HR EMD) model. Light input (lightning bolt) into the left channel (magenta) is transmitted with an additional delay, τ, relative to that into the right channel (cyan). For a rightwards moving object, signals from both channels will arrive at the multiplication unit closer in time to each other, and therefore become non-linearly enhanced (and vice versa for leftward moving objects). As a result, the model responds preferentially to rightward motion. (b) Alternate Barlow-Levick-like elementary motion detector (BL EMD) model, also preferring rightward motion. Note that the inputs are combined with opposing signs and the delay is now in the right (cyan) channel. (c) Bodian silver-stained horizontal section of the Drosophila melanogaster visual system revealing the four neuropils of the optic lobe. The medulla region of interest (solid rectangle, expanded in d) and the wider imaged volume (dashed rectangle) used to trace into the lobula plate are shown schematically. (d) The 37 μm × 37 μm medulla region of interest is centered on the reference column (red) and six surrounding nearest-neighbor columns (blue). The medulla has ten strata (M1-M10) defined by the arborizations of its cell types. Scale bars: (c) 50 μm, (d) 10 μm (in all 3 directions).
Figure 2
Figure 2
Connectome reconstruction using serial section EM (a) A representative micrograph, one of 2769 from the EM series. (b) Proofread segmentation of the micrograph in (a) into neurite profiles (single colors). (c) Synapses comprise a presynaptic process containing a T-bar ribbon (red arrow) and associated neurites with postsynaptic densities (PSDs) (blue arrowheads) adjacent to the T-bar. A non-synaptic process (green circle) lacks a PSD (in both this and other section planes containing this T-bar). (d) Neurites are reconstructed by linking profiles in consecutive sections (left), to construct a 3D object (right). (e) An example of a neuron reconstructed from EM (left), identified by comparison with the Golgi impregnated cell (center) as type Mi1 and cross-validated by a corresponding genetic single-cell (GSC) labeled neuron (right) (Supplementary Methods). (f) Same as (e) for cell type Tm3. Scale bars: (a–b) 500 nm; (c) 250 nm; (e–f) 10 μm.
Figure 3
Figure 3
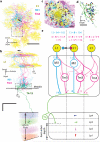
Medulla connectome module. (a) Synaptic connectivity matrix for modular cell types assembled from 2495 synapses (Supplementary Table 1). Three pathways, identified via the Louvain clustering analysis, are labeled by colored boxes. They are named by their primary input neuron(s): the L1 (magenta), L2 (green), and L3/R7/R8 (cyan) pathways. The pathways are ordered by the total number of connections within a pathway, in descending order, and the cell types, within each pathway, are ordered by the sum of their pre- and postsynaptic connections to and from other cell types within their pathway, also in descending order. (b) Medulla connectome module as a 3D graph. Cell types with stronger connections are positioned closer to each other, using the visualization of similarities (VOS) layout algorithm. Three spatially segregated groups are observed that closely match the pathways identified through clustering (coloring of spheres). The dominant direction of signal flow is oriented into the page. Inset in (b) shows the fraction of synaptic connections within the full connectome having a connection weight greater than indicated.
Figure 4
Figure 4
Spatial displacement of Mi1- and Tm3-mediated inputs onto a single T4 (T4–12). (a) Bottom view of dendrites of the Mi1 (cyan) and Tm3 (magenta) neurons presynaptic to T4–12, overlaid on the array of L1 axonal terminals (yellow). The color saturation for each dendritic arbor reflects the number of synaptic contacts made onto T4–12 (see (b, d)). The arrow shows the displacement from the Tm3 center of mass to the Mi1 center of mass computed as illustrated in (e). (b) Side view of T4–12 and its presynaptic Mi1s and Tm3s. Direction preference for a T4 (colored to match the directional preferences in (e)) is determined by the lobula plate arborization layer of the axon terminals. (c) Enlargement (dashed rectangle) from (a) showing reconstructed neurites of Mi1s, Tm3s and L1s (without the weighted colors in (a)), and their synaptic contacts (L1 → Mi1: blue; L1 → Tm3: red). (d) Reconstructed dendritic arbor of T4–12 with synapses from Mi1s (blue) and Tm3s (red). (e) Cartoon of inputs to a single T4 through Mi1s and Tm3s. Mock synaptic weights illustrate how the receptive fields were computed. The center of mass of Mi1 (or Tm3) component, blue (or red) circle, is computed by placing the mass corresponding to the compound synaptic weight from L1 through Mi1 (or Tm3) to T4 at the center of the corresponding column. Scale bars: (a) 8 μm, (b) 8 μm, (c) 1 μm, (d) 4 μm.
Figure 5
Figure 5
Computed displacements for all T4s (n = 19). (a) Displacement vectors for each T4 neuron. Neurons with significant displacement (names in bold) have 95% confidence intervals (ellipses) that exclude the origin (Methods). The vectors are in the ommatidial frame of reference (within ~30° of the visual axes). (b) Top: Mean displacement, computed from (a), averaged over the cells with the same preferred direction of their output. Bottom: The angular difference between the spatial displacement for individual T4 neurons and the preferred direction of its output (for Lp 1–3) correlates with the fraction of missing L1 inputs (Methods). T4s with >15% of missing L1 inputs were omitted from the mean displacements (top). Scale bars: (a) 0.5 and (b) 0.2 of the center-to-center distance between adjacent facets.
Figure 6
Figure 6
Orientation of medulla dendritic arbors of T4 neurons correlates with axon terminal arborization layer in the lobula plate (as in Fig. 4b,e). (a) Four representative medulla dendritic arbors of T4s. The colors represent local dendritic branch orientation. The color map was constructed by assigning colors from each lobula plate layer (Fig. 4e) to the average dominant branch orientation over all neurons in each layer (arrows within color map) and smoothly interpolating. (b) Depth of T4 neuron's axonal arbor within the lobula plate correlates with dominant dendritic branch orientation in the medulla (Methods). In the depth axis, four layers are labeled and the neurons within each layer are colored as in Fig. 4e. The dominant orientations of neurons with axons not traced to the lobula plate are plotted on the x-axis (1: T4–5, 2: T4-4, 3: T4–14), and they are colored with the color of the cluster to which they most likely belong (Supplementary Fig. 5). (c) Transforming the dominant dendritic orientation (± S.E.M.) from the space defined by the array of medulla columns (in layer M10) to the directions in visual space. Scale bars: (a) 5 μm.

Comment in

References

    1. Heisenberg M, Wolf R. Vision in Drosophila. Genetics of Microbehaviour. Springer Verlag; 1984.
    1. Laughlin SB. Progress in Retinal and Eye Research. Vol. 13. Pergamon Press, Ltd.; 1994. Matching coding, circuits, cells, and molecules to signals: General principles of retinal design in the fly's eye; pp. 167–196. Ch. 9.
    1. Strausfeld NJ, Nässel DR. Neuroarchitectures serving compound eyes of Crustacea and insects. In: Autrum H, editor. Comparative Physiology and Evolution of Vision in Invertebrates Handbook of Sensory Physiology. Springer-Verlag; 1981. pp. 1–132.
    1. Hassenstein B, Reichardt W. Systemtheoretische Analyse der Zeit-, Reihenfolgen- und Vorzeichenauswertung bei der Bewegungsperzeption des Rüsselkäfers Chlorophanus. Z. Naturforsch. 1956;11:513–524.
    1. Reichardt W. Autocorrelation, a principle for the evaluation of sensory information by the central nervous system. In: Rosenblith WA, editor. Sensory communication. MIT Press; 1961. pp. 303–317.

Publication types