. 2013 Nov;62(6):901-12.
doi: 10.1093/sysbio/syt054. Epub 2013 Aug 6.

Efficient exploration of the space of reconciled gene trees

Affiliations

Efficient exploration of the space of reconciled gene trees

Gergely J Szöllõsi et al. Syst Biol. 2013 Nov.

Abstract

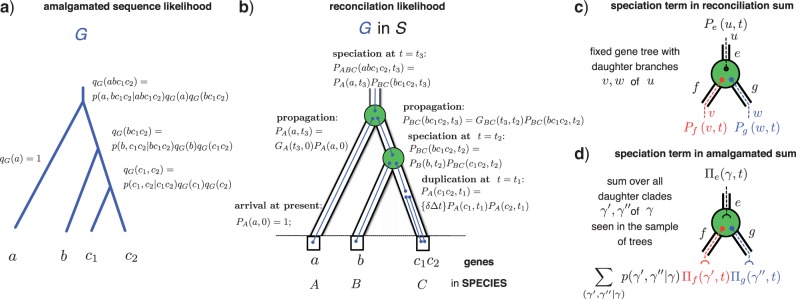
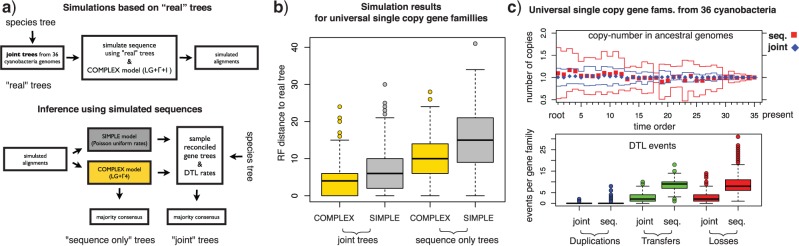
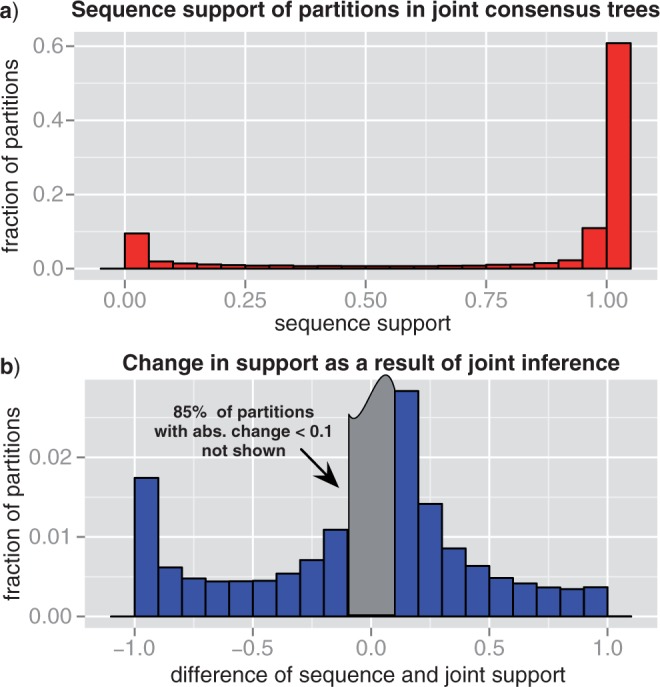
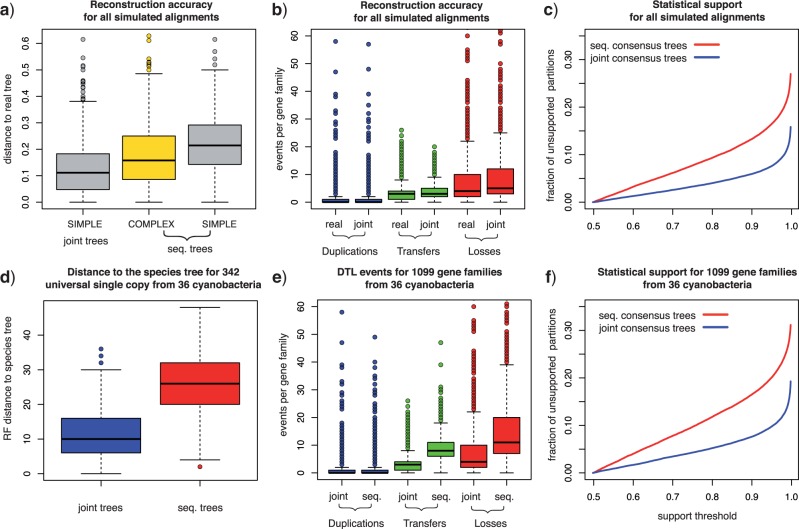
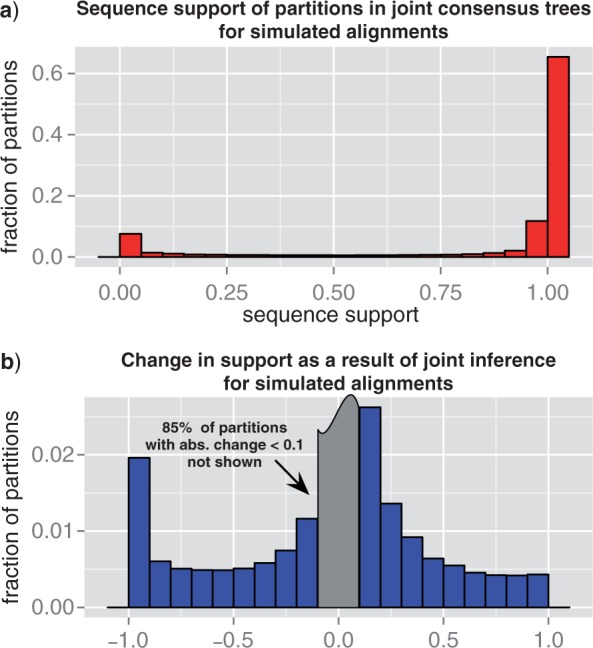
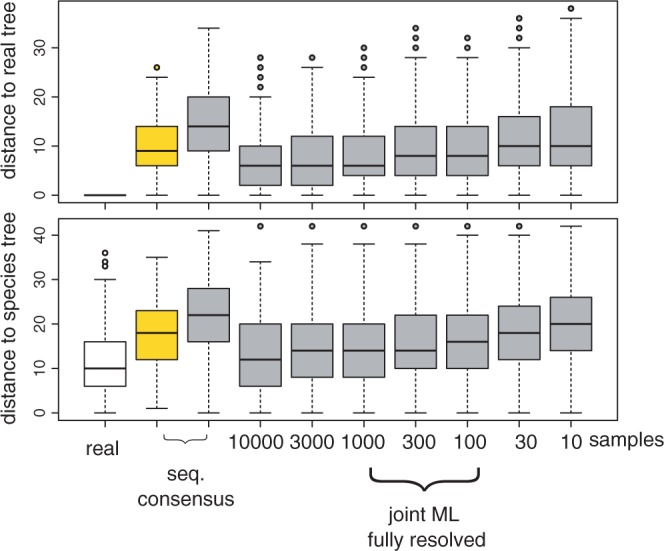
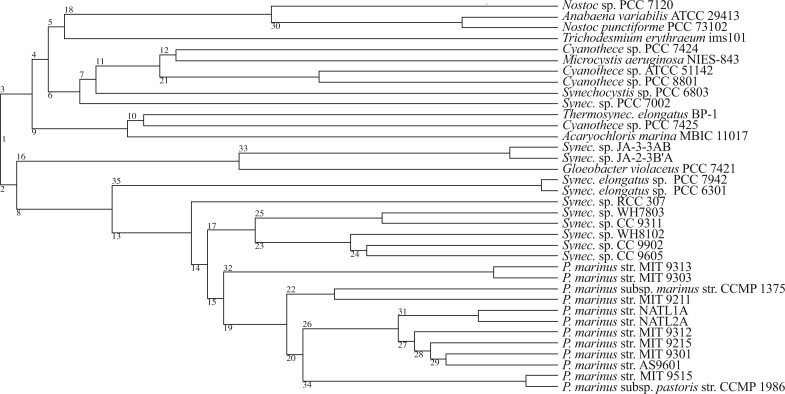
Gene trees record the combination of gene-level events, such as duplication, transfer and loss (DTL), and species-level events, such as speciation and extinction. Gene tree-species tree reconciliation methods model these processes by drawing gene trees into the species tree using a series of gene and species-level events. The reconstruction of gene trees based on sequence alone almost always involves choosing between statistically equivalent or weakly distinguishable relationships that could be much better resolved based on a putative species tree. To exploit this potential for accurate reconstruction of gene trees, the space of reconciled gene trees must be explored according to a joint model of sequence evolution and gene tree-species tree reconciliation. Here we present amalgamated likelihood estimation (ALE), a probabilistic approach to exhaustively explore all reconciled gene trees that can be amalgamated as a combination of clades observed in a sample of gene trees. We implement the ALE approach in the context of a reconciliation model (Szöllősi et al. 2013), which allows for the DTL of genes. We use ALE to efficiently approximate the sum of the joint likelihood over amalgamations and to find the reconciled gene tree that maximizes the joint likelihood among all such trees. We demonstrate using simulations that gene trees reconstructed using the joint likelihood are substantially more accurate than those reconstructed using sequence alone. Using realistic gene tree topologies, branch lengths, and alignment sizes, we demonstrate that ALE produces more accurate gene trees even if the model of sequence evolution is greatly simplified. Finally, examining 1099 gene families from 36 cyanobacterial genomes we find that joint likelihood-based inference results in a striking reduction in apparent phylogenetic discord, with respectively. 24%, 59%, and 46% reductions in the mean numbers of duplications, transfers, and losses per gene family. The open source implementation of ALE is available from https://github.com/ssolo/ALE.git.


Figures

Figure 1
Figure 1
Estimating the joint likelihood using amalgamation. a) Based on a sample of gene trees, CCPs are used to estimate the posterior probability of a gene tree G that can be amalgamated from clades present in the sample (some terms are not shown). b) An evolutionary scenario reconciling G with the species tree S that involves a duplication and two speciations. The probability of a scenario, here the probability PABCD(abc1c2,t3) of seeing the root of G at the root of S calculated using reconciliation events that draw G into S (some terms not shown). In general, we do not know the evolutionary scenario and must sum over all possible ways to draw G into S to calculate the reconciliation likelihood (Szöllősi et al. 2013). c) The sum over reconciliations carried out recursively using a set of reconciliation events. We show one such event, a speciation, together with the corresponding term in the probability Pe (u,t) of seeing gene tree branch u in branch e of S at time t. d) To extend the recursion to sum over trees that can be amalgamated, we replace u by the corresponding clade γ and sum over all pairs of complementary subclades γ, γ present in the gene tree sample.
Figure 2
Figure 2
Validating joint likelihood-based inference. a) We (i) reconstructed reconciled gene trees that maximise the joint likelihood using homologous gene families from 36 cyanobacterial genomes together with the species tree show in Figure A.4; (ii) simulated sequences using the reconstructed “real” trees and a COMPLEX model of sequence evolution; (iii) sampled gene tree topologies using both a SIMPLE model and the COMPLEX model; (iv) attempted to reconstruct the “real” trees from the simulated sequences using only the sequence alone, and using the joint likelihood together with the species tree for samples from both the SIMPLE and the COMPLEX models. b) The Robinson-Foulds distance to the real trees demonstrates that trees reconstructed from simulated sequences using the joint likelihood are more accurate than those reconstructed based on the sequence alone regardless of the model of sequence evolution used. c) In the top panel, we compare the distribution of the number of genes in ancestral genomes based on reconciliations of gene trees reconstructed from 342 universal single-copy cyanobacterial gene families. The mean number of copies for joint (diamonds, blue online) and sequence trees (squares, red online) is plotted together with the standard deviation (dark and light gray lines, blue and red online). The time order of the speciations corresponds to Figure 3 of Szöllősi et al. (2012). In the lower panel, we compare the number of Duplication, Transfer, and Loss events needed to reconcile joint and sequence trees. For details of the inferences presented see Appendix 1.
Figure 3
Figure 3
Statistical support for 1099 gene trees from 36 cyanobacteria. We calculated the statistical support of bipartitions as their frequency in MCMC samples based on both the joint likelihood and sequence alone. a) Shows the distribution of sequence-only support for bipartitions present in the joint majority consensus trees. b) Presents the distribution of the difference between sequence-only and joint support for all bipartitions.
Figure A.1.
Figure A.1.
Results of joint likelihood-based reconstruction for simulated and real data. a) The distribution of normalized Robinson-Foulds distance to the real tree used to simulate sequences, defined as the distance divided by its maximum possible value in each gene tree, for all simulated gene families. Joint inference-based on the COMPLEX model was only performed for single-copy universal families (cf. Fig. 2b). b) Comparison of the distribution of DTL events for all simulated gene families. Some points fall outside the range of the ordinate. c) The fraction of bipartitions in majority consensus trees with statistical support over a given threshold for all simulated gene families. d) Robinson-Foulds distance to the species tree for 342 single-copy universal gene families from 36 cyanobacterial genomes. e) DTL events for 1099 gene families from 36 cyanobacterial genomes. Some points fall outside the range of the ordinate. f) The fraction of bipartitions in majority consensus trees with statistical support over a given threshold for 1099 gene families from 36 cyanobacterial genomes.
Figure A.2.
Figure A.2.
Statistical support for simulated gene families. We calculated the statistical support of bipartitions as their frequency in MCMC samples based on both the joint likelihood and sequence alone. a) Shows the distribution of sequence-only support for bipartitions present in the joint majority consensus trees. b) Presents the distribution of the difference between sequence-only and joint support for all bipartitions.
Figure A.3.
Figure A.3.
Reconstruction accuracy for different sample sizes. To examine the accuracy of reconstructions for simulated data, we used ALEml to recover the ML reconciled trees for 342 universal single-copy families from simulated sequences. In both the top and bottom panel, the first set values in white corresponds to real trees. The second and third set of values were obtained from sequence-only samples for respectively the COMPLEX and SIMPLE models of sequence evolution. The seven remaining set of values correspond to ALEml estimates of the ML reconciled trees for samples of 10, 30, 100, 300, 1000, 3000, 10 000 gene tree chosen randomly and without replacement.
Figure A.4.
Figure A.4.
Chronologically ordered species tree used in gene tree inference. ML chronologically ordered species phylogeny based on 36 genomes with 8 332 homologous gene families from (Szöllősi et al. 2012).

References

    1. Akerborg O., Sennblad B., Lagergren J. Birth-death prior on phylogeny and speed dating. BMC Evol. Biol. 2008;8:77. - PMC - PubMed
    1. Akerborg O., Sennblad B., Arvestad L., Lagergren J. Simultaneous Bayesian gene tree reconstruction and reconciliation analysis. Proc. Natl Acad. Sci. USA. 2009;106:5714–5719. - PMC - PubMed
    1. Boussau B., Daubin V. Genomes as documents of evolutionary history. Trends Ecol. Evol. 2010;25:224–232. - PubMed
    1. Boussau B., Szöllősi G. J., Duret L., Gouy M., Tannier E., Daubin V. Genome-scale coestimation of species and gene trees. Genome Res. 2012;23:323–330. - PMC - PubMed
    1. Criscuolo A., Gribaldo S. Large-scale phylogenomic analyses indicate a deep origin of primary plastids within cyanobacteria. Mol. Biol. Evol. 2011;28:3019–3032. - PubMed

Publication types