

Association of metabolic risk factors with cartilage degradation assessed by T2 relaxation time at the knee: data from the osteoarthritis initiative
- PMID: 23926027
- PMCID: PMC4144858
- DOI: 10.1002/acr.22093
Association of metabolic risk factors with cartilage degradation assessed by T2 relaxation time at the knee: data from the osteoarthritis initiative
Abstract
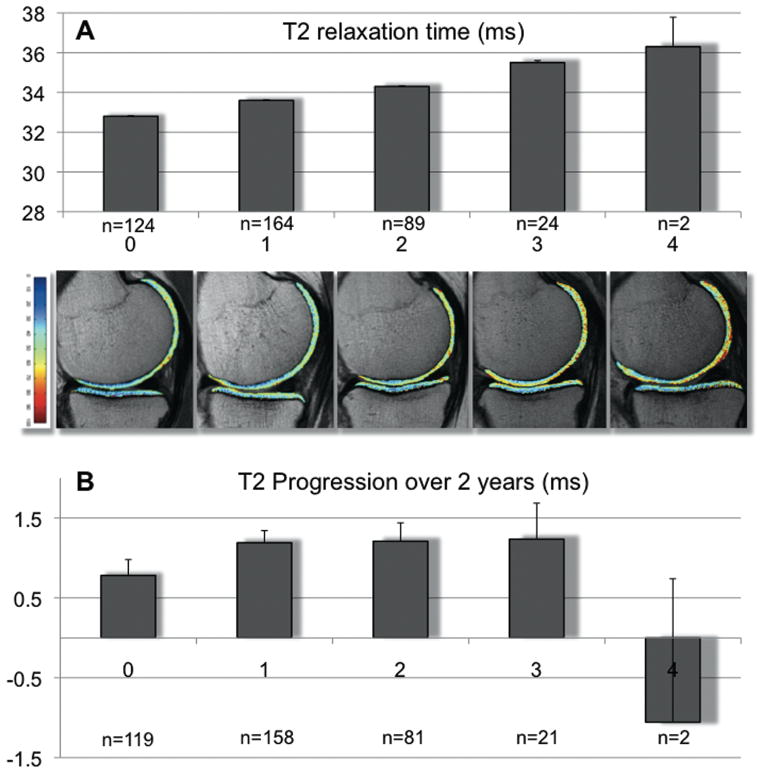
Objective: To evaluate the association of metabolic risk factors with severity and 2-year progression of early degenerative cartilage changes at the knee, measured with T2 relaxation times in middle-aged subjects from the Osteoarthritis Initiative.
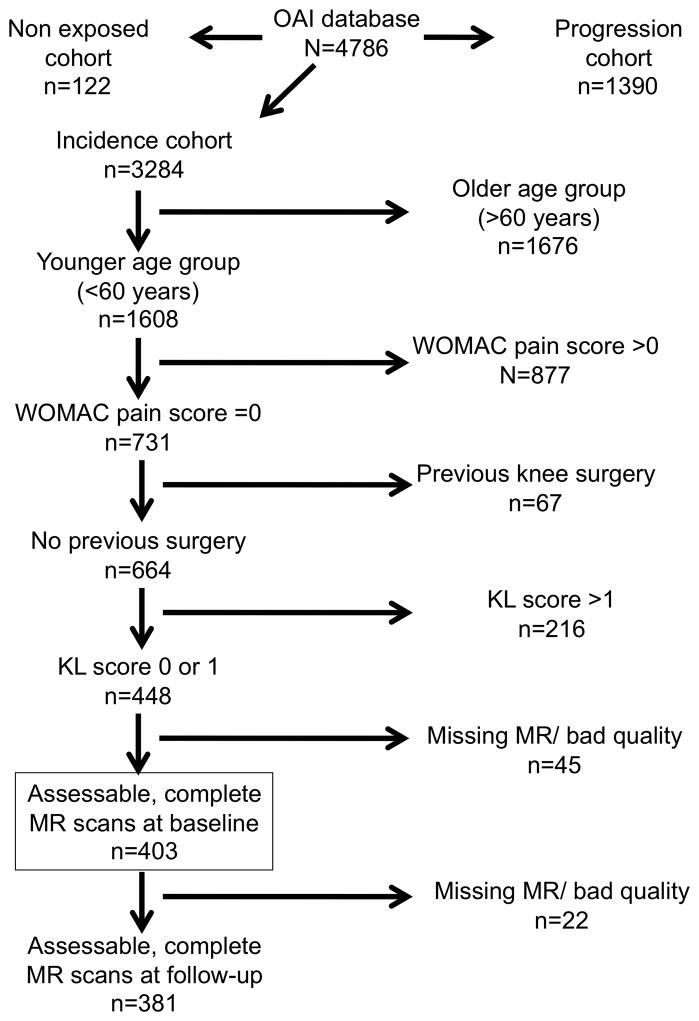
Methods: Cartilage segmentation and T2 map generation were performed in knee 3T magnetic resonance images from 403 subjects ages 45-60 years without radiographic osteoarthritis (OA). The influence of risk factors on baseline T2 and longitudinal progression of T2 was analyzed using linear regression, adjusting for age, sex, and other OA risk factors.
Results: Four metabolic risk factors, i.e., high abdominal circumference (P < 0.001), hypertension (P = 0.041), high fat consumption (P = 0.023), and self-reported diabetes mellitus (P = 0.010), were individually associated with higher baseline T2. When the 4 metabolic risk factors were considered in a multivariate regression model, higher T2 remained significantly associated with abdominal circumference (P < 0.001) and diabetes mellitus (P = 0.026), and there was a trend for high fat consumption (P = 0.096). For the individual risk factors, only diabetes mellitus remained associated with higher baseline T2 after adjustment for body mass index (BMI). After adjustment for BMI, baseline T2 increased in a dose-response manner with the number of metabolic risk factors present (P = 0.032 for linear trend), and subjects with ≥3 metabolic factors (versus <3) had significantly higher baseline T2 (mean difference 1.2 msec [95% confidence interval 0.3, 2.1]; P = 0.011). Metabolic risk factors were not significantly associated with increases in T2 during followup.
Conclusion: Metabolic risk factors are associated with higher T2, suggesting that increased cartilage degeneration may be caused by modifiable metabolic disorders.
Copyright © 2013 by the American College of Rheumatology.
Conflict of interest statement
There is no conflict of interest for any of the authors.
Figures
References
-
- Felson DT, Lawrence RC, Dieppe PA, Hirsch R, Helmick CG, Jordan JM, et al. Osteoarthritis: new insights. Part 1: the disease and its risk factors. Ann Intern Med. 2000;133(8):635–46. - PubMed
-
- Oliveria SA, Felson DT, Reed JI, Cirillo PA, Walker AM. Incidence of symptomatic hand, hip, and knee osteoarthritis among patients in a health maintenance organization. Arthritis Rheum. 1995;38(8):1134–41. - PubMed
-
- Burstein D, Gray M. New MRI techniques for imaging cartilage. J Bone Joint Surg Am. 2003;85-A(Suppl 2):70–7. - PubMed
Publication types
MeSH terms
Substances
Grants and funding
LinkOut - more resources
Full Text Sources
Other Literature Sources
Medical
