. 2013 Nov;110(9):2007-18.
doi: 10.1152/jn.00333.2013. Epub 2013 Aug 7.

Neural mechanisms of speed perception: transparent motion

Affiliations

Neural mechanisms of speed perception: transparent motion

Bart Krekelberg et al. J Neurophysiol. 2013 Nov.

Abstract

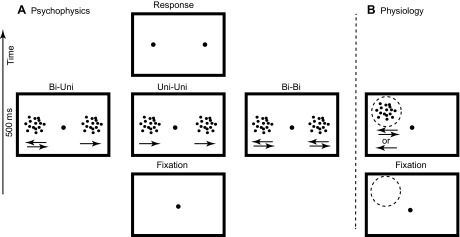
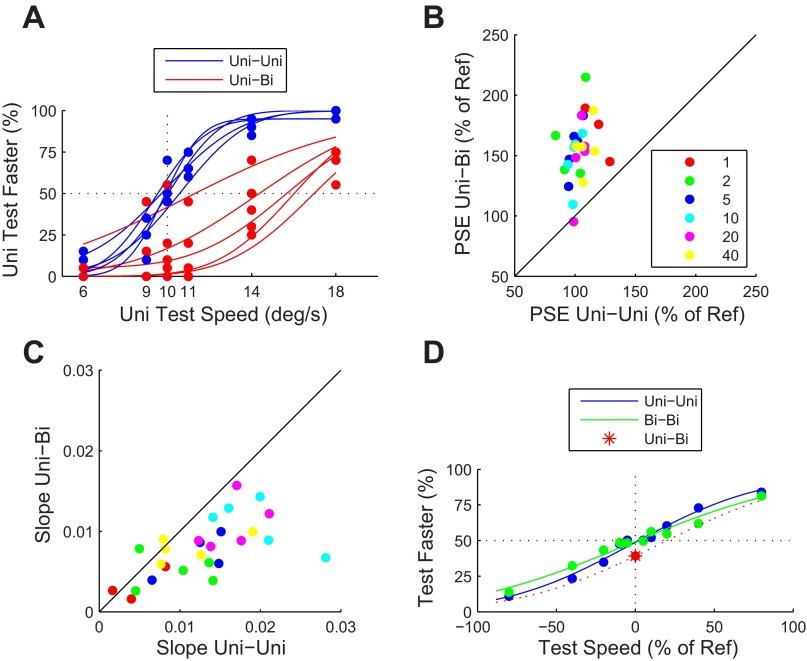
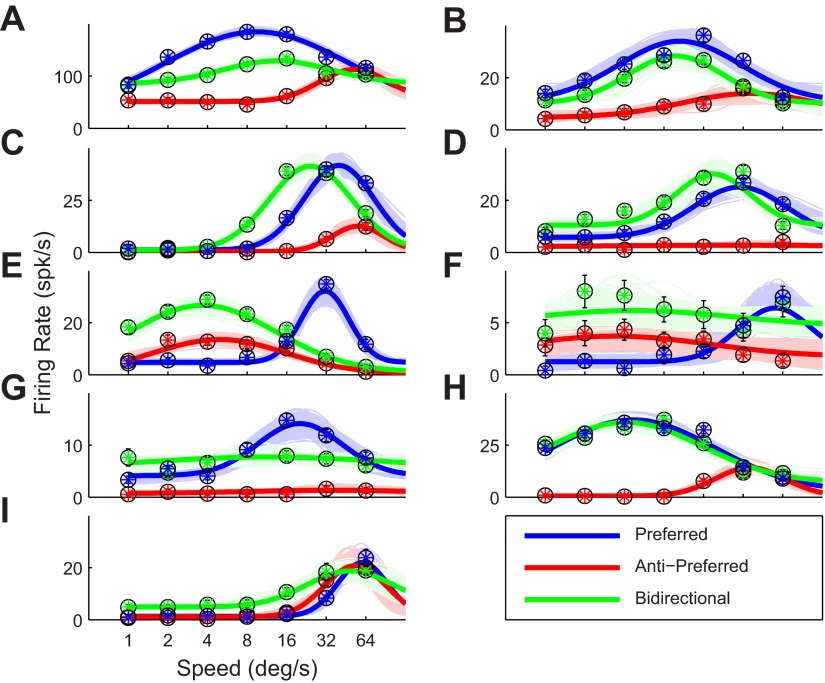
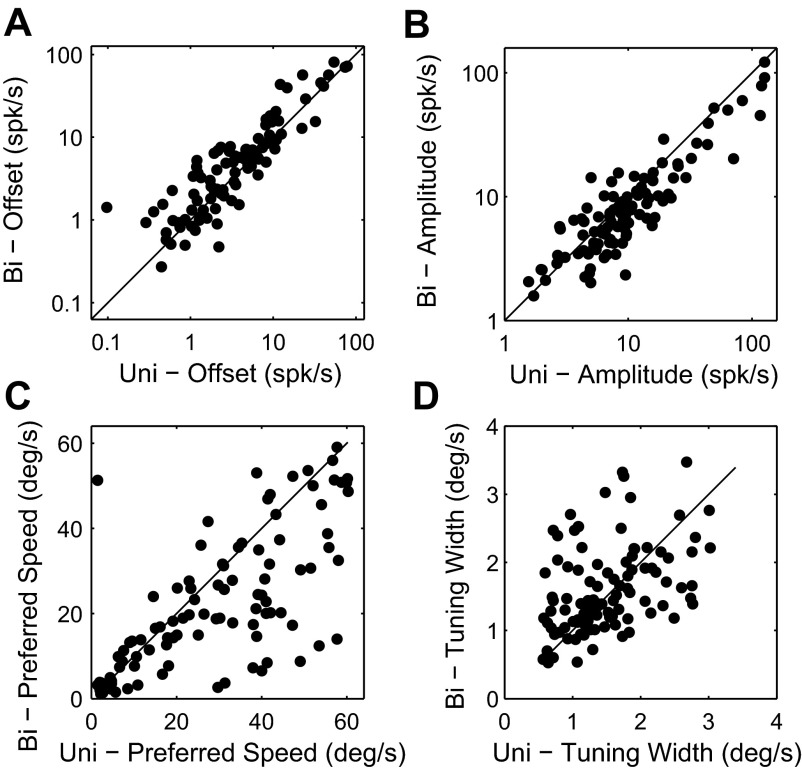
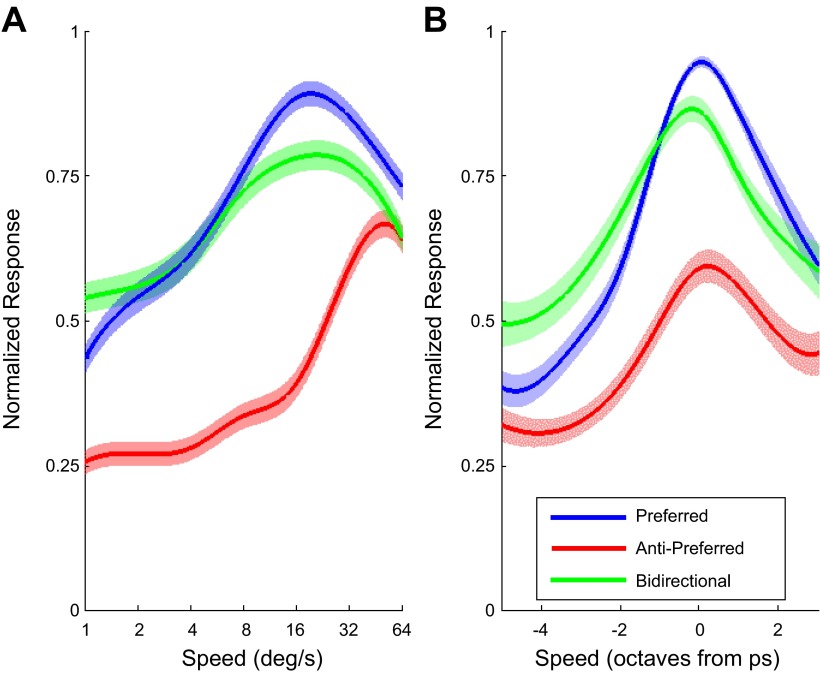
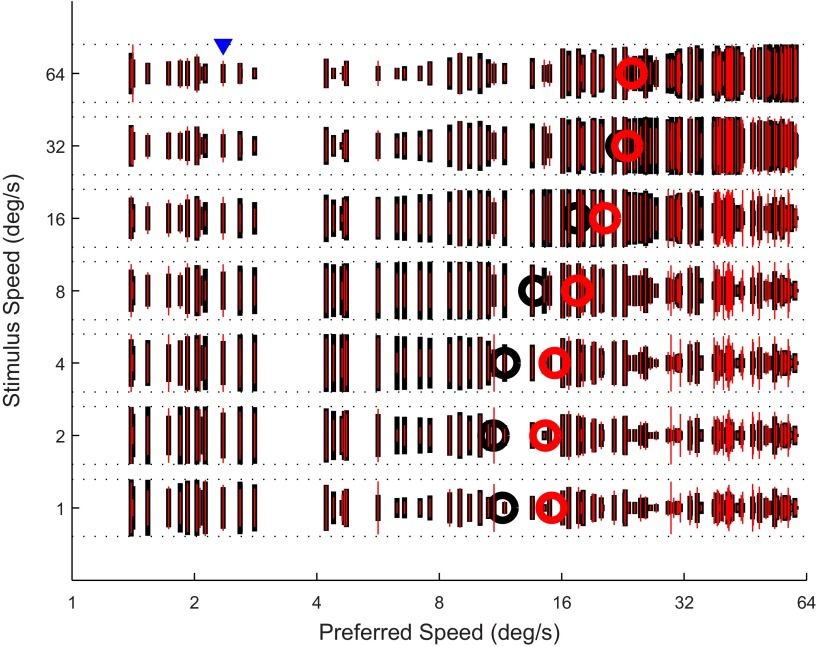
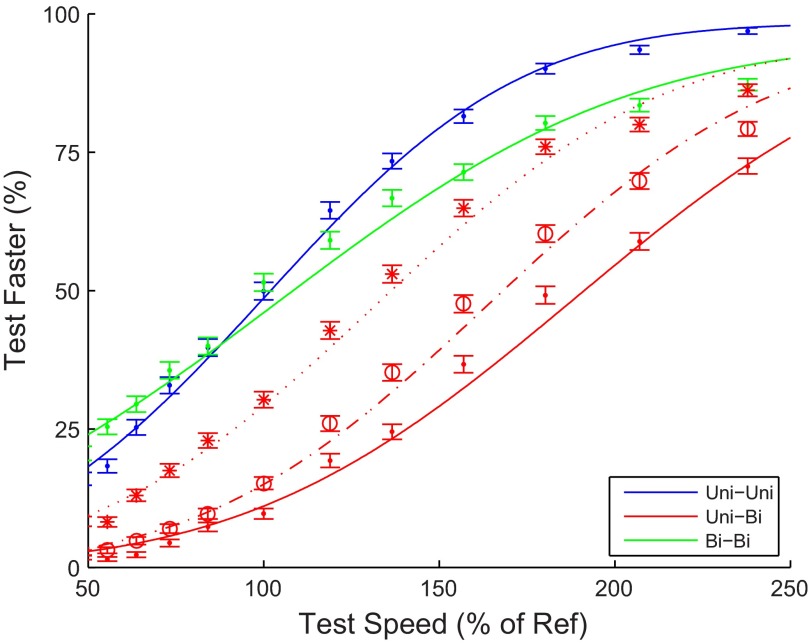
Visual motion on the macaque retina is processed by direction- and speed-selective neurons in extrastriate middle temporal cortex (MT). There is strong evidence for a link between the activity of these neurons and direction perception. However, there is conflicting evidence for a link between speed selectivity of MT neurons and speed perception. Here we study this relationship by using a strong perceptual illusion in speed perception: when two transparently superimposed dot patterns move in opposite directions, their apparent speed is much larger than the perceived speed of a single pattern moving at that physical speed. Moreover, the sensitivity for speed discrimination is reduced for such bidirectional patterns. We first confirmed these behavioral findings in human subjects and extended them to a monkey subject. Second, we determined speed tuning curves of MT neurons to bidirectional motion and compared these to speed tuning curves for unidirectional motion. Consistent with previous reports, the response to bidirectional motion was often reduced compared with unidirectional motion at the preferred speed. In addition, we found that tuning curves for bidirectional motion were shifted to lower preferred speeds. As a consequence, bidirectional motion of some speeds typically evoked larger responses than unidirectional motion. Third, we showed that these changes in neural responses could explain changes in speed perception with a simple labeled line decoder. These data provide new insight into the encoding of transparent motion patterns and provide support for the hypothesis that MT activity can be decoded for speed perception with a labeled line model.

Keywords: labeled line; macaque monkey; middle temporal area; motion perception; speed coding.


Figures

Fig. 1.
Fig. 1.
Experimental paradigms. A: sequence of events in the paradigm used for the behavioral experiments. Subjects fixated a red dot, and 2 patterns appeared for 500 ms. In the human behavioral experiments there were 2 conditions. In the first condition a bidirectional motion pattern (2 dot patterns transparently moving in opposite directions) and a unidirectional motion pattern were shown (bi-uni). In the second condition 2 unidirectional motion patterns were shown (uni-uni). In the monkey experiments there was a third condition in which 2 bidirectional motion patterns were shown (bi-bi). In the monkey experiments the bi-uni condition was only shown for a small subset of trials and rewarded randomly. Subjects were instructed to indicate the pattern that moved fastest by a key press (human) or an eye movement to 1 of 2 targets (monkey). B: in the physiological experiments 1 pattern was presented in the receptive field (indicated by dashed line). The only behavioral requirement for the monkey was to fixate the red spot for the duration of the trial.
Fig. 2.
Fig. 2.
Perceptual effects of transparency. A: psychometric curves for 5 human subjects. In the uni-uni condition, the subjects compared 2 patches of unidirectional motion, one with a fixed (reference) speed of 10°/s and the other with the variable speed shown on x-axis. In the uni-bi condition, the subjects compared a unidirectional test speed (x-axis) to a bidirectional reference moving at 10°/s. The clear rightward shift of the point of subjective equivalence (PSE) in the uni-bi conditions represents a strong overestimation of the perceived speed of the bidirectional reference. The intersection of the dotted black lines indicates the PSE for veridical speed perception. B: comparison of PSE in the uni-uni and uni-bi conditions for a range of reference speeds. Each data point represents data from a single subject for a single reference speed. Reference speeds (°/s) are color coded according to the key. This plot confirms that the effect shown in A (overestimation of bidirectional speed) was found consistently, and across the range of reference speeds. C: comparison of the sensitivity (the slope of the psychometric function in A at the PSE) in the uni-uni and uni-bi conditions for a range of reference speeds. Sensitivity was consistently higher in the uni-uni condition. D: behavioral data from 1 monkey subject (monkey M). The uni-uni and uni-bi conditions were identical to those of the human subjects. In the bi-bi condition monkey M compared the speed of a bidirectional test stimulus with the speed of a bidirectional reference. The data were averaged over reference speeds, and therefore the test speed on the x-axis is expressed as % of the reference speed. The data show that monkey M was less sensitive for the bi-bi comparison than the uni-uni comparison. Just like the human subjects, monkey M overestimated the speed of bidirectional stimuli compared with unidirectional reference patterns (uni-bi, red asterisk; error bars representing the 95% confidence limits have a length of 4%, which is smaller than the marker). The red dotted line is a psychometric function whose PSE was chosen to match with the uni-bi performance, while the slope was estimated jointly from the uni-uni and bi-bi trials. The intersection of the dotted black lines indicates the PSE for veridical speed perception.
Fig. 3.
Fig. 3.
Speed tuning curves of 9 example neurons from area MT. In all conditions the dot patterns (in both preferred and antipreferred directions) were moving at the speed indicated on the x-axis. A–I: 9 cells that span the range of effects we found. Error bars on the data points indicate SE. The solid curves represent the best fit; the colored areas around the curves represent the family of tuning curves consistent with the data (see materials and methods). Consistent with previous reports (Snowden et al. 1991), many cells responded less to bidirectional motion than to unidirectional motion. This suppression, however, was not constant across speeds, and most cells also showed enhanced responses to bidirectional motion of certain speeds.
Fig. 4.
Fig. 4.
Cell-by-cell comparison of tuning parameters. This plot contains only significantly tuned cells (n = 103). A: comparison of the speed-independent (i.e., untuned) response for bidirectional stimuli vs. unidirectional stimuli moving in the preferred direction (offset parameter: α in Eq. 1). B: comparison of the tuning amplitude (β). C: comparison of the preferred speed (δ). D: comparison of the speed tuning width (σ). This figure shows that when a bidirectional stimulus was shown MT neurons typically responded more to all speeds (A) but with a reduced amplitude (B). In addition, most cells preferred lower speeds in bidirectional motion patterns (C).
Fig. 5.
Fig. 5.
Suppression and enhancement. Data points show the median suppression index (SI; y-axis) as a function of the median direction selectivity index (DSI; x-axis). These averages were determined after aligning the tuning curves to the preferred speed (i.e., based on the data shown in Fig. 6B); this allows us to label each data point with the difference between stimulus speed and preferred speed (Δspeed). Error bars show SE across the population. This figure shows that SI depends both on DSI and on Δspeed: suppression increased with direction selectivity but, in addition, decreased for speeds further from the preferred speed.
Fig. 6.
Fig. 6.
Population average speed tuning. A: normalized firing rate averaged over all cells (n = 126). Consistent with the cell-by-cell comparison, bidirectional patches sometimes evoke reduced responses (especially near the preferred speed) but sometimes enhanced responses (at low speeds). B: normalized firing rate after aligning the preferred speeds of each cell. The response to bidirectional patterns was suppressed near the preferred speed and enhanced at lower speeds and showed a reduction in preferred speed.
Fig. 7.
Fig. 7.
MT population activity in response to uni- and bidirectional motion patterns. Each vertical line represents the activity of a single neuron in our sample. Black lines represent the response to unidirectional motion and red lines the response to bidirectional motion. Neurons are sorted by their preferred speed along the x-axis, and stimulus speed is represented along the y-axis. As an example, the arrowhead highlights the response of a neuron with a preferred speed just above 2°/s to stimuli moving at 64°/s. Its response to unidirectional motion (black vertical line) is much less than its maximum response (indicated by horizontal dashed lines). The vertical red line shows that this neuron responds more strongly to bidirectional motion (at 64°/s). (Black lines are thick only to allow us to overlay the response to bidirectional motion with the thin red lines). The circles indicate the decoded speed for each stimulus as determined by the labeled line model (black, unidirectional motion; red, bidirectional motion). This graph shows how increasing the stimulus speed (bottom to top along y-axis) shifts the population activity from low-speed-preferring neurons to high-speed-preferring neurons (left to right along x-axis). This underlies the model's ability to decode speed from the population.
Fig. 8.
Fig. 8.
Speed discrimination based on a labeled line model and MT responses. The model used only the responses of 126 MT neurons to determine whether the test patch (moving at speed represented on x-axis) moved faster than the reference patch (moving at a fixed speed of 10°/s). These simulated behavioral experiments match the behavioral experiments shown in Fig. 2. The figure shows that the decoder performed the uni-uni task at a high level of performance. The same decoder, however, had reduced sensitivity for bidirectional stimuli and overestimated the speed of bidirectional patterns compared with unidirectional patterns (red solid line). The dotted and dashed red lines show the results of the bi-uni task when the label of the neurons was based on the preferred speed for bidirectional patterns or the average of the 2 motion types, respectively. These results are in good qualitative agreement with the human and monkey behavioral data of Fig. 2 and support the view that MT responses, decoded with a labeled line decoder, could indeed underlie the perception of speed in uni- and bidirectional patterns.

Similar articles

Cited by

References

    1. Adelson EH, Bergen JR. Spatiotemporal energy models for the perception of motion. J Opt Soc Am A 2: 284–299, 1985 - PubMed
    1. Born RT, Bradley DC. Structure and function of visual area MT. Annu Rev Neurosci 28: 157–189, 2005 - PubMed
    1. Boyraz P, Treue S. Misperceptions of speed are accounted for by the responses of neurons in macaque cortical area MT. J Neurophysiol 105: 1199–1211, 2011 - PMC - PubMed
    1. Britten KH, Heuer HW. Spatial summation in the receptive fields of MT neurons. J Neurosci 19: 5074–5084, 1999 - PMC - PubMed
    1. Chase SM, Young ED. First-spike latency information in single neurons increases when referenced to population onset. Proc Natl Acad Sci USA 104: 5175–5180, 2007 - PMC - PubMed

Publication types

LinkOut - more resources