Comparative Study
. 2013 Oct 1;305(7):R840-53.
doi: 10.1152/ajpregu.00297.2013. Epub 2013 Aug 7.

Post-oral appetite stimulation by sugars and nonmetabolizable sugar analogs

Affiliations
Comparative Study

Post-oral appetite stimulation by sugars and nonmetabolizable sugar analogs

Steven Zukerman et al. Am J Physiol Regul Integr Comp Physiol. .

Abstract

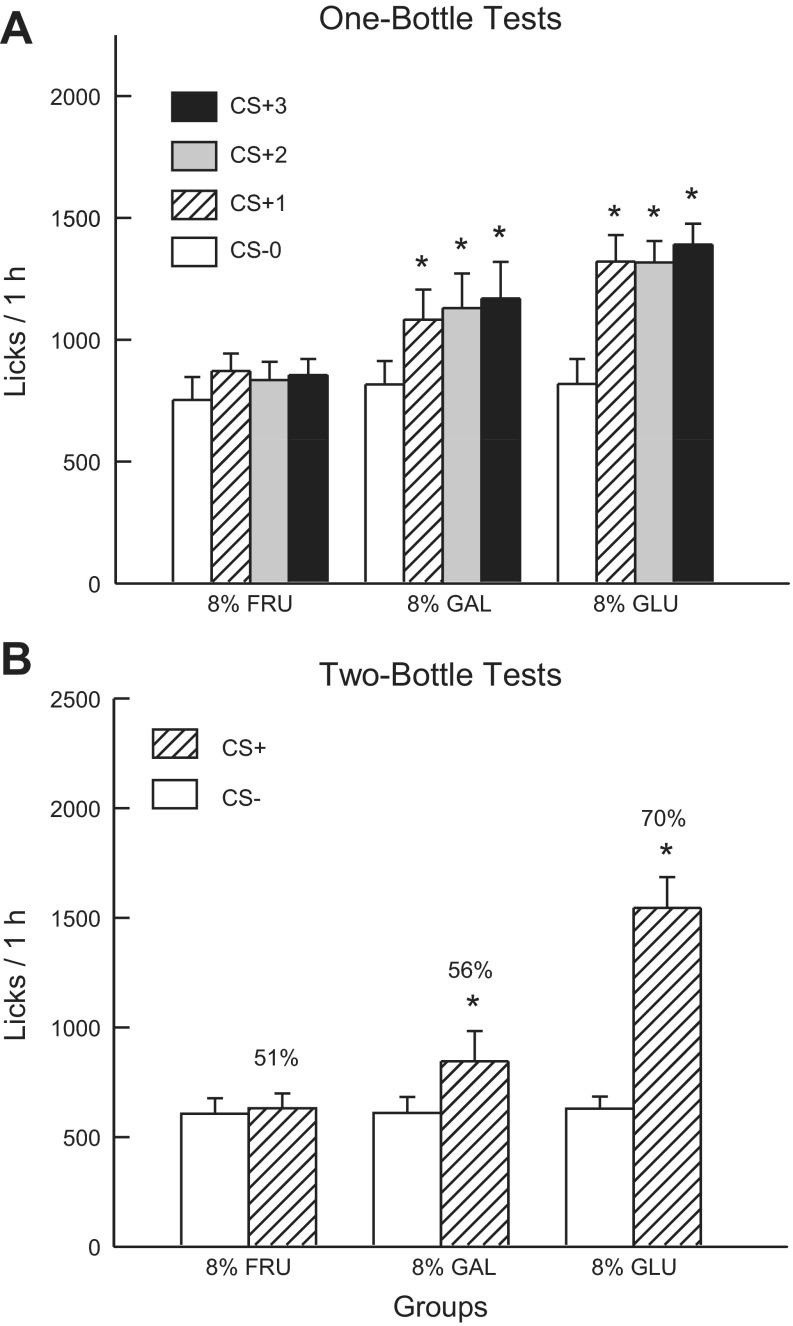
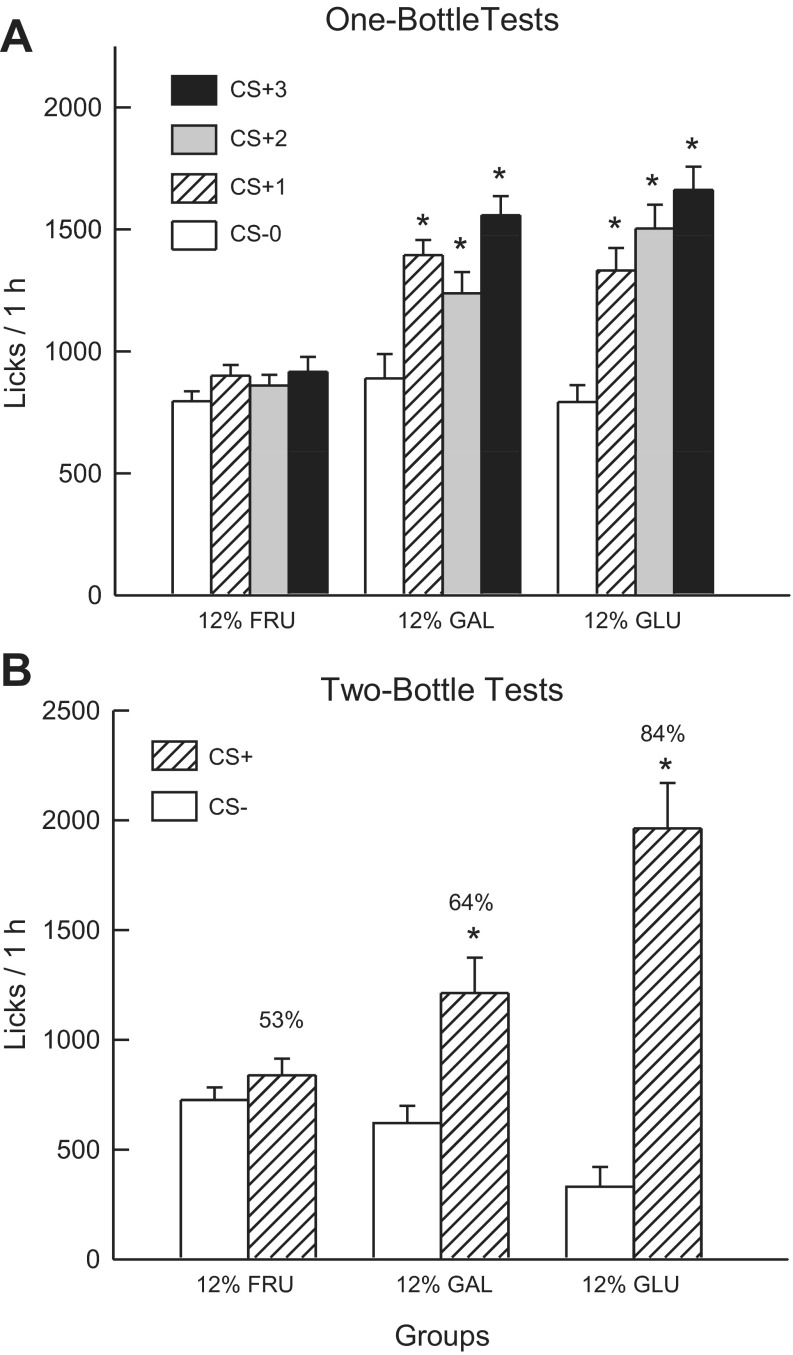
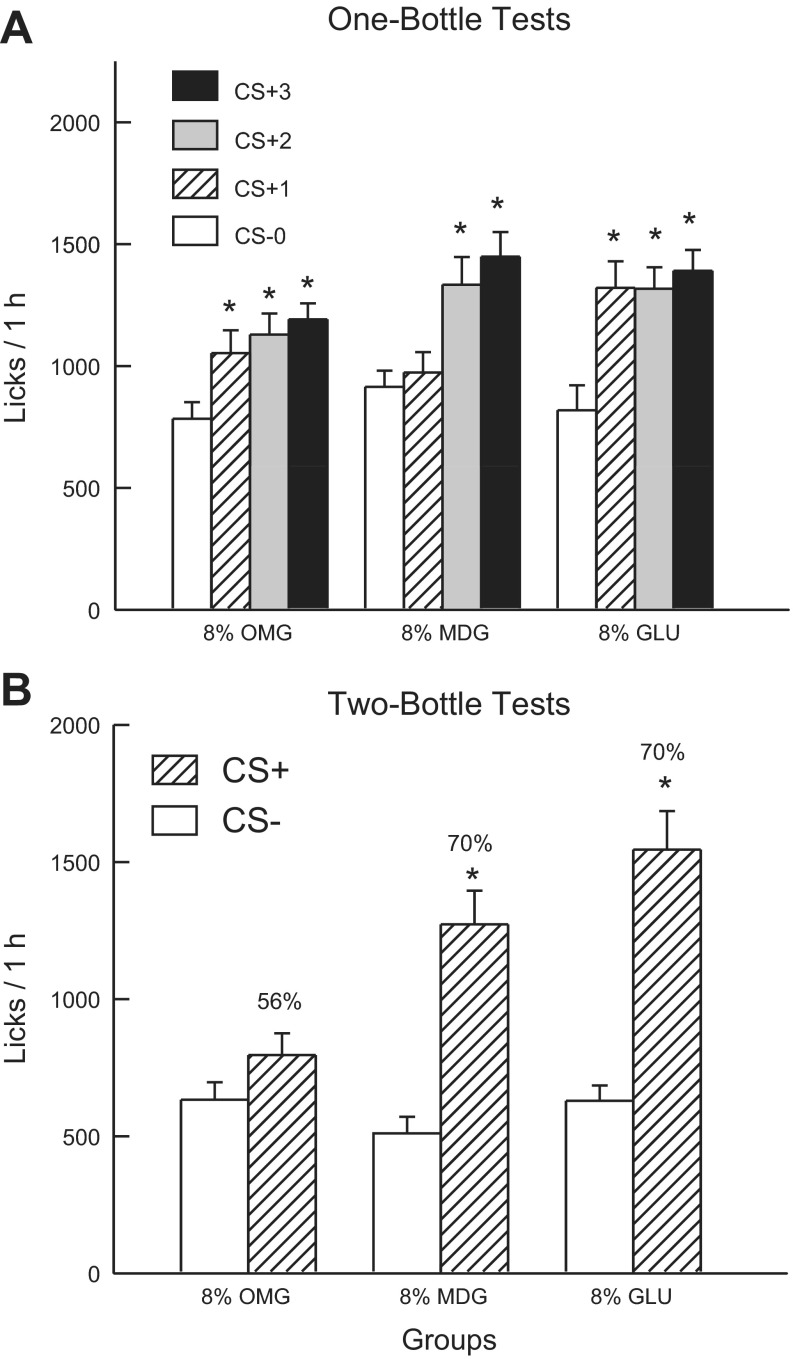
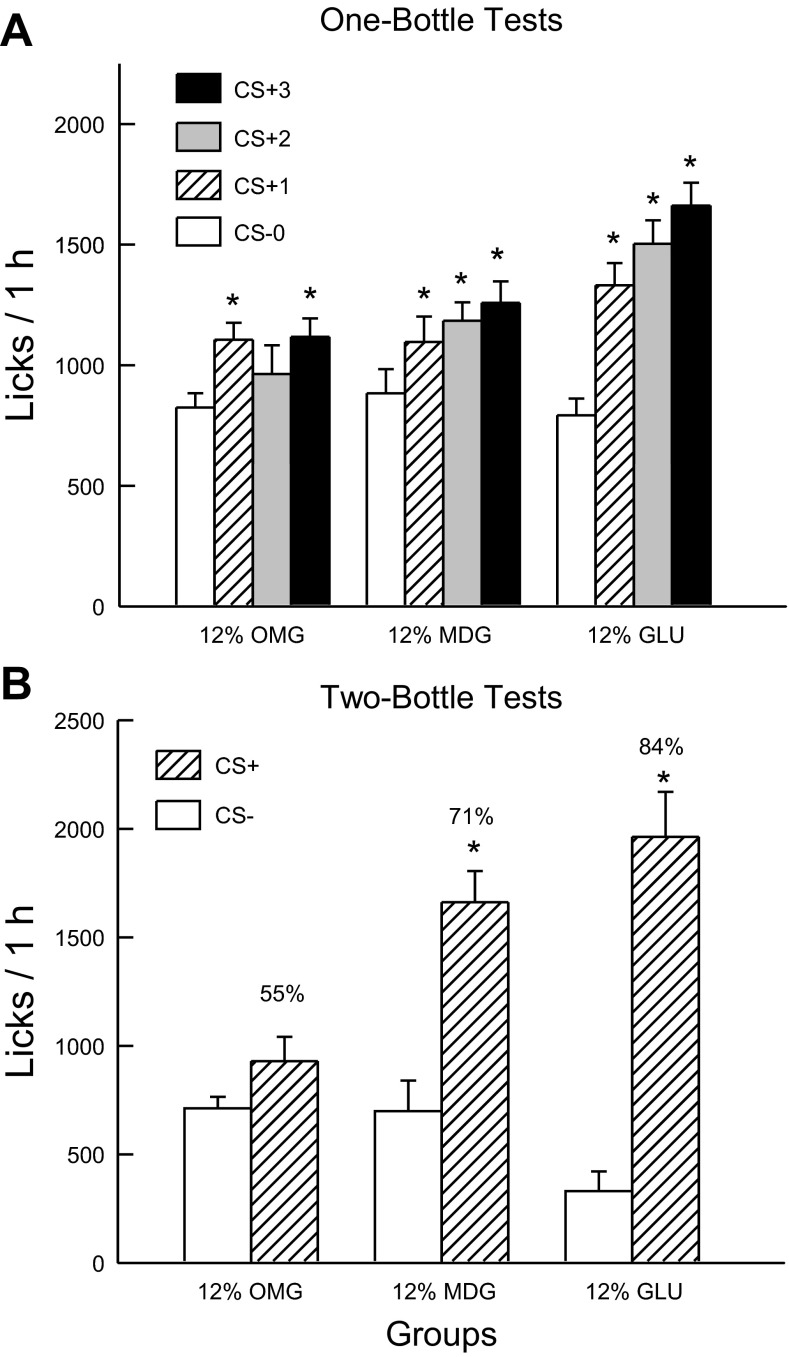
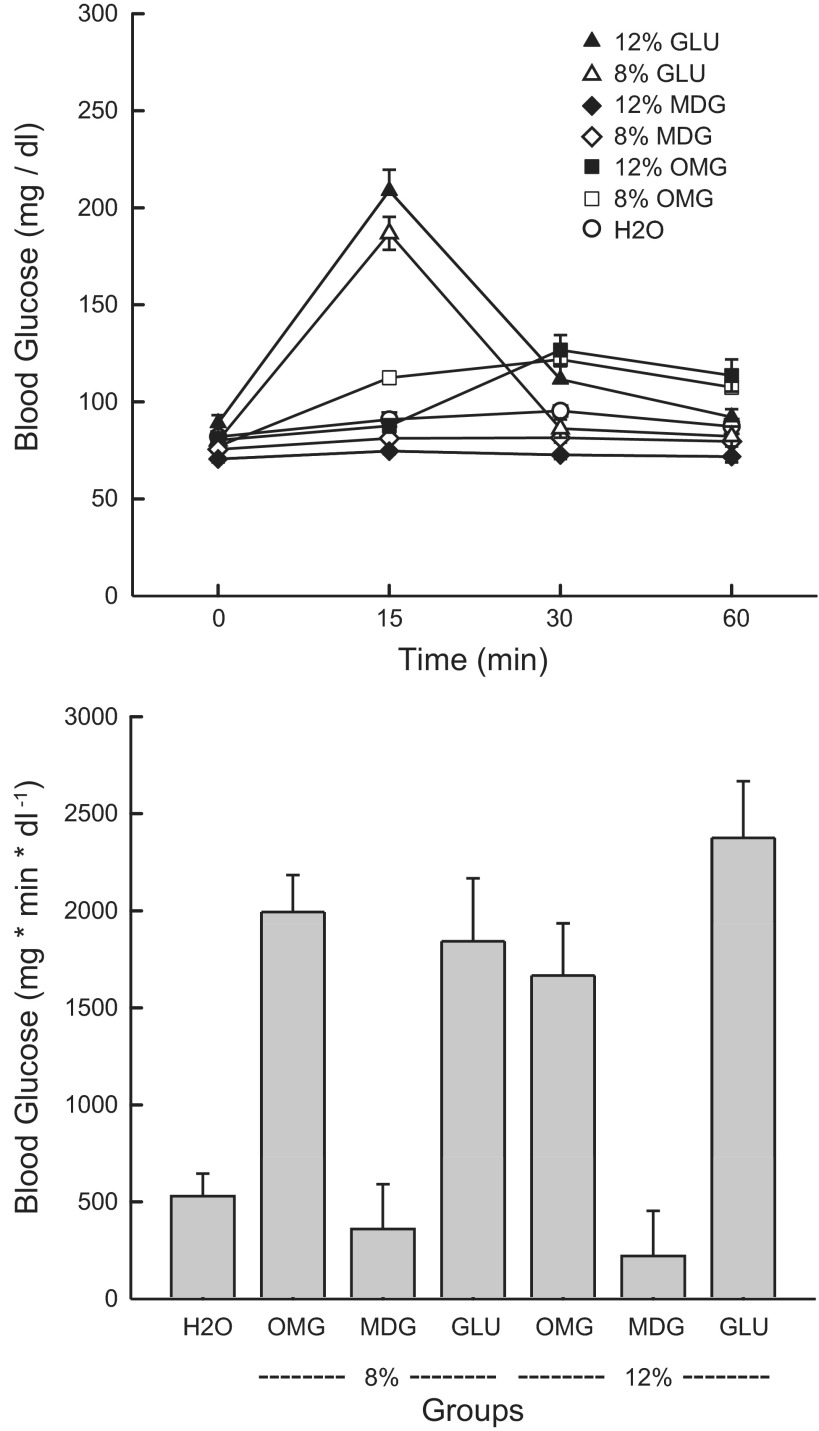
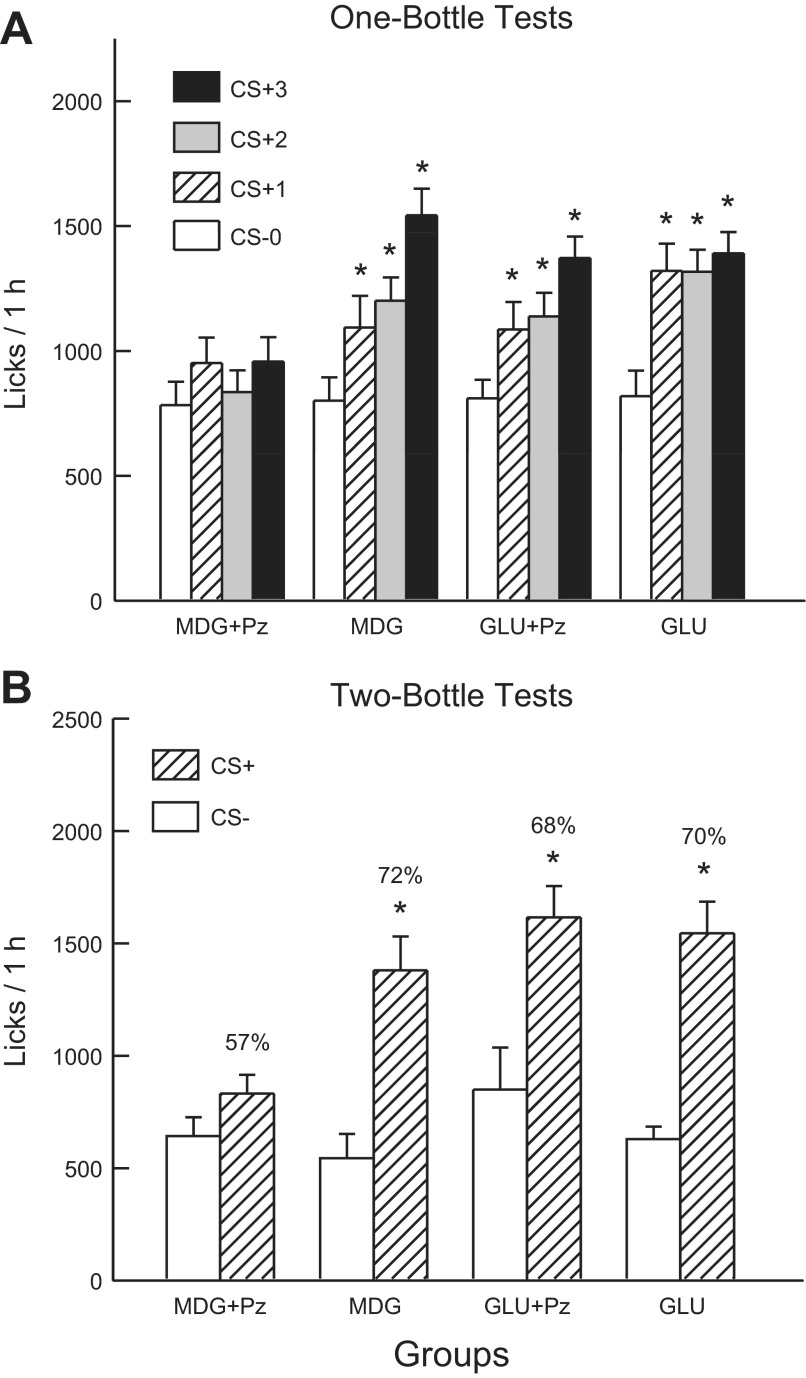
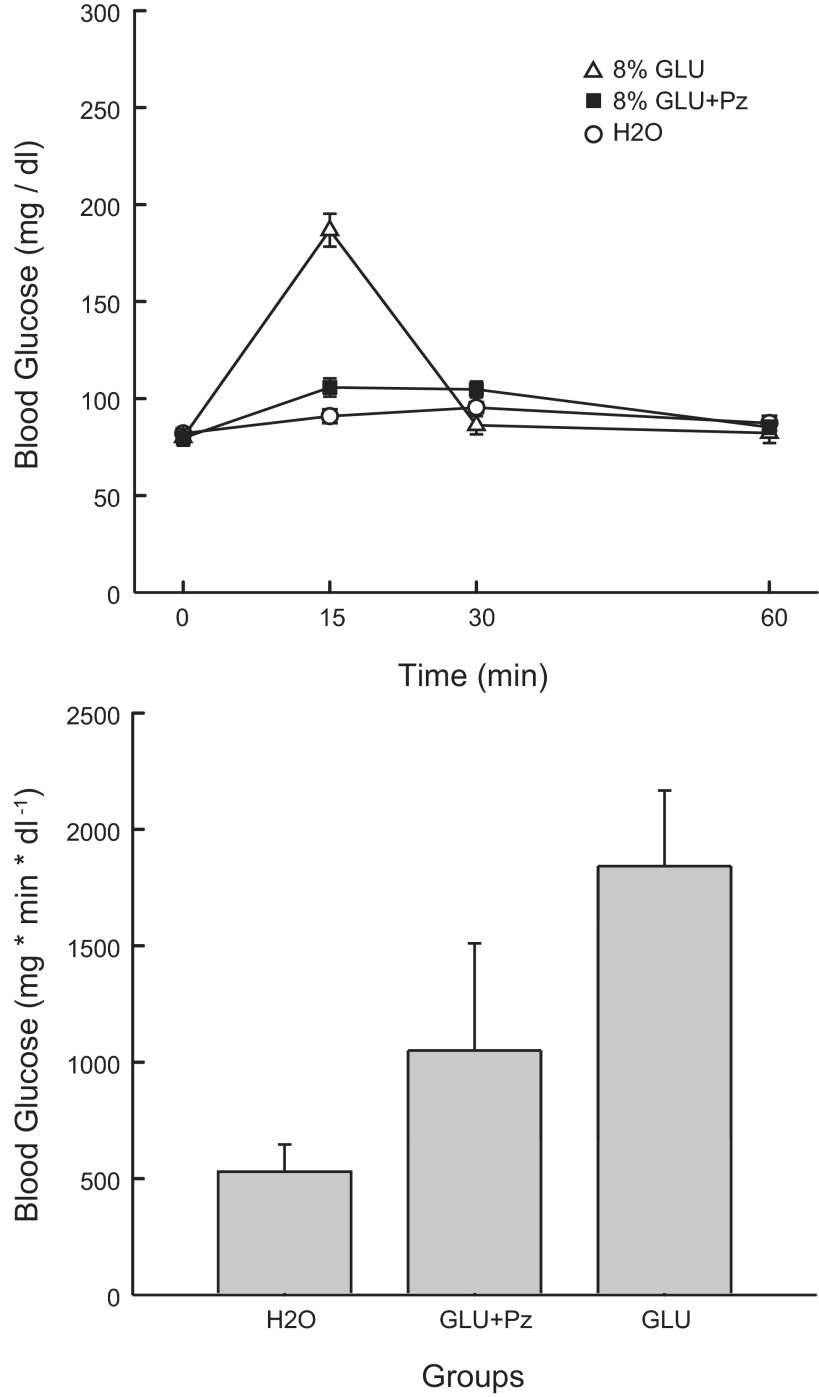
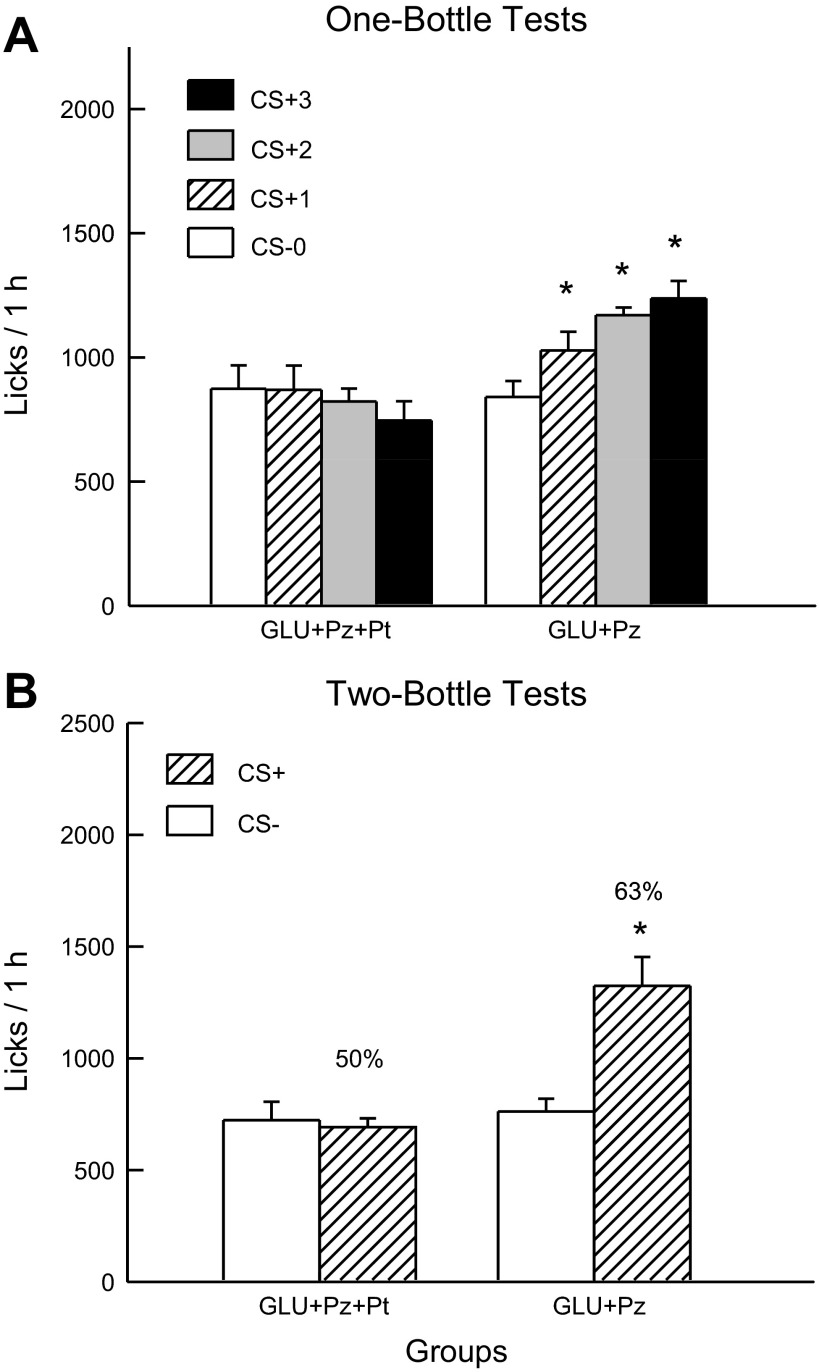
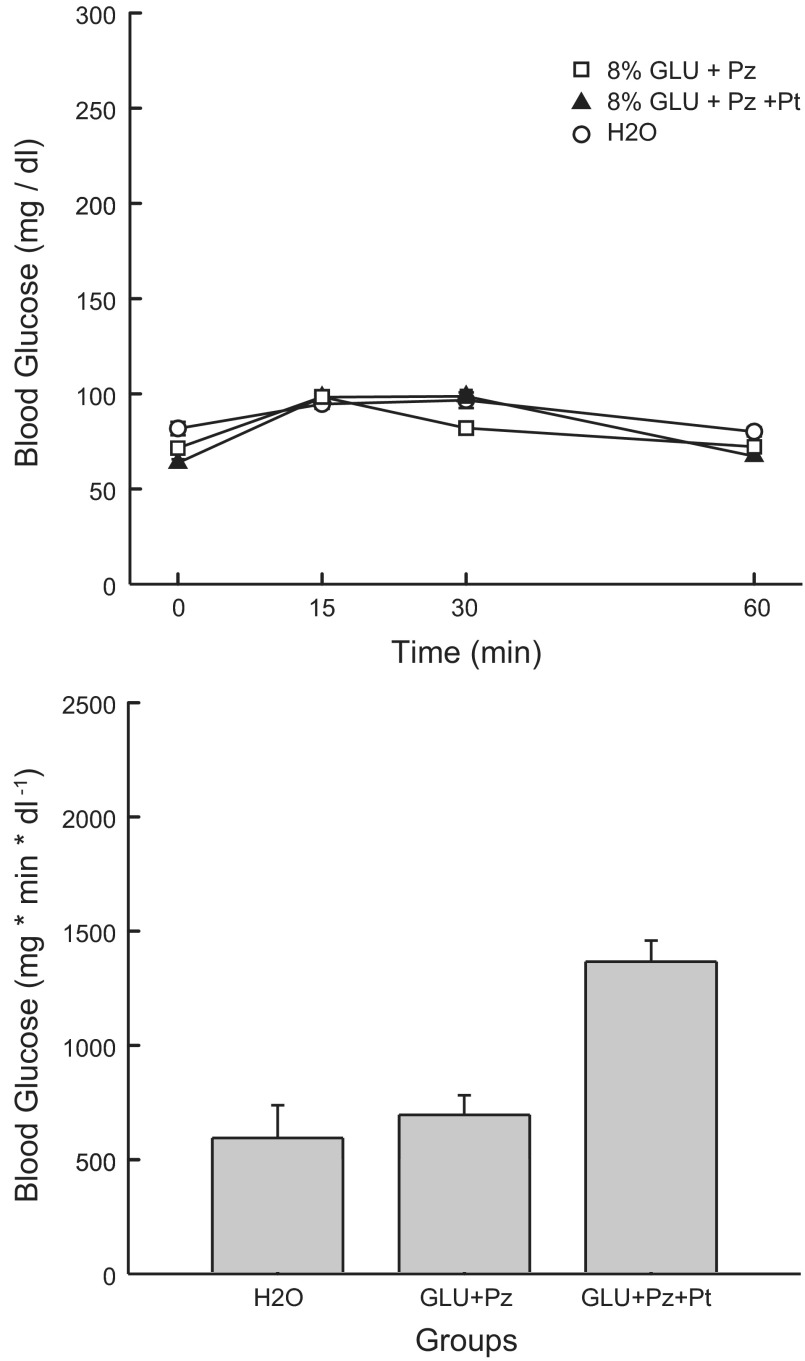
Post-oral sugar actions enhance the intake of and preference for sugar-rich foods, a process referred to as appetition. Here, we investigated the role of intestinal sodium glucose cotransporters (SGLTs) in sugar appetition in C57BL/6J mice using sugars and nonmetabolizable sugar analogs that differ in their affinity for SGLT1 and SGLT3. In experiments 1 and 2, food-restricted mice were trained (1 h/day) to consume a flavored saccharin solution [conditioned stimulus (CS-)] paired with intragastric (IG) self-infusions of water and a different flavored solution (CS+) paired with infusions of 8 or 12% sugars (glucose, fructose, and galactose) or sugar analogs (α-methyl-D-glucopyranoside, MDG; 3-O-methyl-D-glucopyranoside, OMG). Subsequent two-bottle CS+ vs. CS- choice tests were conducted without coinfusions. Infusions of the SGLT1 ligands glucose, galactose, MDG, and OMG stimulated CS+ licking above CS- levels. However, only glucose, MDG, and galactose conditioned significant CS+ preferences, with the SGLT3 ligands (glucose, MDG) producing the strongest preferences. Fructose, which is not a ligand for SGLTs, failed to stimulate CS+ intake or preference. Experiment 3 revealed that IG infusion of MDG+phloridzin (an SGLT1/3 antagonist) blocked MDG appetition, whereas phloridzin had minimal effects on glucose-induced appetition. However, adding phloretin (a GLUT2 antagonist) to the glucose+phloridzin infusion blocked glucose appetition. Taken together, these findings suggest that humoral signals generated by intestinal SGLT1 and SGLT3, and to a lesser degree, GLUT2, mediate post-oral sugar appetition in mice. The MDG results indicate that sugar metabolism is not essential for the post-oral intake-stimulating and preference-conditioning actions of sugars in mice.

Keywords: fructose; galactose; glucose; post-oral sugar conditioning.


Figures

Fig. 1.
Fig. 1.
Experiment 1A: Values are expressed as means ± SE. A: 1-h total licks are plotted for one bottle tests 0–3. The mice drank (1 h/day) a conditioned stimuli (CS)-flavored saccharin solution paired with intragastric (IG) water infusions in test 0 before being switched to a CS+-flavored saccharin solution paired with IG sugar self-infusions in tests 1–3. The 8% GLU, 8% FRU, and 8% GAL groups were infused with 8% glucose, fructose, and galactose, respectively. B: 1-h licks are plotted for CS+- and CS−-flavored saccharin solutions during the two-bottle preference test for the 8% GLU, 8% FRU, and 8% GAL groups. CS+ and CS− intakes were not paired with IG infusions during test. Number atop bar represents mean percent preference for the CS+ solution. *Significant difference (P < 0.05) between test 0 vs. tests 1–3 licks and between CS+ vs. CS− licks.
Fig. 2.
Fig. 2.
Experiment 1B: Values are expressed as means ± SE. A: 1-h total licks are plotted for one bottle tests 0–3. The mice drank (1 h/day) a CS−-flavored saccharin solution paired with IG water infusions in test 0 before being switched to a CS+-flavored saccharin solution paired with IG sugar self-infusions in tests 1–3. The 12% GLU, 12% FRU, and 12% GAL groups were infused with 12% glucose, fructose, and galactose, respectively. B: 1-h licks are plotted for CS+- and CS−-flavored saccharin solutions during the two-bottle preference test for the 12% GLU, 12% FRU, and 12% GAL groups. CS+ and CS− intakes were not paired with IG infusions during the test. Number atop bar represents mean percent preference for the CS+ solution. *Significant differences (P < 0.05) between test 0 vs. tests 1–3 licks and between CS+ vs. CS− licks.
Fig. 3.
Fig. 3.
Experiment 2A: Values are expressed as means ± SE. A: 1-h total licks are plotted for one bottle tests 0–3. The mice drank (1 h/day) a CS−-flavored saccharin solution paired with IG water infusions in test 0 before being switched to a CS+-flavored saccharin solution paired with IG sugar self-infusions in tests 1–3. The 8% GLU, 8% MDG, and 8% OMG groups were infused with 8% glucose, MDG and OMG, respectively. B: 1-h licks are plotted for CS+- and CS−-flavored saccharin solutions during the two-bottle preference test for the 8% GLU, MDG, and OMG groups. CS+ and CS− intakes were not paired with IG infusions during the test. Number atop bar represents mean percent preference for the CS+ solution. *Significant differences (P < 0.05) between test 0 vs. tests 1–3 licks and between CS+ vs. CS− licks.
Fig. 4.
Fig. 4.
Experiment 2B: Values are expressed as means ± SE. A: 1-h total licks are plotted for one bottle tests 0–3. The mice drank (1 h/day) a CS−-flavored saccharin solution paired with IG water infusions in test 0 before being switched to a CS+-flavored saccharin solution paired with IG sugar self-infusions in tests 1–3. The 12% GLU, 12% MDG, and 12% OMG groups were infused with 12% glucose, MDG, and OMG, respectively. B: 1-h licks are plotted for CS+- and CS−-flavored saccharin solutions during the two-bottle preference test for the 12% GLU, MDG, and OMG groups. CS+ and CS− intakes were not paired with IG infusions during the test. Number atop bar represents mean percent preference for the CS+ solution. *Significant differences (P < 0.05) between test 0 vs. tests 1–3 licks and between CS+ vs. CS− licks.
Fig. 5.
Fig. 5.
Experiment 2: Values are expressed as means ± SE. A: blood glucose at 0, 15, 30, and 60 min after a 0.6-ml infusion of glucose, MDG, or OMG in 8% and 12% groups or water in the H2O group. B: incremental area under the curve (IAUC) for blood glucose after a 0.6-ml infusion of glucose, MDG, or OMG in 8% and 12% groups or water in the H2O group.
Fig. 6.
Fig. 6.
Experiment 3A: Values are expressed as means ± SE. A: 1-h total licks are plotted for one bottle tests 0–3. The mice drank (1 h/day) a CS-flavored saccharin solution paired with IG water infusions in test 0 before being switched to a CS+-flavored saccharin solution paired with IG sugar infusions. The MDG+phloridzin (Pz), MDG, GLU+Pz, and GLU groups were infused with 8% MDG, 8% MDG+0.4% Pz, 8% glucose, and 8% glucose+ 0.4% Pz, respectively. B: 1-h licks are plotted for CS+ and CS−-flavored saccharin solutions during the two-bottle preference test for the MDG, MDG+Pz, GLU, and GLU+Pz groups. CS+ and CS− intakes were not paired with IG infusions during the test. Number atop bar represents mean percent preference for the CS+ solution. *Significant differences (P < 0.05) between test 0 vs. tests 1–3 licks and between CS+ vs. CS− licks.
Fig. 7.
Fig. 7.
Experiment 3A: Values are expressed as means ± SE. A: blood glucose at 0, 15, 30, and 60 min after a 0.6-ml infusion of 8% glucose, 8% glucose+0.4% phloridzin, or water in the GLU, GLU+Pz, and H2O groups. B: blood glucose IAUC in the GLU, GLU+Pz, and H2O groups.
Fig. 8.
Fig. 8.
Experiment 3B: Values are expressed as means ± SE. A: 1-h total licks are plotted for one bottle tests 0–3. The mice drank (1 h/day) a CS−-flavored saccharin solution paired with IG water infusions in test 0 before being switched to a CS+-flavored saccharin solution paired with IG sugar infusions. The GLU+Pz+phloretin (Pt) and GLU+Pz groups were infused with 8% glucose+0.4% Pz+0.23% Pt and 8% glucose+0.4% Pz containing 3.25% 1 N NaOH, respectively. B: 1-h licks are plotted for CS+- and CS−-flavored saccharin solutions during the two-bottle preference test with the GLU+Pz+Pt and GLU+Pz groups. CS+ and CS− intakes were not paired with IG infusions during the test. Number atop bar represents mean percent preference for the CS+ solution. *Significant differences (P < 0.05) between test 0 vs. tests 1–3 licks and between CS+ vs. CS− licks.
Fig. 9.
Fig. 9.
Experiment 3B: Values are expressed as means ± SE. A: blood glucose at 0, 15, 30, and 60 min after a 0.6-ml infusion of 8% glucose+0.4% Pz, 8% glucose+0.4% Pz+0.23% Pt, and water in the GLU+Pz, GLU+Pz+Pt, and H2O groups, respectively. All infusions contained 3.25% of 1 N NaOH. B: blood glucose IAUC in the GLU+Pz, GLU+Pz+Pt, and H2O groups.

References

    1. Ackroff K, Sclafani A, Axen KV. Diabetic rats prefer glucose-paired flavors over fructose-paired flavors. Appetite 28: 73–83, 1997 - PubMed
    1. Ackroff K, Yiin YM, Sclafani A. Post-oral infusion sites that support glucose-conditioned flavor preferences in rats. Physiol Behav 99: 402–411, 2010 - PMC - PubMed
    1. Aljure O, Díez-Sampedro A. Functional characterization of mouse sodium/glucose transporter type 3b. Am J Physiol Cell Physiol 299: C58–C65, 2010 - PubMed
    1. Berman WF, Bautista JO, Rogers S, Segal S. Metabolism and transport of galactose by rat intestine. Biochim Biophys Acta 455: 90–101, 1976 - PubMed
    1. Berthoud HR. Vagal and hormonal gut-brain communication: from satiation to satisfaction. Neurogastroenterol Motil 20: 64–72, 2008 - PMC - PubMed

Publication types

MeSH terms