. 2013 Aug 7;5(197):197ra102.
doi: 10.1126/scitranslmed.3006200.

Mutational signature of aristolochic acid exposure as revealed by whole-exome sequencing

Affiliations

Mutational signature of aristolochic acid exposure as revealed by whole-exome sequencing

Margaret L Hoang et al. Sci Transl Med. .

Abstract

In humans, exposure to aristolochic acid (AA) is associated with urothelial carcinoma of the upper urinary tract (UTUC). Exome sequencing of UTUCs from 19 individuals with documented exposure to AA revealed a remarkably large number of somatic mutations and an unusual mutational signature attributable to AA. Most of the mutations (72%) in these tumors were A:T-to-T:A transversions, located predominantly on the nontranscribed strand, with a strong preference for deoxyadenosine in a consensus sequence (T/CAG). This trinucleotide motif overlaps the canonical splice acceptor site, possibly accounting for the excess of splice site mutations observed in these tumors. The AA mutational fingerprint was found frequently in oncogenes and tumor suppressor genes in AA-associated UTUC. The AA mutational signature was observed in one patient's tumor from a UTUC cohort without previous indication of AA exposure. Together, these results directly link an established environmental mutagen to cancer through genome-wide sequencing and highlight its power to reveal individual exposure to carcinogens.


Conflict of interest statement

Competing interests: Under agreements between the Johns Hopkins University, Genzyme, Exact Sciences, Inostics, Qiagen, Invitrogen, and Personal Genome Diagnostics, N.P., B.V., and K.W.K. are entitled to a share of the royalties received by the University on sales of products related to genes reported in this manuscript. N.P., B.V., and K.W.K. are co-founders of Inostics and Personal Genome Diagnostics, are members of their Scientific Advisory Boards, and own Inostics and Personal Genome Diagnostics stock, which is subject to certain restrictions under Johns Hopkins University policy.

Figures

Fig. 1
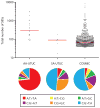
Fig. 1. Mutation spectrum of AA-associated UTUCs
(Top) Scatter plot of total number of SBSs found from exome sequencing of two UTUC cohorts: AA-UTUC and SA-UTUC. The COSMIC data set represents a broad distribution of cancer types (details in tables S5 and S6); mutations are in exomic regions for comparison with UTUC exomes. Each dot indicates an individual tumor (19 tumors for AA-UTUCs, 6 tumors for SA-UTUCs, and 812 tumors for COSMIC data set). One tumor from SA-UTUCs (SA_116) was excluded from the SA group calculations because of the presence of the AA mutational signature (details in text and Fig. 3). Only COSMIC tumors with ≥40 SBSs were included to reflect each tumor mutation spectrum. Horizontal red bars indicate median. (Bottom) Pie charts of SBS mutation frequencies in the exomes of AA-UTUC, SA-UTUC, and COSMIC groups. Pie legend contains the six possible SBSs on double-stranded DNA. For example, A:T>T:A is both A-to-T and T-to-A mutations, where colon (:) represents the bond between DNA strands. Group frequencies of A:T>T:A transversions (red in pie graph) are 73, 7, and 4% of SBSs in AA-UTUC, SA-UTUC, and COSMIC groups, respectively. A:T>T:A transversions are the least-frequent SBS in the COSMIC data set.
Fig. 2
Fig. 2. Mutational pattern of A:T>T:A transversions in AA-UTUC exomes
(A) Frequencies of the six possible SBSs listed on the x axis found on the nontranscribed strand (black bars) or transcribed strand (white bars) in AA-UTUC (left side) and COSMIC data set (right side). The A:T>T:A strand bias in AA-UTUCs likely represents an enrichment of A>T mutations on the nontranscribed strand (rather than T>As on the transcribed strand). (B) Frequencies of A>T mutations within each observed trinucleotide sequence in AA-UTUCs (black bars) and COSMIC data set (white bars). The middle A is the mutated base (A>T) in trinucleotide sequences listed on the x axis. Total number of A>Ts evaluated is 10,326 for AA-UTUCs and 5250 for COSMIC data set. (C) Frequencies of mutations found in 5′ splice donor (black bars) and 3′ splice acceptor (white bars) sites in AA-UTUCs and COSMIC data set. Mutations only in the canonical 5′ splice donor (GT) and 3′ splice acceptor (CAG or TAG) sites were counted. GT and CAG/TAG splice site sequences correspond to the non-transcribed strand sequences.
Fig. 3
Fig. 3. Molecular diagnosis of UTUC patient with previously unknown AA exposure
(A) Mutation spectra from exome sequencing of 26 UTUC patients (labeled on the x axis) from AA-UTUC and SA-UTUC cohorts. AA cohort originally defined by the presence of AL-DNA adducts in kidney tissue by 32P-postlabeling method and/or the presence of A>T mutation in TP53 (see Materials and Methods). The seven individuals in the SA cohort lacked both AA biomarkers noted above but did have a clinical history of smoking. (B) Dot plot of frequencies of A:T>T:A transversions out of total SBSs. Each dot is an individual tumor (19 tumors for AA-UTUC, 7 tumors for SA-UTUC, and 812 tumors for COSMIC data set). Suspected exposure to AA herein defined as above 35% (red dashed line). Median (horizontal gray lines) A:T>T:A transversion frequencies are 69% for AA-UTUC, 5.9% for SA-UTUC, and 5.6% for COSMIC data set. The IQR (indicated by vertical gray lines) is between 48 and 79% for AA-UTUC, 0 and 20% for SA-UTUC, and 2.9 and 9.1% for COSMIC data set. Patient SA_116 has 54% (55 of 102 SBSs) A:T>T:A transversions (red arrow). This 54% value lies within the IQR of AA-UTUC but is above the upper quartile (by seven times the COSMIC IQR) of the COSMIC data set. (C) Dot plot of the ratio of A:T>T:A mutations on nontranscribed strand over transcribed strand in patient SA_116 (ratio of 3.6) relative to AA-UTUC cohort (median ratio of 2.5 with IQR of 2.3 to 2.7). (D) Dot plot of frequencies of A>Ts within CAG consensus sequence out of total number of observed trinucleotide sequences in patient SA_116 (27%) relative to AA-UTUC cohort (median of 32% with IQR of 29 to 34%).

Comment in

References

    1. Kumar V, Poonam, Prasad AK, Parmar VS. Naturally occurring aristolactams, aristolochic acids and dioxoaporphines and their biological activities. Nat Prod Rep. 2003;20:565–583. - PubMed
    1. Grollman AP, Scarborough J, Jelakovic B. In: Advances in Molecular Toxicology. Fishbein J, editor. Vol. 3. Elsevier; Amsterdam: 2009. pp. 211–222.
    1. Vanherweghem JL, Tielemans C, Abramowicz D, Depierreux M, Vanhaelen-Fastre R, Vanhaelen M, Dratwa M, Richard C, Vandervelde D, Verbeelen D, Jadoul M. Rapidly progressive interstitial renal fibrosis in young women: Association with slimming regimen including Chinese herbs. Lancet. 1993;341:387–391. - PubMed
    1. Vanherweghem JL, Debelle F, Muniz-Martinez M-C, Nortier J. In: Clinical Nephrotoxins. de Broe ME, Porter GA, Bennet WM, Verpooten GA, editors. Kluwer; Dordrecht: 2003. pp. 588–601.
    1. Cosyns JP, Jadoul M, Squifflet JP, Wese FX, van Ypersele de Strihou C. Urothelial lesions in Chinese-herb nephropathy. Am J Kidney Dis. 1999;33:1011–1017. - PubMed

Publication types