. 2013 Aug 7;33(32):12970-81.
doi: 10.1523/JNEUROSCI.1974-13.2013.

Autonomic dysreflexia causes chronic immune suppression after spinal cord injury

Affiliations

Autonomic dysreflexia causes chronic immune suppression after spinal cord injury

Yi Zhang et al. J Neurosci. .

Abstract

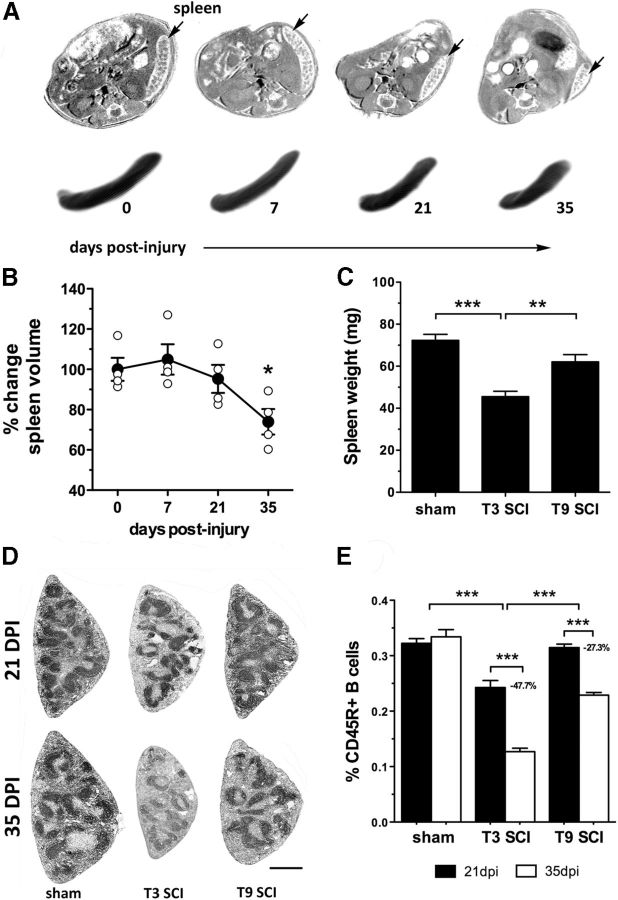
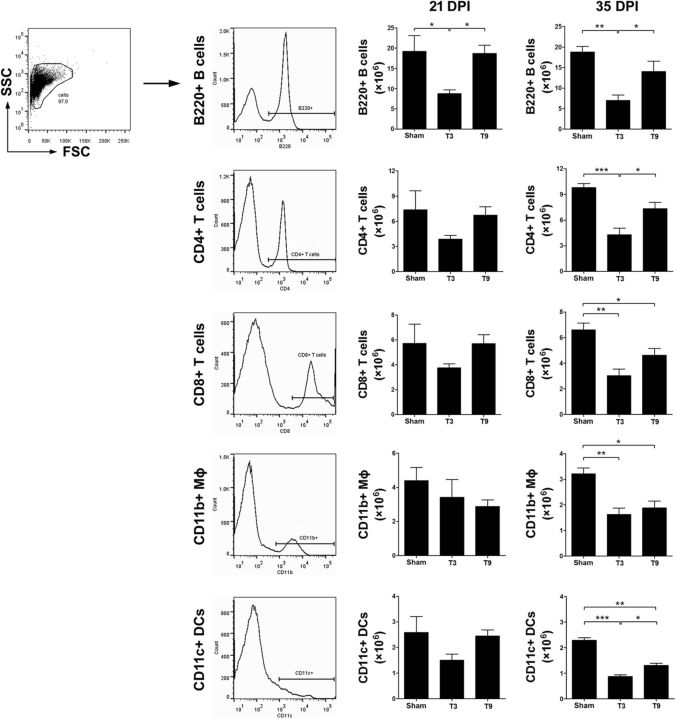
Autonomic dysreflexia (AD), a potentially dangerous complication of high-level spinal cord injury (SCI) characterized by exaggerated activation of spinal autonomic (sympathetic) reflexes, can cause pulmonary embolism, stroke, and, in severe cases, death. People with high-level SCI also are immune compromised, rendering them more susceptible to infectious morbidity and mortality. The mechanisms underlying postinjury immune suppression are not known. Data presented herein indicate that AD causes immune suppression. Using in vivo telemetry, we show that AD develops spontaneously in SCI mice with the frequency of dysreflexic episodes increasing as a function of time postinjury. As the frequency of AD increases, there is a corresponding increase in splenic leucopenia and immune suppression. Experimental activation of spinal sympathetic reflexes in SCI mice (e.g., via colorectal distension) elicits AD and exacerbates immune suppression via a mechanism that involves aberrant accumulation of norepinephrine and glucocorticoids. Reversal of postinjury immune suppression in SCI mice can be achieved by pharmacological inhibition of receptors for norepinephrine and glucocorticoids during the onset and progression of AD. In a human subject with C5 SCI, stimulating the micturition reflex caused AD with exaggerated catecholamine release and impaired immune function, thus confirming the relevance of the mouse data. These data implicate AD as a cause of secondary immune deficiency after SCI and reveal novel therapeutic targets for overcoming infectious complications that arise due to deficits in immune function.


Figures

Figure 1.
Figure 1.
Spontaneous episodes of AD can be detected in SCI mice using in vivo telemetry. A, Detection and analysis of spontaneous AD in SCI mice. Using MATLAB, a mathematical algorithm was designed to automatically detect spontaneously occurring events of AD in the HR/BP data. The semiautomated procedure for screening raw data to detect spontaneous AD consisted of three steps. First, establish baselines (green lines) for clipped BP and raw HR data using lowess and robust lowess smoothing filters. Filters were applied in consecutive 6 min epochs (smoothing window). A 6 min window was empirically determined to be optimal (compared with 2, 4, 8, or 10 min; data not shown). Second, simultaneously compare BP and HR data to baseline values. For the computer to automatically register an “event,” BP change from baseline (H1) must exceed 10 mmHg and persist above baseline for >30 s (T1). During T1, HR must decrease at least 10 bpm below baseline (H2). To register a simultaneous change in HR and BP as a “dysreflexic event,” the duration of the BP increase (T1) and HR decrease (T2) must overlap for at least 66% of the measured interval. Third, export BP/HR traces in which suspected AD events occur, and then visually confirm the event (see H3, T3, and H4). Real spontaneous AD events with H3 > 20 mmHg, T3 > 30 s, and H4 > 10 BPM are documented in B. This final manual confirmation eliminates detection of false-positive events reported by the algorithm. B, The number of daily bouts of spontaneous AD increases in T3 SCI mice in two phases: a transient increase during the first week postinjury (Phase I), followed by a gradual but consistent increase in the total number of daily events after 14 dpi (Phase II). n = 4–7/group; *p < 0.05; **p < 0.01; ***p < 0.001 compared with T3 Sham or T9 SCI. C, High-frequency spontaneous AD in T3 SCI mice is associated with a full urinary bladder. Immediately before morning bladder expression, the number of spontaneous dysreflexic events is higher than after bladder expression. Data show individual data points (and group means) for sequentially collected spontaneous AD events from 0 to 2 h before and 1 to 3 h after morning bladder expression in a subset of mice at 26, 27, and 28 dpi. n = 5–6/group; **p < 0.01.
Figure 2.
Figure 2.
Concentrations of circulating CORT and splenic NE increase as the frequency of spontaneous AD increases. A, RIA analysis of CORT levels in serum from mice at 0, 15, and 28 dpi (n = 3–4/group). B, HPLC analysis of splenic NE levels at 21 and 35 dpi (n = 5/group). Extraction efficiency and system recovery was 93.3%. *p < 0.05; **p < 0.01; ***p < 0.001.
Figure 3.
Figure 3.
Progressive splenic atrophy and leukopenia occur only after T3 SCI in mice with high-frequency spontaneous AD. A, Serial in vivo MRI scans (inverted using Photoshop) from a single mouse illustrate the progressive splenic atrophy that occurs after T3 SCI. Top: Two-dimensional view of thoracic cavity highlighting the location and relative size of the spleen at 0, 7, 21, and 35 dpi (arrow). Bottom: Three-dimensional reconstructions of that spleen illustrate the magnitude of splenic atrophy. B, Serial measures of spleen volume calculated from MRI images at 0, 7, 21, and 35 dpi for each T3 SCI mouse (open circles) then normalized to 0 dpi. n = 4; *p < 0.05 compared with 0, 7, or 21 dpi; closed symbols represent group mean over time. C, Spleen weight is significantly reduced at 35 dpi only in T3 SCI mice. n = 8–9; **p < 0.01; ***p < 0.001. D, E, Low-power images and quantification of CD45R+ B cells in spleens from T3 SCI, T9 SCI, or sham-injured mice reveal progressive B-cell loss between 21 and 35 dpi. Scale bars, 1 mm. n = 3 mice/group; quantification made from 3 sections/mouse; ***p < 0.001.
Figure 4.
Figure 4.
Numbers of all splenic leukocyte subsets are reduced after high-level SCI. Suspensions of splenic leukocytes were phenotyped using specific antibodies. A representative flow cytometry scatter plot of splenic leukocytes (side scatter/SSC vs forward scatter/FSC) and leukocyte-specific histograms is shown to illustrate the approach for quantifying B lymphocytes (B220+), CD4+, or CD8+ T lymphocytes, macrophages (MΦ, CD11b+) or dendritic cells (DCs, CD11c+). Bar graphs show mean cell numbers at 21 or 35 dpi after T3 SCI, T9 SCI, or T3 Lam. Data are presented as mean cell numbers ± SEM (× 106). Isotype control antibodies were used to set cursors in histogram plots. Only half a spleen was used for flow cytometry. n = 5/group; *p < 0.05; **p < 0.01; ***p < 0.001.
Figure 5.
Figure 5.
Impaired antigen-specific immunity after high-level SCI is a result of mature B lymphocyte cell death and impaired B-cell genesis. A, Representative plots from flow cytometry analysis of B-cell lineages in the spleen. Contour plots show gating strategy to identify mature (red; B220+AA4.1) and immature transitional (blue; B220+AA4.1+) B lymphocytes. Mature B cells can be subdivided into follicular B cells (FOB; green) that express low levels of surface IgM and CD21/35 (IgMlo/CD21/35lo) and marginal zone B cells (MZB; brown) that express high levels of surface IgM and CD21/35 (IgMhi/CD21/35hi). Scatter plots showing isotype control labeling for AA4.1, IgM, and CD21/35 are shown in the left and positively labeled cells are shown in the right scatter plots. Gating strategies to define mature versus immature B cells are shown by box around red- or blue-shaded cell populations. B, Mean number of total B-cell subsets in the spleen at 21 or 35 dpi after T3 SCI, T9 SCI, or T3 Sham. C, Activated caspase-3+ (blue) cells in splenic white pulp after T3 SCI colocalize with CD45R+ B lymphocytes (green) and CD3+ T lymphocytes (red). Total number of caspase-3+ cells was consistently highest in T3 SCI (ii, v, viii, ix) spleens compared with spleens from T3 Sham (i, iv, vii) or T9 SCI (iii, vi). More activated caspase-3+ cells were detected at 35 dpi (v, ix) than at 21 dpi (ii, viii) after T3 SCI. White arrowheads (viiix) highlight CD45R+/caspase-3+ B cells. Scale bars: ivi, 50 μm; viiix, 10 μm. D, Flow cytometry quantification of lymphocyte viability (eFluor780) shows a significant increase in B-cell death only after T3 SCI. E, High-level SCI impairs antibody production. All mice were immunized with OVA (100 μg) at 18 dpi. Serum anti-OVA IgG1 concentrations were measured by ELISA at 28 dpi. n = 5–6/group; *p < 0.05; **p < 0.01.
Figure 6.
Figure 6.
Intentional AD is inducible only in the mice with high-level SCI. A, B, Representative pulsatile arterial pressure traces after applying colorectal distension or cutaneous pinch in mice at least 14 d after SCI or sham surgery (15–20 dpi). Under each trace, MABP and mean HR changes are quantified showing responses to colorectal distension (A) or cutaneous pinch (B). Arrows on each trace indicate the start and stop, respectively, for each stimulus. C, D, Quantification of MABP and mean HR changes in response to colorectal distension (C) or skin pinch (D). Baseline data (white bars) were calculated by averaging measured values over a 10 s period immediately before stimulation. Black bars represent peak BP values and corresponding HR measured during the time interval spanning stimulus onset until 5 min after cessation of stimulus. n = 6–8/group; *p < 0.05; **p < 0.01 versus baseline.
Figure 7.
Figure 7.
Experimental (i.e., intentional) induction of AD exacerbates post-SCI splenic atrophy and immune suppression in rodents and humans. AC, Colorectal distension and skin pinch cause AD and exacerbate splenic atrophy and leucopenia in T3 SCI mice. Successive bouts of AD were intentionally triggered using colorectal distension and cutaneous pinch (3× each at 15, 16, and 17 dpi) and mice were killed at 21 dpi. A, Intentional induction of AD (iAD) caused marked loss of CD45R+ splenic B lymphocytes. Scale bars, 1 mm. B, B-cell numbers were reduced > 50% after iAD in T3 SCI mice. Only mild nonsignificant effects occurred in sham or T9 SCI mice. n = 3 mice/group, 3 sections/mouse; *p < 0.05; **p < 0.01; ***p < 0.001. C, Immunofluorescent staining of spleen (anti-CD45R, anti-CD3, and activated caspase-3 antibodies) shows that T- and B-cell apoptosis is increased by iAD in T3 SCI mice compared with iAD in sham or T9 SCI mice. White arrowheads delineate double-positive B cells. Scale bars: iiii, 50 μm; iv, v, 10 μm. D, OVA-immunized T3 SCI mice with iAD produce significantly fewer anti-OVA antibodies than comparable sham control or T3 SCI mice. Serum anti-OVA IgG1 was measured at 28 dpi. n = 4–6/group; *p < 0.05; **p < 0.01. E, Micturition reflex triggered by abdominal tapping in a C5 neurologically complete SCI volunteer causes mild AD and is associated with exaggerated reflex catecholamine release and impaired immune function. Mean arterial pressure (MAP; 68–92 mm Hg), HR (52–60 bpm), plasma NE (51–350 pg/ml), and epinephrine (EPI; 7.5–29 pg/ml), in vitro proliferative lymphocyte responses to phytohemaglutinin (PHA) or pokeweed mitogen (PWM), and CD4:CD8 lymphocyte ratios were measured 15 min before voiding, immediately upon voiding (0), and 2, 5, 15, and 30 min after voiding.
Figure 8.
Figure 8.
Activation of spinal autonomic reflexes causes sustained elevations of CORT and NE in blood and spleen, respectively, after T3 SCI. Restraint (1 h) served as a stress control. A, B, RIA analyses of serum CORT immediately (A) or 4 d after (B) after eliciting AD with colorectal distension and pinch (Figs. 6, 7) or restraint. n = 3–4/group. C, D, HPLC analysis of serum (C) and splenic (D) NE 4 d after colorectal distension/pinch or restraint. n = 4–6/group; percentage extraction efficiency and system recovery = 93.3%; *p < 0.05; **p < 0.01; ***p < 0.001.
Figure 9.
Figure 9.
Selective β2AR and GR antagonists reverse AD-associated chronic immune suppression in T3 SCI mice. Butoxamine (Butox; a selective β2AR antagonist; 5 mg/kg) and RU486 (a glucocorticoid receptor antagonist; 5 mg/kg) were injected intraperitoneally daily at 1–7 dpi and 14–28 dpi. All mice were immunized at 18 dpi with OVA (100 μg) 1 h after injecting drugs. Spleen weight (normalized to body weight) (A) and OVA-specific antibodies (B) were analyzed in sera at 28 dpi. n = 4–6/group; *p < 0.05; **p < 0.01.

References

    1. Ajmo CT, Jr, Collier LA, Leonardo CC, Hall AA, Green SM, Womble TA, Cuevas J, Willing AE, Pennypacker KR. Blockade of adrenoreceptors inhibits the splenic response to stroke. Exp Neurol. 2009;218:47–55. doi: 10.1016/j.expneurol.2009.03.044. - DOI - PMC - PubMed
    1. Cameron AA, Smith GM, Randall DC, Brown DR, Rabchevsky AG. Genetic manipulation of intraspinal plasticity after spinal cord injury alters the severity of autonomic dysreflexia. J Neurosci. 2006;26:2923–2932. doi: 10.1523/JNEUROSCI.4390-05.2006. - DOI - PMC - PubMed
    1. Curt A, Nitsche B, Rodic B, Schurch B, Dietz V. Assessment of autonomic dysreflexia in patients with spinal cord injury. J Neurol Neurosurg Psychiatry. 1997;62:473–477. doi: 10.1136/jnnp.62.5.473. - DOI - PMC - PubMed
    1. Elenkov IJ, Wilder RL, Chrousos GP, Vizi ES. The sympathetic nerve–an integrative interface between two supersystems: the brain and the immune system. Pharmacol Rev. 2000;52:595–638. - PubMed
    1. Engeland WC, Arnhold MM. Neural circuitry in the regulation of adrenal corticosterone rhythmicity. Endocrine. 2005;28:325–332. doi: 10.1385/ENDO:28:3:325. - DOI - PubMed

Publication types

MeSH terms