. 2013 Aug 7;33(32):13190-203.
doi: 10.1523/JNEUROSCI.0935-13.2013.

Ordered recruitment of dynactin to the microtubule plus-end is required for efficient initiation of retrograde axonal transport

Affiliations

Ordered recruitment of dynactin to the microtubule plus-end is required for efficient initiation of retrograde axonal transport

Armen J Moughamian et al. J Neurosci. .

Abstract

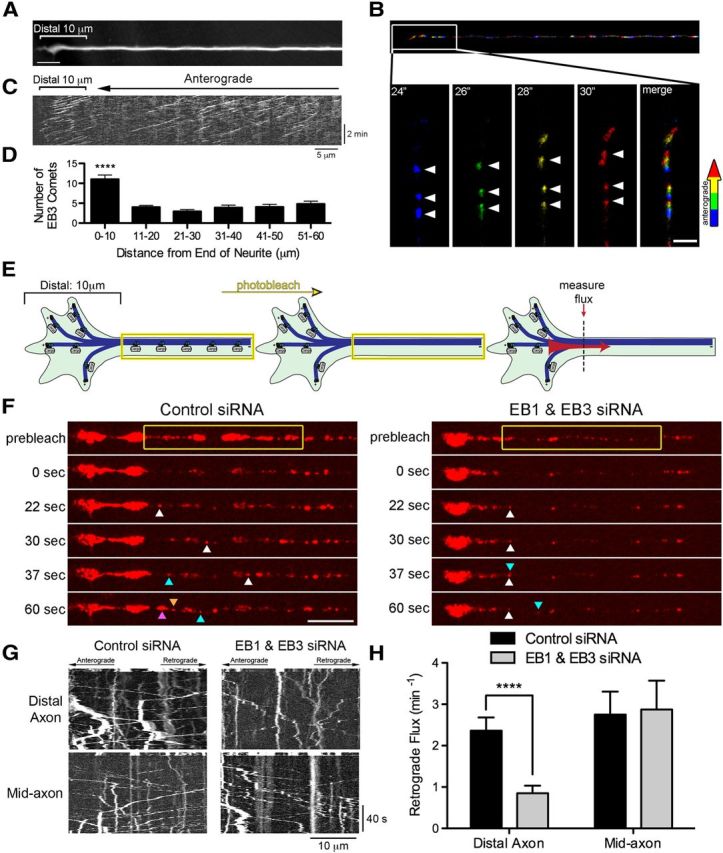
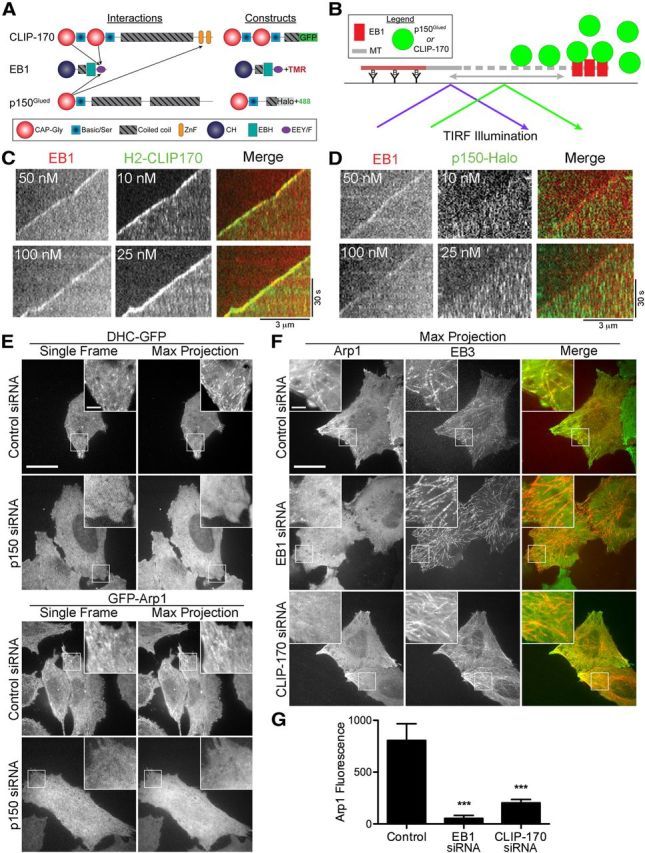
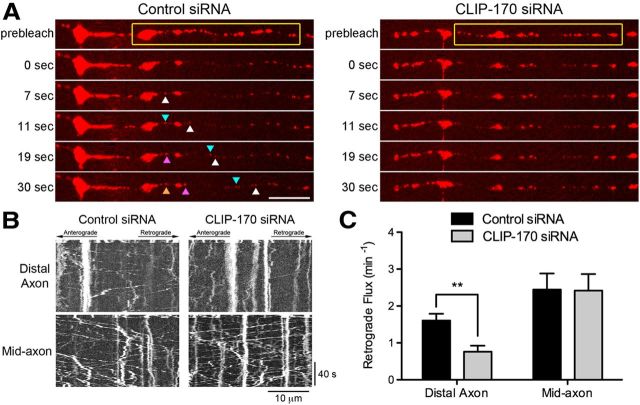
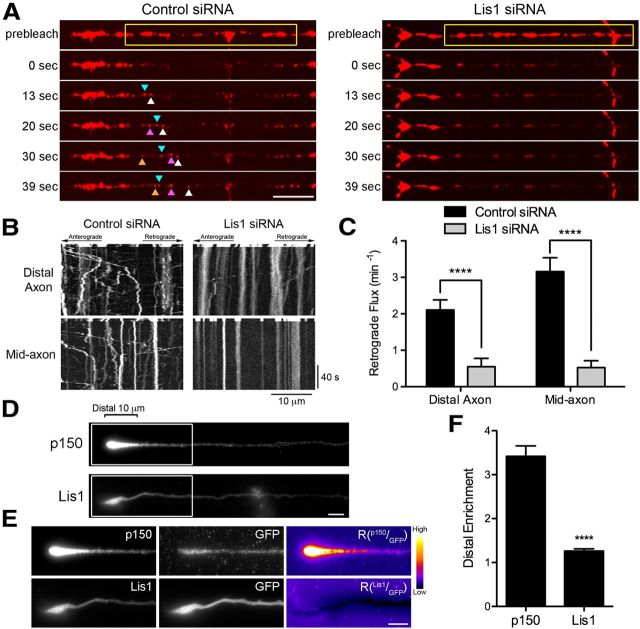
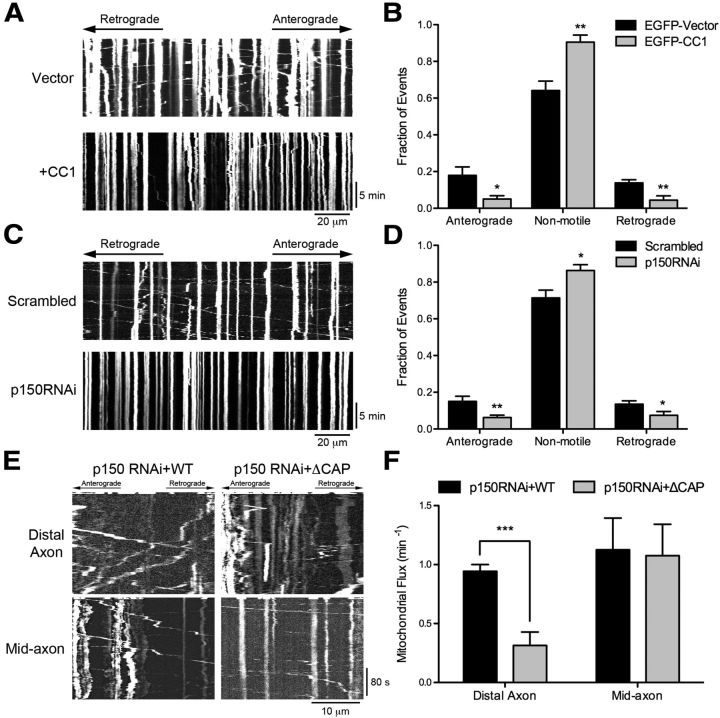
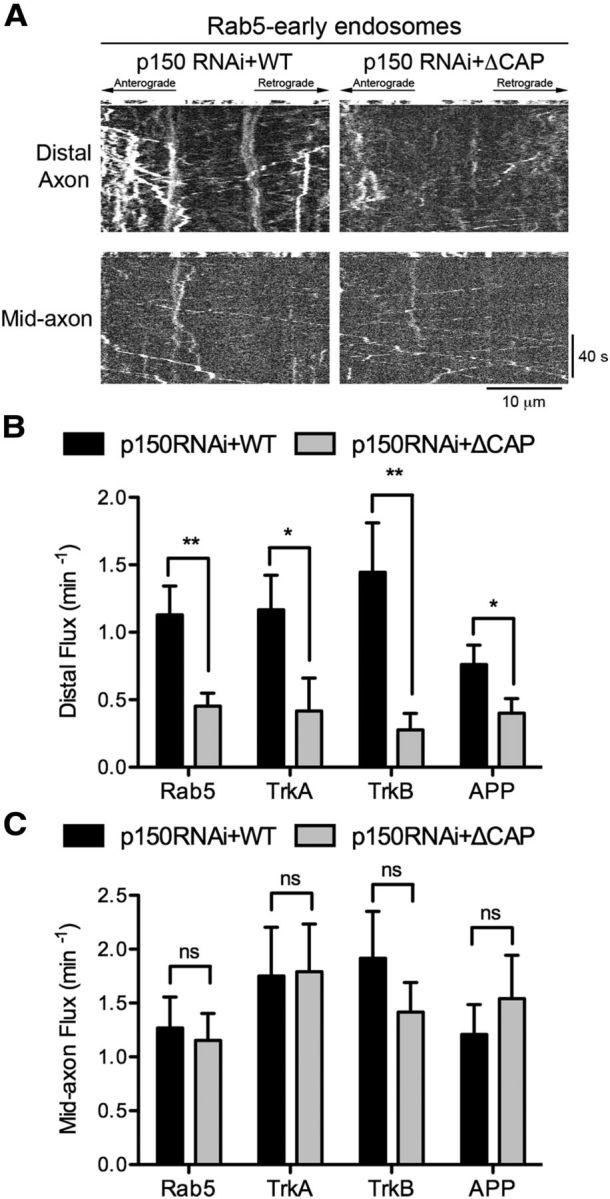
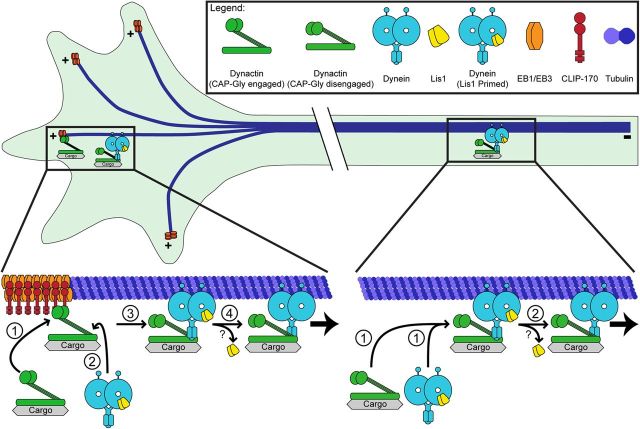
Long-range retrograde axonal transport in neurons is driven exclusively by the microtubule motor cytoplasmic dynein. The efficient initiation of dynein-mediated transport from the distal axon is critical for normal neuronal function, and neurodegenerative disease-associated mutations have been shown to specifically disrupt this process. Here, we examine the role of dynamic microtubules and microtubule plus-end binding proteins (+TIPs) in the initiation of dynein-mediated retrograde axonal transport using live-cell imaging of cargo motility in primary mouse dorsal root ganglion neurons. We show that end-binding (EB)-positive dynamic microtubules are enriched in the distal axon. The +TIPs EB1, EB3, and cytoplasmic linker protein-170 (CLIP-170) interact with these dynamic microtubules, recruiting the dynein activator dynactin in an ordered pathway, leading to the initiation of retrograde transport by the motor dynein. Once transport has initiated, however, neither the EBs nor CLIP-170 are required to maintain transport flux along the mid-axon. In contrast, the +TIP Lis1 activates transport through a distinct mechanism and is required to maintain processive organelle transport along both the distal and mid-axon. Further, we show that the EB/CLIP-170/dynactin-dependent mechanism is required for the efficient initiation of transport from the distal axon for multiple distinct cargos, including mitochondria, Rab5-positive early endosomes, late endosomes/lysosomes, and TrkA-, TrkB-, and APP-positive organelles. Our observations indicate that there is an essential role for +TIPs in the regulation of retrograde transport initiation in the neuron.


Figures

Figure 1.
Figure 1.
EB proteins are enriched at neurite tips and promote efficient transport from the distal axon. A, Morphology of the distal end of a DRG neuron obtained by averaging the time-lapse recording of EB3-GFP. Scale bar, 5 μm. B, Time series of EB3-GFP comets in the distal axon color coded by frame. Top, Merge of the color-coded time series from the neurite shown in A. Bottom, Insets showing enlargements of the box area through time. Arrowheads demarcate numerous anterograde-moving comets in the distal axon. Scale bar, 2 μm. C, Kymograph of EB3-GFP comets from the neurite shown in A reveals the pronounced enrichment of EB3 comets in the distal 10 μm of the axon. D, Histogram of the number of EB3-GFP comets as a function of distance along the axon. Data are shown as mean ± SEM; n = 16 neurites; ****p < 0.0001, one-way ANOVA. E, Schematic of the photobleaching experiment used to assess distal cargo flux. For distal flux, a zone 10 μm proximal to the neurite end was photobleached because an increase in dynamic microtubules was observed in the distal 10 μm of the neuron, whereas for mid-axon flux, a zone >100 μm proximal to the neurite end was photobleached. Entry of cargos into the bleach zone was assessed with time-lapse imaging; images were acquired at 2 frames/s for 5 s before photobleaching and 120 s after photobleaching. F, Time series of LAMP1-RFP motility in the distal axon of DRG neurons imaged at 4 DIV. DRG neurons were transfected with either control siRNAs or siRNA against both EB1 and EB3. The yellow box demarcates the photobleached zone; 0 s is the first frame after photobleaching. The different colored arrowheads demarcate LAMP1-positive cargos moving into the photobleached zone. Scale bar, 10 μm. G, Kymographs of both the time series of the distal axon LAMP1-RFP motility shown in F and the mid-axon LAMP1-RFP motility. Kymographs are of the photobleached zone before and after photobleaching and represent movement over time so that moving organelles appear as diagonal lines whereas stationary organelles appear as vertical lines. Scale bars, 10 μm and 40 s for the x and y axes, respectively. H, Quantification of distal and mid-axon retrograde flux after photobleaching. Flux was determined by counting the number of retrograde vesicles that moved >3.5 μm into the photobleached zone. Data are shown as mean ± SEM; for distal flux, n = 18–20 neurites per condition from two independent experiments; for mid-axon flux, n = 12 neurites per condition; ****p < 0.0001, Student's t test.
Figure 2.
Figure 2.
EB1 is required but is not sufficient for microtubule plus-end tracking by dynactin. A, Domain organization and binding interactions of the +TIPs CLIP-170 EB1 and p150Glued and schematics of the constructs used in the in vitro assays shown in C and D. B, Schematic of the in vitro TIRF assay in which microtubule dynamics were reconstituted with purified tubulin. EB1 and either p150Glued or CLIP-170 was added to assay microtubule plus-end tracking. C, D, Kymographs from the in vitro reconstitution of microtubule dynamics imaged with TIRF microscopy. EB1 was labeled directly with rhodamine dye, the p150-Halo fragment was labeled with an Alexa Fluor-488 Halo ligand, and the CLIP-170 H2 fragment was expressed with a GFP-tag. EB1 and CLIP-170 (C) or EB1 and p150Glued (D) were added to the imaging chamber containing dynamic microtubules. EB1 dynamically tracks along the growing microtubule plus-end. EB1 effectively recruits CLIP-170 but is not sufficient to recruit p150Glued to the dynamic microtubule plus-end. E, HeLa cells stably expressing either DHC-GFP or GFP-Arp1 were treated with control siRNA or siRNA against p150Glued and then live-cell imaging was performed. Single frames from the image stack reveal bright, comet-like structures, whereas the maximum projection of the image stack reveals extended tracks. Both of these observations are consistent with the dynamic tracking of dynein and dynactin along the microtubule plus-end. Knock-down of p150Glued abolishes the plus-end localization of both dynein and dynactin. F, Maximum projections from live-cell imaging of HeLa cells stably expressing GFP-Arp1. Cell were transfected with mCherry-EB3 and treated with control siRNA, siRNA against EB1, or siRNA against CLIP-170. The colocalization of GFP-Arp1 with mCherry-EB3 is abolished by knock-down of either EB1 or CLIP-170. G, Average intensity of GFP-Arp1 fluorescence along EB3 tracks from maximum projection images from control cells stably expressing GFP-Arp1 or from GFP-Arp1 cells depleted of either EB1 or CLIP-170. Data are shown as mean ± SEM; n = 10 tracks per condition; ***p < 0.001, one-way ANOVA. Scale bars, 20 and 3 μm for the inset unless otherwise noted.
Figure 3.
Figure 3.
CLIP-170 is necessary for efficient transport initiation from the distal axon. A, Time series of LAMP1-RFP motility in the distal axon of DRG neurons imaged at 4 DIV. DRG neurons were transfected with either control siRNAs or siRNA against CLIP-170. The yellow box demarcates the photobleached zone; 0 s is the first frame after photobleaching. The different colored arrowheads demarcate LAMP1-RFP-positive cargos moving into the photobleached zone. Significantly fewer cargos entered the photobleached zone after CLIP-170 knock-down. Scale bar, 10 μm. B, Kymographs of the time series of the distal axon LAMP1-RFP motility shown in A and the mid-axon LAMP1-RFP motility. Scale bars, 10 μm and 40 s for the x and y axes, respectively. C, Quantification of distal and mid-axon retrograde flux after photobleaching. Flux was determined by counting the number of retrograde vesicles that moved >3.5 μm into the photobleached zone. Data are shown as mean ± SEM; for distal and mid-axon flux, n = 19–20 neurites per condition from two independent experiments; **p < 0.01, Student's t test.
Figure 4.
Figure 4.
Lis1 is necessary for retrograde transport initiation from both the distal and mid-axon. A, Time series of LAMP1-RFP motility in the distal axon of DRG neurons imaged at 4 DIV. DRG neurons were transfected with either control siRNAs or siRNA against Lis1. The yellow box demarcates the photobleached zone; 0 s is the first frame after photobleaching. The different colored arrowheads demarcate LAMP1-RFP-positive cargos moving into the photobleached zone. No cargos entered the photobleached zone after Lis1 knock-down. Scale bar, 10 μm. B, Kymographs of the time series of the distal axon LAMP1-RFP motility shown in A and the mid-axon LAMP1-RFP motility. Scale bars, 10 μm and 40 s for the x and y axes, respectively. C, Quantification of distal and mid-axon retrograde flux after photobleaching. Flux was determined by counting the number of retrograde vesicles that moved >3.5 μm into the photobleached zone. Data are shown as mean ± SEM; for distal and mid-axon flux, n = 19–20 neurites per condition from two independent experiments. D, Distal end of DRG neurons at 2DIV stained for the endogenous p150Glued subunit of dynactin and endogenous Lis1. Scale bar, 5 μm. E, Enlarged view of the distal end of DRG neurons. Neurons were transfected with GFP as a marker of cytoplasmic volume and stained for either p150Glued or Lis1. The p150, Lis1, and GFP images were individually contrast enhanced to display both axonal and tip staining. The raw p150 and Lis1 signals were divided by the corresponding raw GFP signal to create the ratio image (Rp150/GFP or RLis1/GFP). These ratio images show the distal accumulation of p150Glued or Lis1 relative to GFP. These ratio images were contrast enhanced to the same level. A heat map was applied (warmer colors represent a higher ratio, whereas cooler colors represent a lower ratio) to show the relative intensities. Scale bar, 5 μm. F, Quantification of the distal enrichment. The mean p150Glued and Lis1 fluorescence intensity in the distal 10 μm of the axon was measured and then normalized to corresponding mean GFP intensity. The normalization controls for differences in the cytoplasmic volume so that the value represents the enrichment of p150Glued or Lis1 in the distal axon. Data are shown as mean ± SEM; n = 59–65 neurites per condition; ****p < 0.0001, Student's t test.
Figure 5.
Figure 5.
Dynein-dynactin is required for the bidirectional transport of mitochondria and efficient initiation of transport from the distal axon. A, Kymographs of DsRed-Mito motility along the axon of DRG neurons imaged at 2 DIV after transfection with either EGFP or EGFP-CC1. Images were acquired at 1 frame/3 s for 15 min. Scale bars, 20 μm and 5 min for the x and y axes, respectively. B, Quantification of mitochondrial motility after CC1 transfection. Mitochondrial moving >10 μm in either direction along the length of the kymograph were considered anterograde or retrograde, whereas cargos moving <10 μm were considered nonmotile. Expression of CC1 significantly disrupts anterograde and retrograde motility and increases nonmotile events. Data are shown as mean ± SEM; n = 6–7 neurites per condition. C, Kymographs of DsRed-Mito motility along the axon of DRG neurons imaged at 4 DIV after transfection with scrambled siRNAs or siRNA against p150Glued. Images were acquired at 1 frame/3 s for 15 min. Scale bars, 20 μm and 5 min for the x and y axes, respectively. D, Quantification of mitochondrial motility after p150Glued knock-down, as described in B. Depletion of p150Glued significantly disrupts the bidirectional transport of mitochondria. Data are shown as mean ± SEM; n = 10 neurites per condition. E, Kymographs of DsRed-Mito motility in DRG neurons imaged at 4 DIV after siRNA knock-down of p150Glued and rescue with either full-length wild-type p150Glued or ΔCAP-Gly p150Glued. For distal flux, a zone 10 μm proximal to the neurite end was photobleached; for mid-axon flux, a zone >100 μm proximal to the neurite end was photobleached, as described in Figure 1E. Images were acquired at 2 frames/s for 5 s before photobleaching and 300 s after photobleaching. Kymographs are of the photobleached zone before and after photobleaching. Scale bars, 10 μm and 80 s for the x and y axes, respectively. F, Quantification of distal and mid-axon retrograde flux. Flux was determined by counting the number of retrograde vesicles that moved >3.5 μm into the photobleached zone. Data are shown as mean ± SEM; for distal flux, n = 7 neurites per condition; for mid-axon flux, n = 8 neurites per condition; ***p < 0.001, **p < 0.01, *p < 0.05, Student's t test.
Figure 6.
Figure 6.
Dynactin promotes the efficient initiation of transport for multiple cargo types. A, Kymographs of Rab5 motility in DRG neurons imaged at 4 DIV after siRNA knock-down of p150Glued and rescue with either full-length wild-type p150Glued or ΔCAP-Gly p150Glued. For distal flux, a zone 10 μm proximal to the neurite end was photobleached; for mid-axon flux, a zone >100 μm proximal to the neurite end was photobleached, as described in Figure 1E. Entry of cargos into the bleach zone was assessed with time-lapse imaging. Kymographs are of the photobleached zone before and after photobleaching. Scale bars, 10 μm and 40 s for the x and y axes, respectively. B, Quantification of the retrograde flux from the distal axon for Rab5 early endosomes, TrkA- and TrkB-signaling endosomes, and APP vesicles after siRNA knock-down of p150Glued and rescue with either full-length wild-type p150Glued or ΔCAP-Gly p150Glued. Flux was determined by counting the number of retrograde vesicles that moved >3.5 μm into the photobleached zone. Data are shown as mean ± SEM; n = 9–25 neurites per condition. C, Quantification of mid-axon retrograde flux for Rab5 early endosomes, TrkA- and TrkB-signaling endosomes, and APP vesicles after siRNA knock-down of p150Glued and rescue with either full-length wild-type p150Glued or ΔCAP-Gly p150Glued. Flux was determined as in B. Data are shown as mean ± SEM; n = 12–13 neurites per condition; **p < 0.01, *p < 0.05, ns: not significant p > 0.05, Student's t test.
Figure 7.
Figure 7.
Model for the initiation of dynein-mediated retrograde transport in neurons. We propose two synergistic pathways for retrograde transport initiation in the neuron: the EB/CLIP-170/dynactin pathway and the Lis1 pathway. The EB/CLIP-170/dynactin pathway is necessary only in the distal axon, likely due to the locally high concentration of dynamic microtubule plus-ends. The dynamically growing plus-ends recruit EBs, which in turn recruit CLIP-170. The CAP-Gly domain of p150Glued then binds to CLIP-170, thereby recruiting the dynactin complex onto the microtubule plus-end. Subsequently, Lis1-primed dynein binds to dynactin and this binding may lead to the disengagement of CAP-Gly domain from the +TIP complex. Lis1 is likely released and then retrograde transport is initiated. Lis1 release from the motile dynein complex has been observed in filamentous fungi (Lenz et al., 2006; Egan et al., 2012), but not yet in mammalian neurons. In the mid-axon, the microtubule cytoskeleton is less dynamic, so the EB/CLIP-170/dynactin pathway is not required. Lis1-primed dynein is recruited to the microtubule. Once dynein and dynactin bind, Lis1 is released and retrograde transport initiates.

References

    1. Akhmanova A, Steinmetz MO. Tracking the ends: a dynamic protein network controls the fate of microtubule tips. Nat Rev Mol Cell Biol. 2008;9:309–322. doi: 10.1038/nrm2369. - DOI - PubMed
    1. Akhmanova A, Mausset-Bonnefont AL, van Cappellen W, Keijzer N, Hoogenraad CC, Stepanova T, Drabek K, van der Wees J, Mommaas M, Onderwater J, van der Meulen H, Tanenbaum ME, Medema RH, Hoogerbrugge J, Vreeburg J, Uringa EJ, Grootegoed JA, Grosveld F, Galjart N. The microtubule plus-end-tracking protein CLIP-170 associates with the spermatid manchette and is essential for spermatogenesis. Genes and development. 2005;19:2501–2515. doi: 10.1101/gad.344505. - DOI - PMC - PubMed
    1. Askham JM, Vaughan KT, Goodson HV, Morrison EE. Evidence that an interaction between EB1 and p150(Glued) is required for the formation and maintenance of a radial microtubule array anchored at the centrosome. Mol Biol Cell. 2002;13:3627–3645. doi: 10.1091/mbc.E02-01-0061. - DOI - PMC - PubMed
    1. Berrueta L, Tirnauer JS, Schuyler SC, Pellman D, Bierer BE. The APC-associated protein EB1 associates with components of the dynactin complex and cytoplasmic dynein intermediate chain. Curr Biol. 1999;9:425–428. - PubMed
    1. Bieling P, Laan L, Schek H, Munteanu EL, Sandblad L, Dogterom M, Brunner D, Surrey T. Reconstitution of a microtubule plus-end tracking system in vitro. Nature. 2007;450:1100–1105. doi: 10.1038/nature06386. - DOI - PubMed

Publication types

MeSH terms

LinkOut - more resources