Comparative Study
. 2013 Aug;134(2):1407-15.
doi: 10.1121/1.4812269.

Pitch- and spectral-based dynamic time warping methods for comparing field recordings of harmonic avian vocalizations

Affiliations
Comparative Study

Pitch- and spectral-based dynamic time warping methods for comparing field recordings of harmonic avian vocalizations

C Daniel Meliza et al. J Acoust Soc Am. 2013 Aug.

Abstract

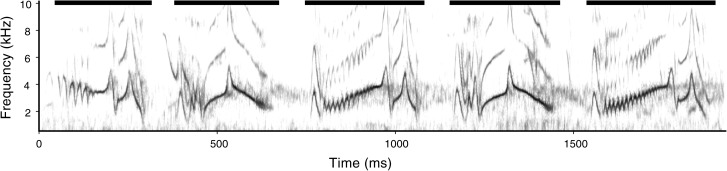
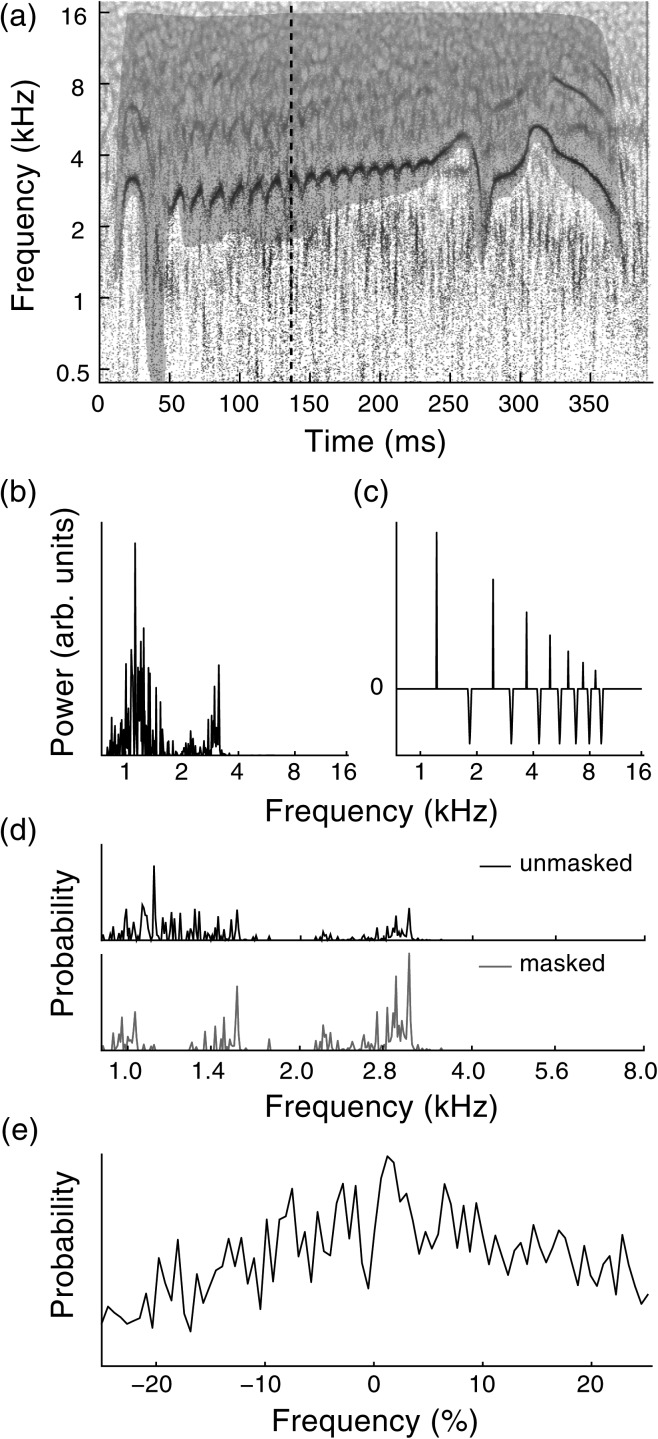
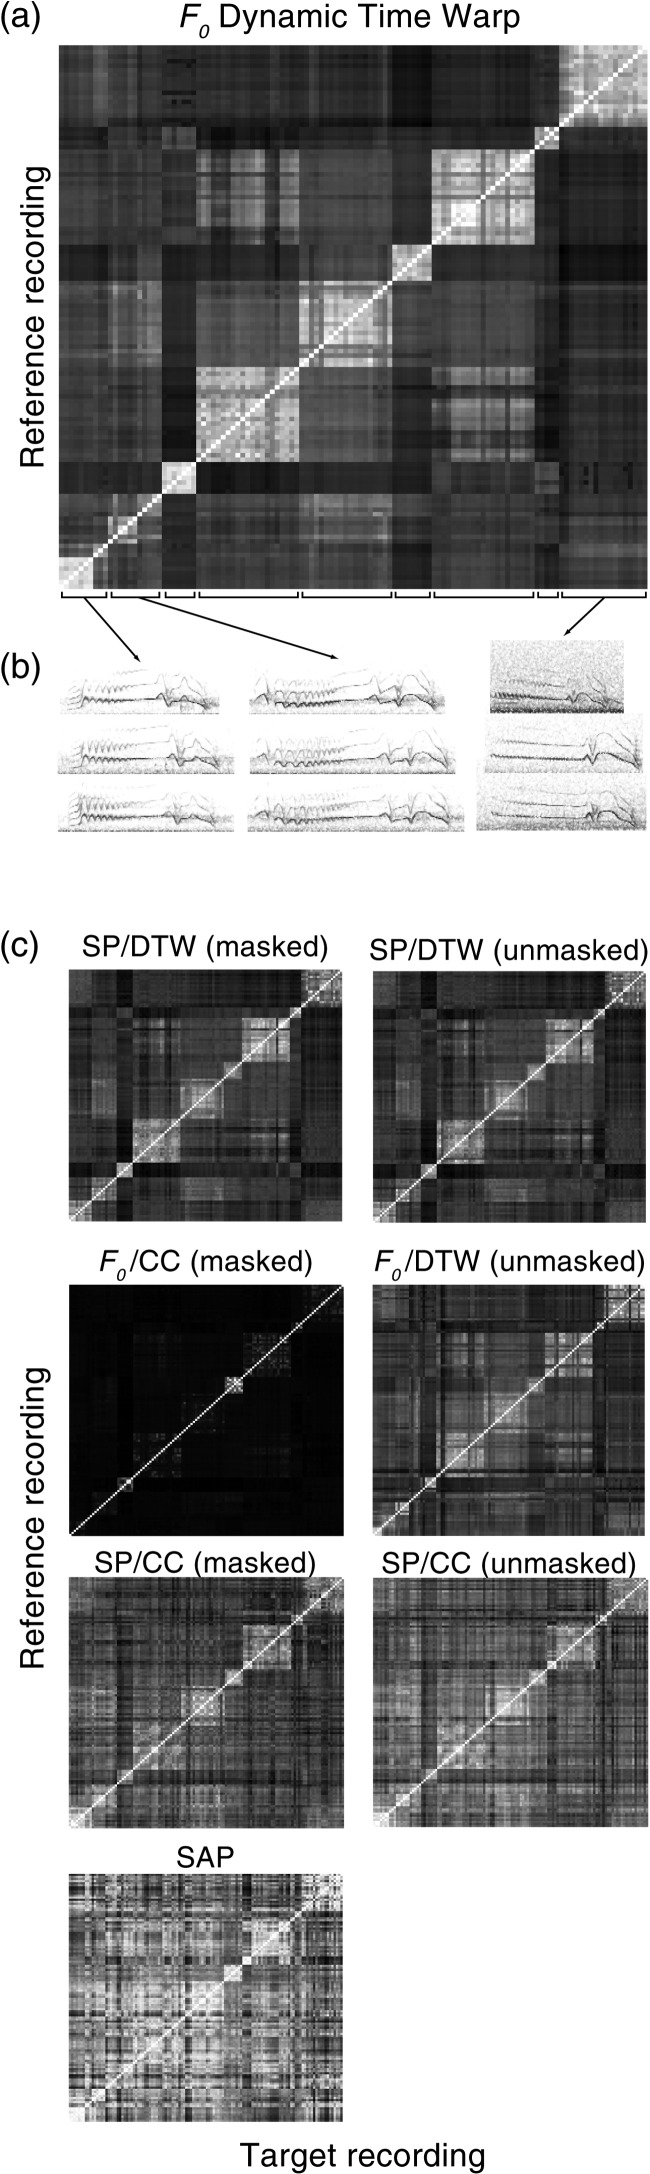
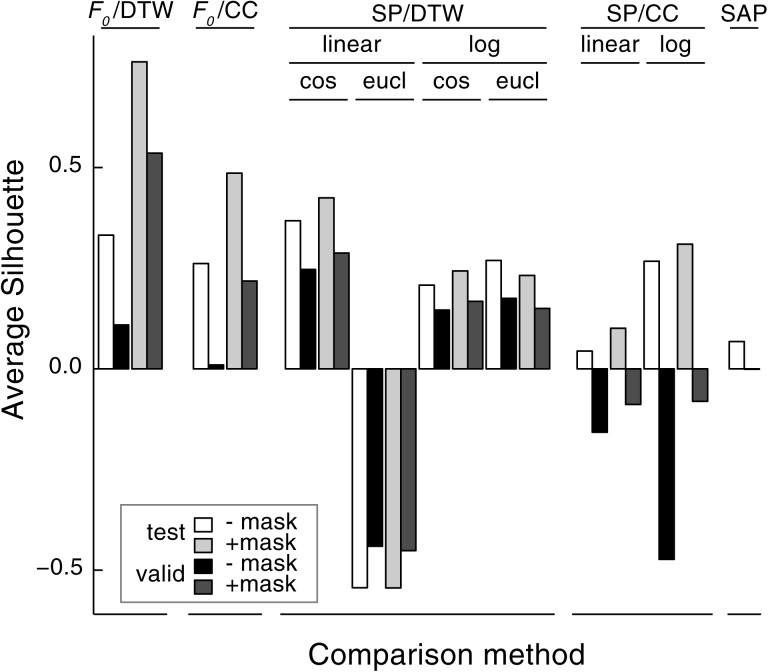
Quantitative measures of acoustic similarity can reveal patterns of shared vocal behavior in social species. Many methods for computing similarity have been developed, but their performance has not been extensively characterized in noisy environments and with vocalizations characterized by complex frequency modulations. This paper describes methods of bioacoustic comparison based on dynamic time warping (DTW) of the fundamental frequency or spectrogram. Fundamental frequency is estimated using a Bayesian particle filter adaptation of harmonic template matching. The methods were tested on field recordings of flight calls from superb starlings, Lamprotornis superbus, for how well they could separate distinct categories of call elements (motifs). The fundamental-frequency-based method performed best, but the spectrogram-based method was less sensitive to noise. Both DTW methods provided better separation of categories than spectrographic cross correlation, likely due to substantial variability in the duration of superb starling flight call motifs.


Figures

Figure 1
Figure 1
Spectrogram of an exemplar superb starling flight call bout. Darker shades indicate increasing power (log scale). Horizontal black bars above the spectrogram indicate the component motifs.
Figure 2
Figure 2
(Color online) Example of F0 tracking analysis. (a) Time-frequency reassignment spectrogram of a superb starling flight call motif. Shaded region is a manually drawn mask used to reduce influence of low-frequency noise. Dashed line indicates time frame analyzed in subsequent panels. (b) Power spectrum in example time frame. Note the peak corresponding to the fundamental frequency of the vocalization, around 3 kHz, is small relative to the low-frequency noise. (c) Harmonic template, with logarithmically spaced peaks to detect harmonic structure. (d) Cross correlations of spectrum with harmonic template. Masking the spectrogram [shaded polygon in (a)] reduces low-frequency interference so that the highest peak corresponds to the fundamental frequency. (e) Cross correlation between the example frame and the following time point, which is used by the particle filter to smooth estimates. The peak at +2% indicates F0 is increasing.
Figure 3
Figure 3
F0 tracking performance on noisy recordings. (a) Spectrograms of six exemplar motifs. Numbers in each panel indicate signal-to-noise ratio (dB RMS). Red traces indicate F0 estimates without masking; blue traces indicate estimates after masking. In the final panel, the signal is barely visible and the F0 estimate is extremely noisy. Dynamic range of the spectrograms is 50 dB, and the time and frequency scales are the same for all plots. Arrowheads indicate reverberation. (b) Boxplot of average error (RMS difference between masked and unmasked F0 estimates) as a function of recording SNR. Thick horizontal lines indicate medians. The upper and lower edges of the boxes indicate upper and lower quartiles, and the vertical lines extend to 1.5 times the interquartile range. Outliers beyond the range of the whiskers are shown as points.
Figure 4
Figure 4
Similarity of superb starling flight calls calculated with different comparison methods. (a) Matrix of similarity scores for each pair of recordings from a test set comprising multiple exemplars of nine different motif types (indicated by brackets below matrix). Scores are calculated using DTW of the F0 contours with lighter shades indicating higher similarity. Motifs are indexed in the matrix by type so that cells corresponding to within-type comparisons are in blocks along the diagonal and between-type comparisons are off the diagonal. (b) Exemplars of recordings from three of the motif types. Note differences within types in duration, modulation rate, and background noise. (c) Similarity score matrices for some of the other comparison methods. SP/DTW: Dynamic time warping of spectrograms with linear spectrogram scale and cosine distance metric; F0/CC: Cross correlation of F0 contours; SP/CC: Spectrographic cross correlation with cosine distance metric; SAP: sound analysis pro. “Masked” indicates that a denoising mask was applied to the spectrograms prior to running the F0 estimation or spectrographic comparisons. Intensity maps are on a log scale for DTW scores due to their large range and on a linear scale for CC and SAP, which give scores bounded between 0 and 1.
Figure 5
Figure 5
Cluster separation (average silhouette) for pairwise-comparison metrics. Headings in capital letters are the comparison algorithms of which there were one or more variants. For the spectrographic metrics, subheadings indicate whether the power scale was linear or logarithmic, and whether spectrographic distance was calculated using a cosine (cos) or Euclidean (eucl) metric.

References

    1. Anderson, S. E., Dave, A. S., and Margoliash, D. (1996). “ Template-based automatic recognition of birdsong syllables from continuous recordings,” J. Acoust. Soc. Am. 100, 1209–1219. 10.1121/1.415968 - DOI - PubMed
    1. Auger, F., and Flandrin, P. (1995). “ Improving the readability of time-frequency and time-scale representations by the reassignment method,” IEEE Trans. Signal Process. 43, 1068–1089. 10.1109/78.382394 - DOI
    1. Baker, M. C., and Logue, D. M. (2003). “ Population differentiation in a complex bird sound: A comparison of three bioacoustical analysis procedures,” Ethology 109, 223–242. 10.1046/j.1439-0310.2003.00866.x - DOI
    1. Beecher, M. D., and Burt, J. M. (2004). “ The role of social interaction in bird song learning,” Curr. Dir. Psychol. Sci. 13, 224–228. 10.1111/j.0963-7214.2004.00313.x - DOI
    1. Beecher, M. D., Stoddard, P. K., Campbell, E. S., and Horning, C. L. (1996). “ Repertoire matching between neighbouring song sparrows,” Anim. Behav. 51, 917–923. 10.1006/anbe.1996.0095 - DOI - PubMed

Publication types