

Why it is hard to find genes associated with social science traits: theoretical and empirical considerations
- PMID: 23927501
- PMCID: PMC3778125
- DOI: 10.2105/AJPH.2013.301327
Why it is hard to find genes associated with social science traits: theoretical and empirical considerations
Erratum in
- Am J Public Health. 2014 Jan;104(1):e5
Abstract
Objectives: We explain why traits of interest to behavioral scientists may have a genetic architecture featuring hundreds or thousands of loci with tiny individual effects rather than a few with large effects and why such an architecture makes it difficult to find robust associations between traits and genes.
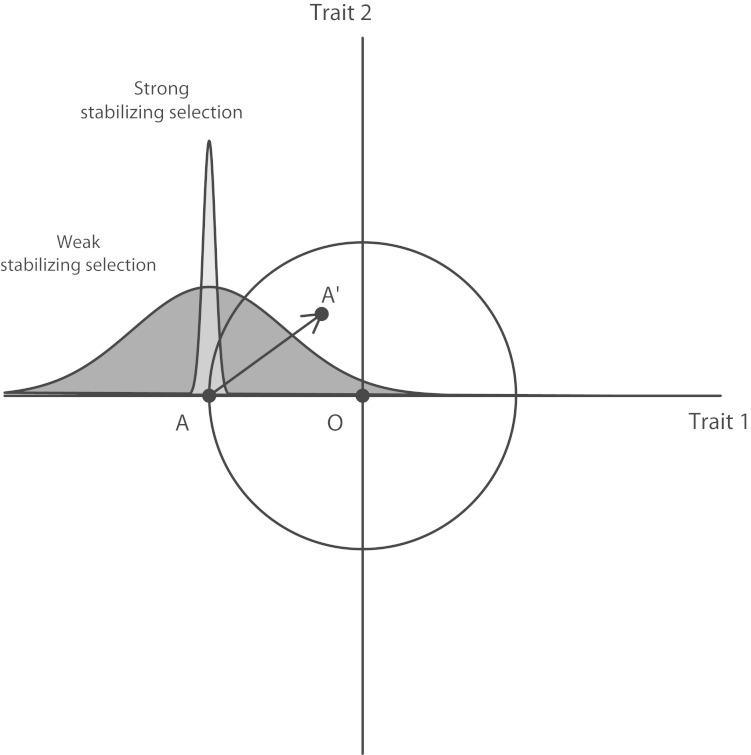
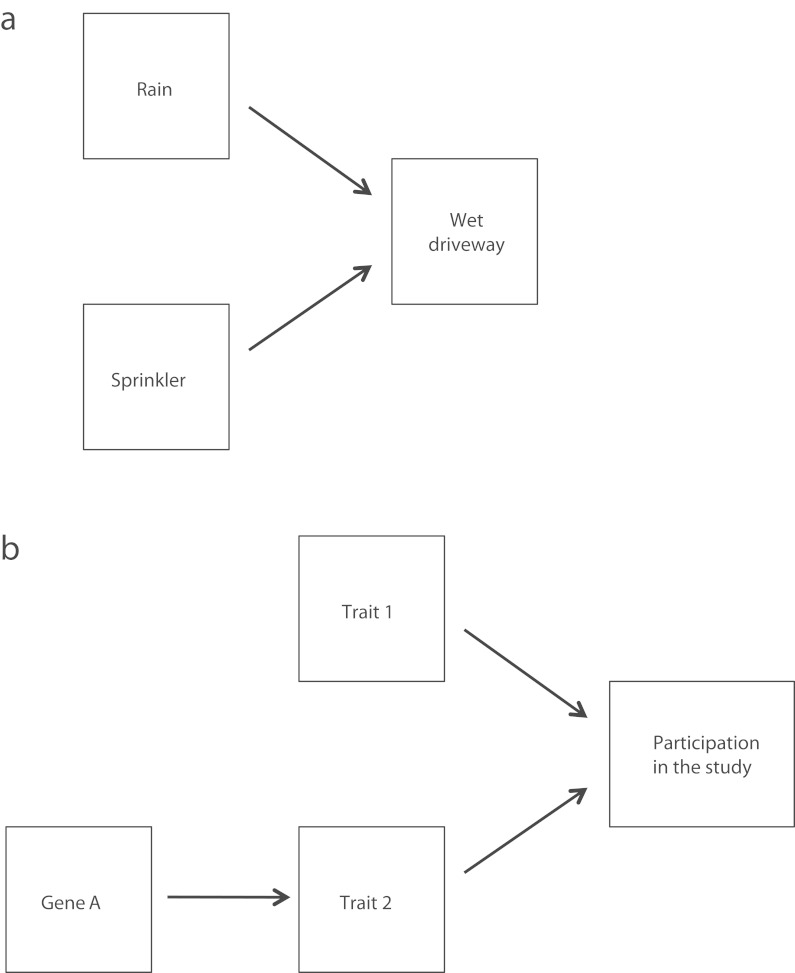
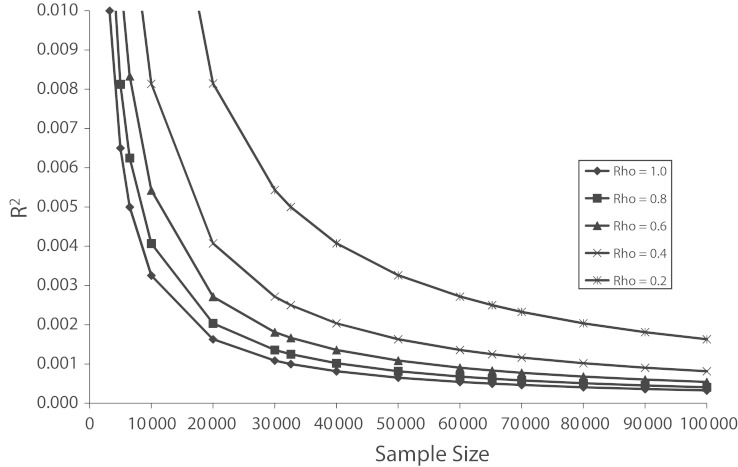
Methods: We conducted a genome-wide association study at 2 sites, Harvard University and Union College, measuring more than 100 physical and behavioral traits with a sample size typical of candidate gene studies. We evaluated predictions that alleles with large effect sizes would be rare and most traits of interest to social science are likely characterized by a lack of strong directional selection. We also carried out a theoretical analysis of the genetic architecture of traits based on R.A. Fisher's geometric model of natural selection and empirical analyses of the effects of selection bias and phenotype measurement stability on the results of genetic association studies.
Results: Although we replicated several known genetic associations with physical traits, we found only 2 associations with behavioral traits that met the nominal genome-wide significance threshold, indicating that physical and behavioral traits are mainly affected by numerous genes with small effects.
Conclusions: The challenge for social science genomics is the likelihood that genes are connected to behavioral variation by lengthy, nonlinear, interactive causal chains, and unraveling these chains requires allying with personal genomics to take advantage of the potential for large sample sizes as well as continuing with traditional epidemiological studies.
Figures
References
-
- Plomin R, DeFries JC, McClearn GE, McGuffin P. Behavioral Genetics. 5th ed. New York, NY: Worth Publishers; 2008.
-
- Turkheimer E. Three laws of behavior genetics and what they mean. Curr Dir Psychol Sci. 2000;9(5):160–164.
-
- Pinker S. The Blank Slate: The Modern Denial of Human Nature. New York, NY: Viking; 2002.
-
- Cecil JE, Tavendale R, Watt P, Hetherington MM, Palmer CAN. An obesity-associated FTO gene variant and increased energy intake in children. N Engl J Med. 2008;359(24):2558–2566. - PubMed
Publication types
MeSH terms
Grants and funding
LinkOut - more resources
Full Text Sources
Other Literature Sources
Medical
Miscellaneous
