. 2013 Dec:83:1051-62.
doi: 10.1016/j.neuroimage.2013.07.060. Epub 2013 Aug 6.

Automatic magnetic resonance spinal cord segmentation with topology constraints for variable fields of view

Affiliations

Automatic magnetic resonance spinal cord segmentation with topology constraints for variable fields of view

Min Chen et al. Neuroimage. 2013 Dec.

Abstract

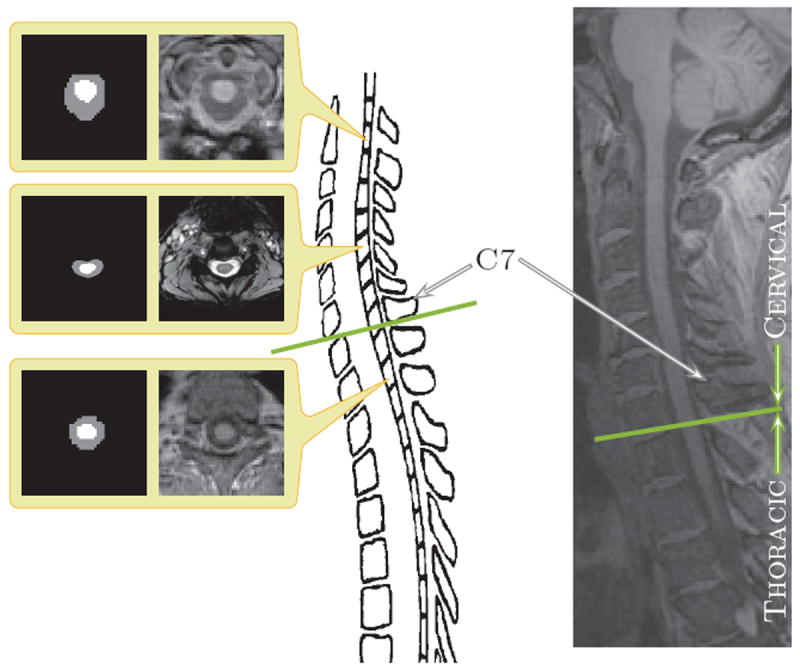
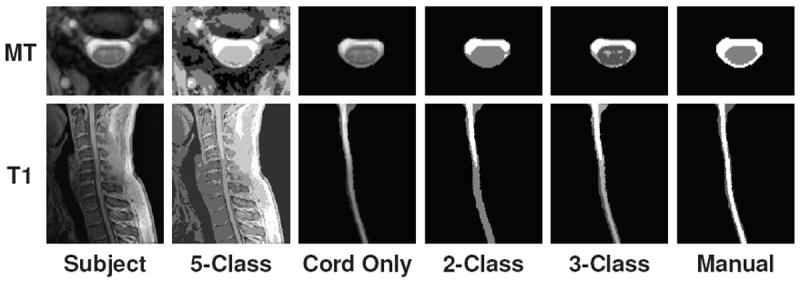
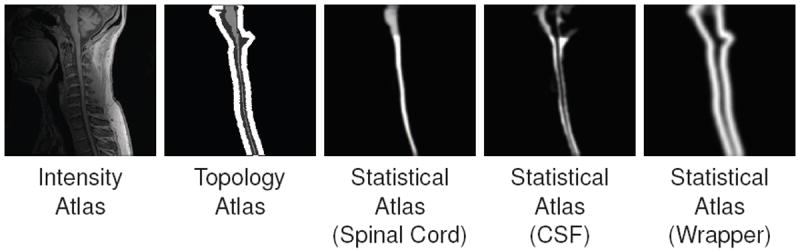
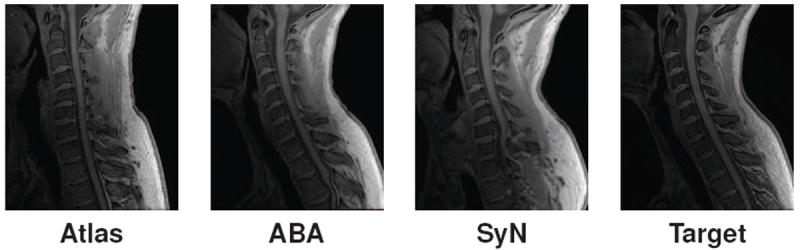
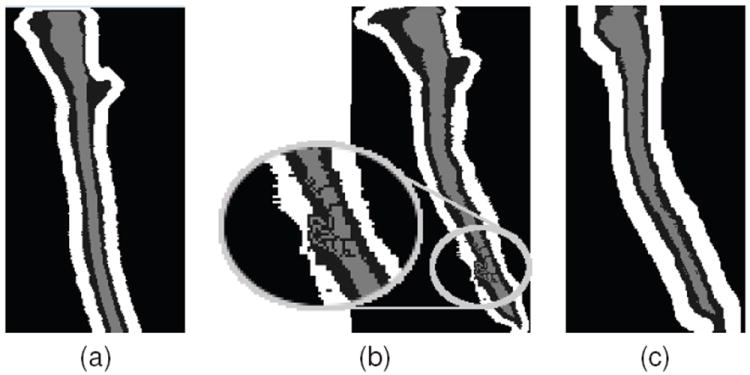
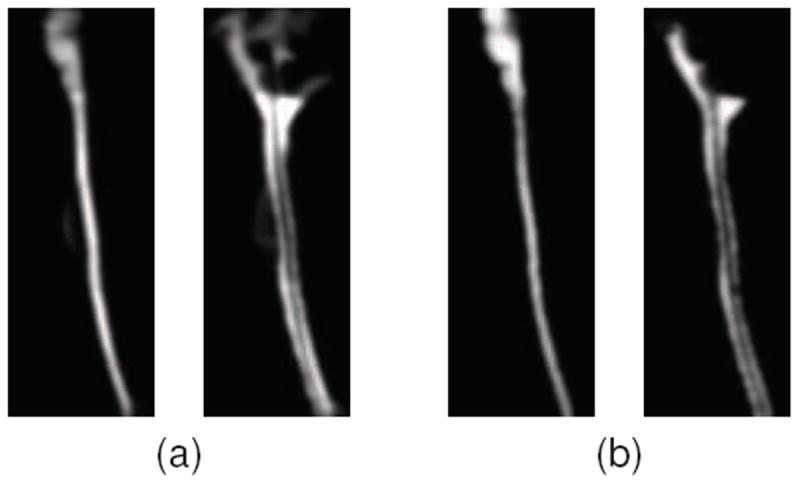
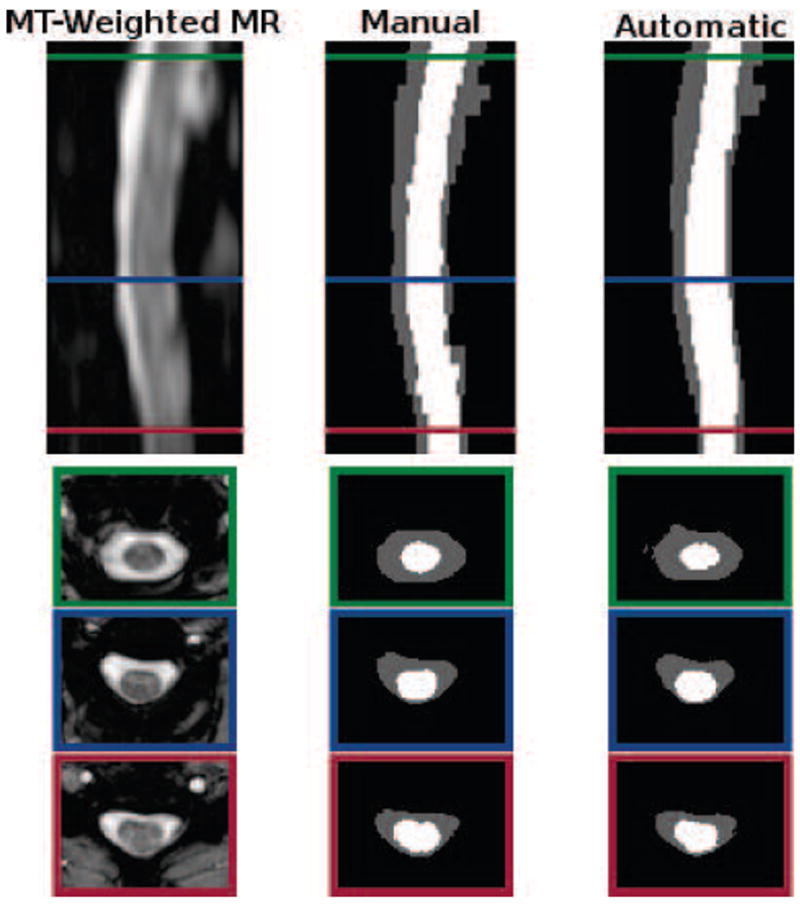
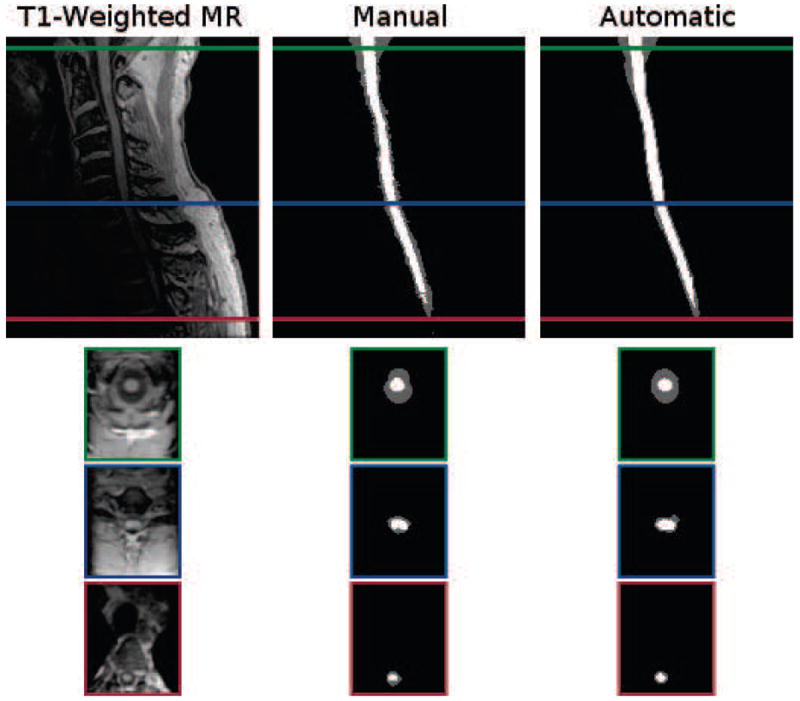
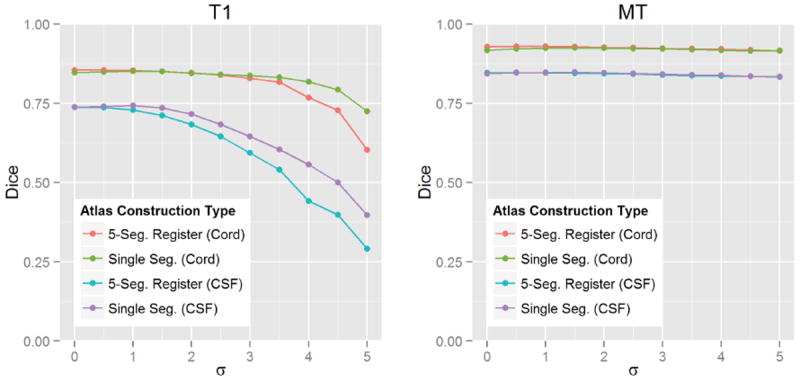
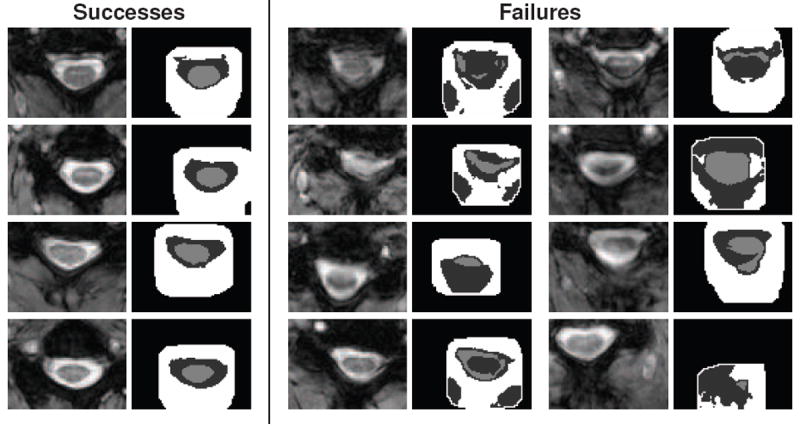
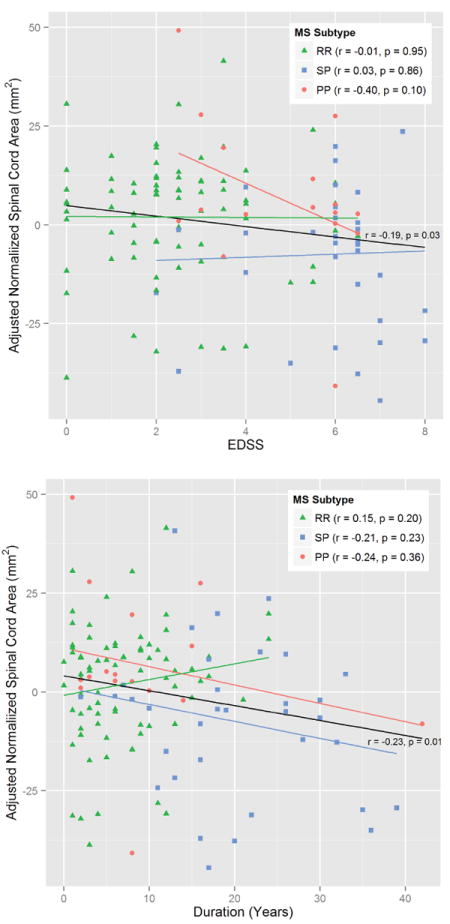
Spinal cord segmentation is an important step in the analysis of neurological diseases such as multiple sclerosis. Several studies have shown correlations between disease progression and metrics relating to spinal cord atrophy and shape changes. Current practices primarily involve segmenting the spinal cord manually or semi-automatically, which can be inconsistent and time-consuming for large datasets. An automatic method that segments the spinal cord and cerebrospinal fluid from magnetic resonance images is presented. The method uses a deformable atlas and topology constraints to produce results that are robust to noise and artifacts. The method is designed to be easily extended to new data with different modalities, resolutions, and fields of view. Validation was performed on two distinct datasets. The first consists of magnetization transfer-prepared T2*-weighted gradient-echo MRI centered only on the cervical vertebrae (C1-C5). The second consists of T1-weighted MRI that covers both the cervical and portions of the thoracic vertebrae (C1-T4). Results were found to be highly accurate in comparison to manual segmentations. A pilot study was carried out to demonstrate the potential utility of this new method for research and clinical studies of multiple sclerosis.

Keywords: Atlas construction; Digital homeomorphism; Magnetic resonance imaging; Spinal cord segmentation; Topology-preserving segmentation.


Figures

Figure 1
Figure 1
The center image is an illustration of a spinal cord. The left hand column shows (center) magnetization transfer-prepared T2*-weighted gradient-echo and (top and bottom) T1-weighted axial cross-sections of spinal cord MRIs and corresponding manual segmentations. The right-most column shows a sagittal slice of a T1-weighted MRI with a field of view covering the cervical and portions of the thoracic vertebrae. The green line in both the illustration and the sagittal slice on the right demarks the separation between the cervical and thoracic vertebrae.
Figure 2
Figure 2
Sagittally acquired T1-weighted MR slices of the spinal cord from four different healthy subjects at approximately the same field of view. This demonstrates the wide variability in the shape and curvature of the spinal cord in the images.
Figure 3
Figure 3
Examples of two, three, and five class segmentations using a standard tissue classification tool (Pham, 2001) on (top) axially acquired magnetization transfer-prepared T2*-weighted gradient-echo MRI and (bottom) sagittally acquired T1-weighted MRI of the spinal cord, each from separate healthy subjects. Results are shown for when the classification was performed on the full MRI (first two columns) and when the image was manually truncated to just the spinal cord and CSF (last four columns).
Figure 4
Figure 4
An example of the intensity, topology (spinal cord in light gray, CSF in dark gray, and wrapper in white) and statistical atlases constructed from a T1-weighted MRI.
Figure 5
Figure 5
Example of registrations between an intensity atlas and a target image using ABA and SyN.
Figure 6
Figure 6
(a) Shows a topology atlas (spinal cord in light gray, CSF in dark gray, and wrapper in white) before initializing with a deformation learned from registration. (b) Shows an example of a topology deadlock that can occur when initializing the entire topology atlas by a digital homeomorphic approximation of the deformation. (c) Shows the result when only the spinal cord is initialized by the homeomorphic deformation, and the remaining topology atlas is rebuilt dynamically.
Figure 7
Figure 7
Comparison of statistical priors of the spinal cord and CSF constructed using (a) the standard registration approach (with five segmentations) and (b) a single manual segmentation Gaussian smoothed. A kernel size of σ = 1 was used in both cases. Further explanation and details are in Section 4.2.
Figure 8
Figure 8
Cropped example of a MT-prepared T2*-weighted MRI segmentation by a human rater in comparison to the result from our algorithm. Shown are one sagittal and three axial views. The colored border around the axial slices denote the respective cross-section within the sagittal image. The Dice coefficient between the shown manual and automatic segmentations are 0.91 for the spinal cord (white) and 0.86 for the CSF (gray).
Figure 9
Figure 9
Cropped example of a T1-weighted MRI segmentation by a human rater in comparison to the result from our algorithm. Shown are one sagittal and three axial views. The colored border around the axial slices denote the respective cross-section within the sagittal image. The Dice coefficient between the shown manual and automatic segmentations are 0.87 for the spinal cord (white) and 0.73 for the CSF (gray).
Figure 10
Figure 10
Average Dice coefficient between automatic and manual segmentations when using statistical atlases built from the standard registration based approach (using five segmentations) and our single segmentation approach, at different levels of Gaussian smoothing (σ). The left plot shows the average results for five T1-weighted images, and the right shows the average results for five MT-weighted images.
Figure 11
Figure 11
Shown are axial slices for four successful segmentations and the only eight failures found when processing the 238 images in the MT cohort with the proposed algorithm. For each pair of images, the left shows a crop of the original MRI, while the right shows the respective spinal cord (light gray), CSF (dark gray), and wrapper (white) segmentation results from the algorithm.
Figure 12
Figure 12
Correlation plots showing the relationship between normalized spinal cord area (age and sex adjusted) with EDSS (top) and disease duration (bottom) for MS patients. The black line shows the relationship for all MS patients grouped together. The colored lines indicate the relationship for the specific subtypes — relapsing remitting (RR) in green, secondary progressive (SP) in blue, and primary progressive (PP) in red. The correlation (r) and significance (p) are given for each line.

References

    1. Archip N, Erard PJ, Egmont-Petersen M, Haefliger JM, Germond JF. A Knowledge-Based Approach to Automatic Detection of the Spinal Cord in CT Images. IEEE Trans Med Imag. 2002;21(12):1504–1516. - PubMed
    1. Avants BB, Tustison NJ, Song G, Cook PA, Klein A, Gee JC. A reproducible evaluation of ANTs similarity metric performance in brain image registration. NeuroImage. 2011;54(3):2033–2044. - PMC - PubMed
    1. Bazin PL, Ellingsen LM, Pham DL. Digital homeomorphisms in deformable registration. Proceedings of the International Conference on Information Processing in Medical Imaging (IPMI ’07); 2007. pp. 211–222. - PubMed
    1. Bazin PL, Pham DL. Homeomorphic brain image segmentation with topological and statistical atlases. Medical Image Analysis. 2008;12(5):616–625. - PMC - PubMed
    1. Bezdek JC. A Convergence Theorem for the Fuzzy ISODATA Clustering Algorithms. IEEE Trans on Pattern Anal Machine Intell. 1980;2(1):1–8. - PubMed

Publication types