. 2013 Nov;30(11):2383-400.
doi: 10.1093/molbev/mst136. Epub 2013 Aug 8.

The population genomics of repeated evolution in the blind cavefish Astyanax mexicanus

Affiliations

The population genomics of repeated evolution in the blind cavefish Astyanax mexicanus

Martina Bradic et al. Mol Biol Evol. 2013 Nov.

Abstract

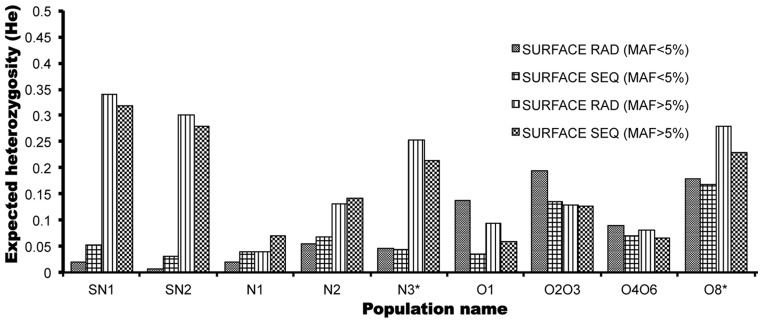
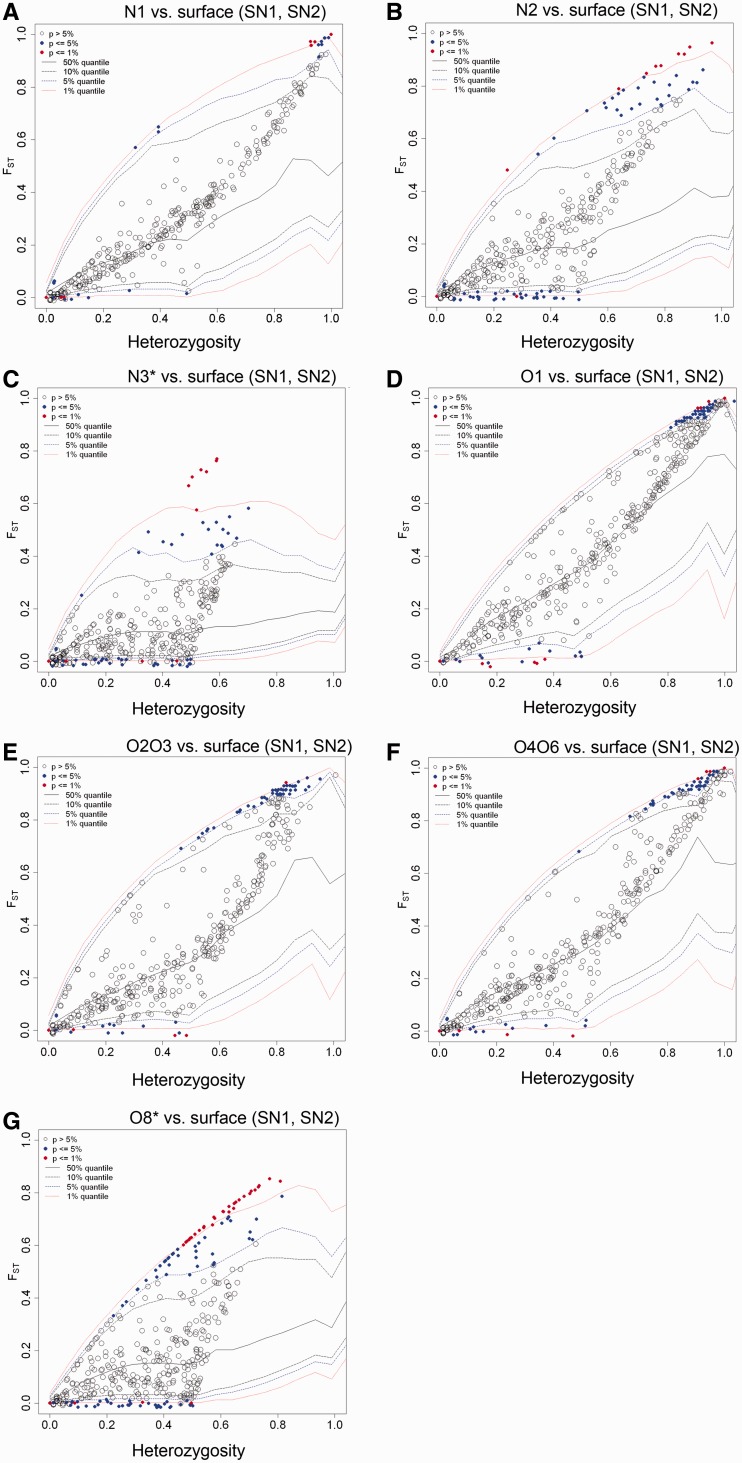
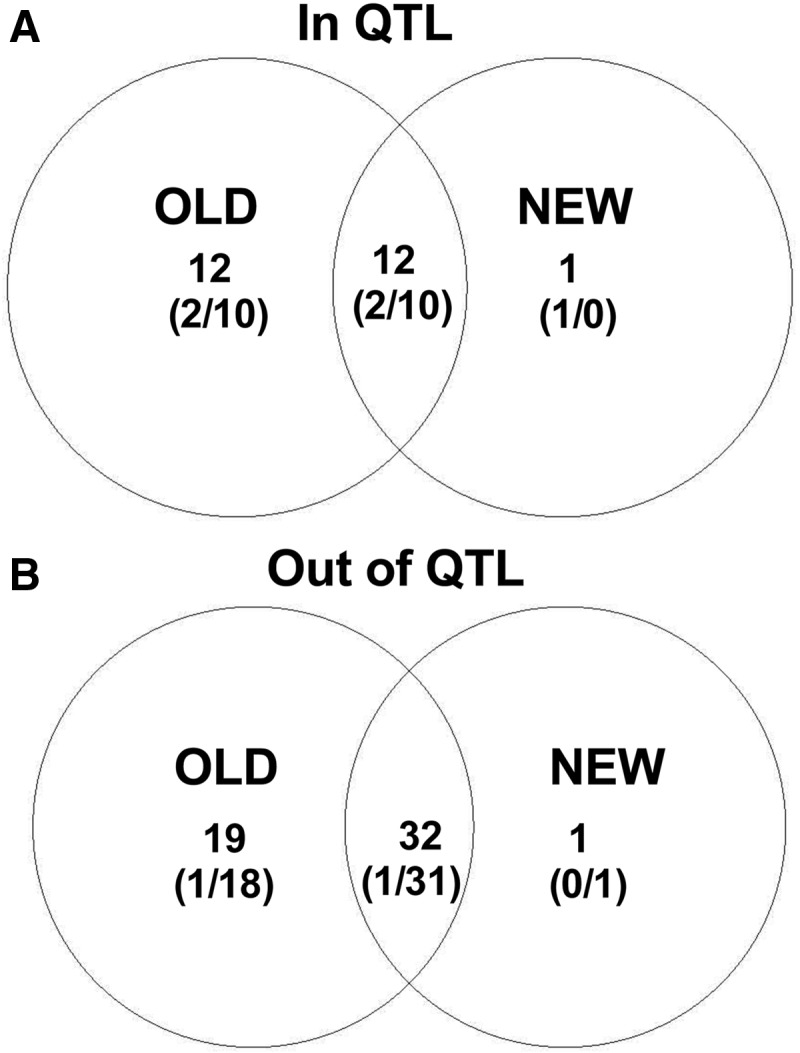
Distinct populations of Astyanax mexicanus cavefish offer striking examples of repeatable convergence or parallelism in their independent evolutions from surface to cave phenotypes. However, the extent to which the repeatability of evolution occurred at the genetic level remains poorly understood. To address this, we first characterized the genetic diversity of 518 single-nucleotide polymorphisms (SNPs), obtained through RAD tag sequencing and distributed throughout the genome, in seven cave and three groups of surface populations. The cave populations represented two distinct lineages (old and new). Thirty-one SNPs were significantly differentiated between surface and old cave populations, two SNPs were differentiated between surface and new cave populations, and 44 SNPs were significantly differentiated in both old and new cave populations. In addition, we determined whether these SNPs map to the same locations of previously described quantitative trait loci (QTL) between surface and cave populations. A total of 25 differentiated SNPs co-map with several QTL, such as one containing a fibroblast growth factor gene (Fgf8) involved in eye development and lens size. Further, the identity of many SNPs that co-mapped with QTL was the same in independently derived cave populations. These conclusions were further confirmed by haplotype analyses of SNPs within QTL regions. Our findings indicate that the repeatability of evolution at the genetic level is substantial, suggesting that ancestral standing genetic variation significantly contributed to the population genetic variability used in adaptation to the cave environment.

Keywords: QTL; RAD tag sequencing; SNP; convergence; parallelism; standing variation.


Figures

F<sc>ig</sc>. 1.
Fig. 1.
Geographical distribution of the studied populations from three distinct geographical regions in NE Mexico and a schematic representation of the comparisons between the populations. (A) Collecting sites from which we obtained cave and surface specimens of Astyanax mexicanus. Circles represent sampled populations and are labeled as follows: El Abra region: Cueva Pachón (O1), Cuevas Yerbaniz and Japonés (O2O3), Cuevas Arroyo and Curva (O4O6), Cueva Chica (O8*) (blue circles); Guatemala region: Cueva Molino (N1), Cueva Caballo Moro (N2) (red circles); Micos region: Cueva Río Subterráneo (N3*) (red circle); Surface localities: El Abra and Guatemala surface localities (SN1) Rio Subterráneo Valley surface locality (SN2). The populations groups, as defined here, represent independent instances of cave adaptation and the population designations follow prior usage (Bradic et al. 2012). (B) Population comparisons made in this study. We compared individual populations from either the new (red line) or old (blue line) cave lineages with surface populations (SN1 and SN2). Higher level comparisons were performed based on commonalities determined in each of two cave lineages in comparison to surface, representing instances of parallel evolution. We also compared loci identified in new cave and old cave groups to determine instances of convergent evolution (solid black line). The dotted black line designates the old cave population (O1) that was used in the F2 cross from which SNP markers were derived.
F<sc>ig</sc>. 2.
Fig. 2.
Trends in heterozygosity for different marker panels. Different histogram patterns represent different marker groups. Markers are divided in four groups; two groups based on the sequencing methodology used (RAD and Sanger sequencing), which are further divided into two more groups based on MAF in surface populations (MAF > 5% or MAF < 5%), as described in the legend. Surface populations: SN1 and SN2; New caves: N1, N2, and N3*; Old caves: O1, O2O3, O4O6, and O8*.
F<sc>ig</sc>. 3.
Fig. 3.
SNP locus-specific FST as a function of expected heterozygosity in cave vs. surface comparisons for 518 loci. Confidence envelopes corresponding to the 50%, 10%, 5%, and 1% quantiles are drawn as solid and dashed lines. Individual SNPs deviating from null expectations (derived from the hierarchical island model) are shown in blue (5% significance) or in red (1% significance). Open circles represent SNPs that were not significant. Per locus FST values were calculated at individual markers, with the following population structure: (A) N1 vs. surface (SN1 and SN2); (B) N2 vs. surface (SN1 and SN2); (C) N3* vs. surface (SN1 and SN2); (D) O1 vs. surface (SN1 and SN2); (E) O2O3 vs. surface (SN1 and SN2); (F) O4O6 vs. surface (SN1 and SN2); (G) O8* vs. surface (SN1 and SN2).
F<sc>ig</sc>. 4.
Fig. 4.
Venn diagram of the outlier loci identified in each cave lineage relative to surface populations and the number of shared outlier loci between the two lineages. (A) The number of outliers within QTL. (B) The number of outliers out of QTL. Outliers are also separated in both figures based on HIMAF SNPs and LOMAF SNPs (HIMAF SNPs/LOMAF SNPs, first and the second number in the bracket, respectively).
F<sc>ig</sc>. 5.
Fig. 5.
Haplotype structure within linkage groups of interest. These include all linkage groups having QTL associated with outlier SNPs, plus one linkage group without QTL (LG7) for contrast. LG7 was chosen because it had the most outlier SNPs of any linkage group. For each region, haplotypes estimated in each population group were pooled. (A) Three sets of comparisons and their P values are given for (i) surface vs. new cave, (ii) surface vs. old cave, and (iii) old vs. new cave over the Astyanax linkage groups. Significance of Rsb statistics between groups is shown as −log10 P value. The dotted lines on the graphs represent the 5% significance limit; observations exceeding that limit represent significant differentiation of the compared groups. Significant P values indicate much slower EHHS decay in one population than the other, and therefore represent possible evidence of selection. Different colors represent markers in different linkage groups. (B) Extended haplotype homozygosity of an individual SNP site (EHHS) across three linkage groups. (i) EHHS across LG25, (ii) EHHS across LG3, (iii) EHHS across LG16. The red line represents EHHS in new cave populations, the blue line represents EHHS in old cave populations and the black line represents EHHS in surface populations. New cave populations are N1, N2, and N3*, old cave populations are O1, O2O3, O4O6, and O8* and surface populations are SN1 and SN2.

References

    1. Arendt J, Reznick D. Convergence and parallelism reconsidered: what have we learned about the genetics of adaptation? Trends Ecol Evol. 2008;23:26–32. - PubMed
    1. Baird NA, Etter PD, Atwood TS, Currey MC, Shiver AL, Lewis ZA, Selker EU, Cresko WA, Johnson EA. Rapid SNP discovery and genetic mapping using sequenced RAD markers. PLoS One. 2008;3:e3376. - PMC - PubMed
    1. Barchi L, Lanteri S, Portis E, Acquadro A, Vale G, Toppino L, Rotino GL. Identification of SNP and SSR markers in eggplant using RAD tag sequencing. BMC Genomics. 2011;12:304. - PMC - PubMed
    1. Barrett RD, Rogers SM, Schluter D. Environment specific pleiotropy facilitates divergence at the Ectodysplasin locus in threespine stickleback. Evolution. 2009;63:2831–2837. - PubMed
    1. Baxter SW, Nadeau NJ, Maroja LS, et al. (20 co-authors) Genomic hotspots for adaptation: the population genetics of Mullerian mimicry in the Heliconius melpomene clade. PLoS Genet. 2010;6:e1000794. - PMC - PubMed

Publication types