. 2013:1048:247-84.
doi: 10.1007/978-1-62703-556-9_18.

Single-cell semiconductor sequencing

Affiliations

Single-cell semiconductor sequencing

Andrea B Kohn et al. Methods Mol Biol. 2013.

Abstract

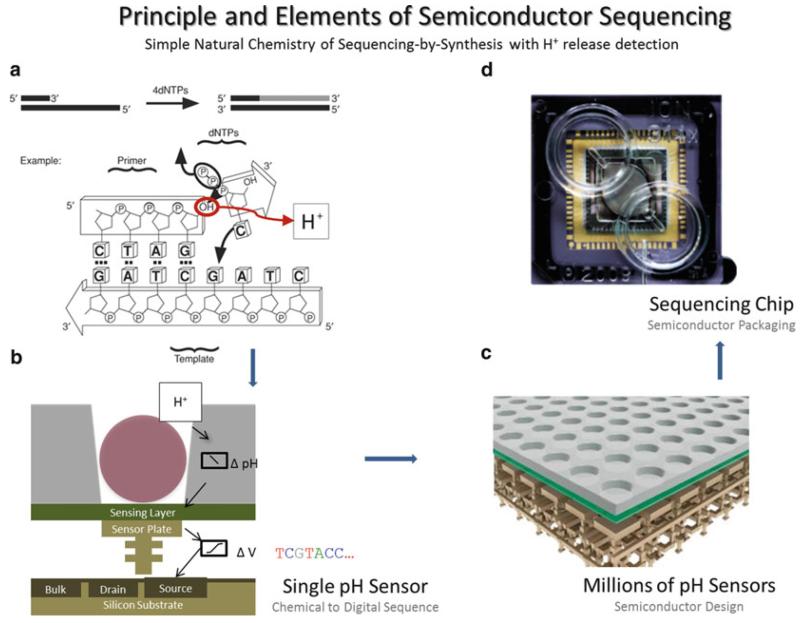
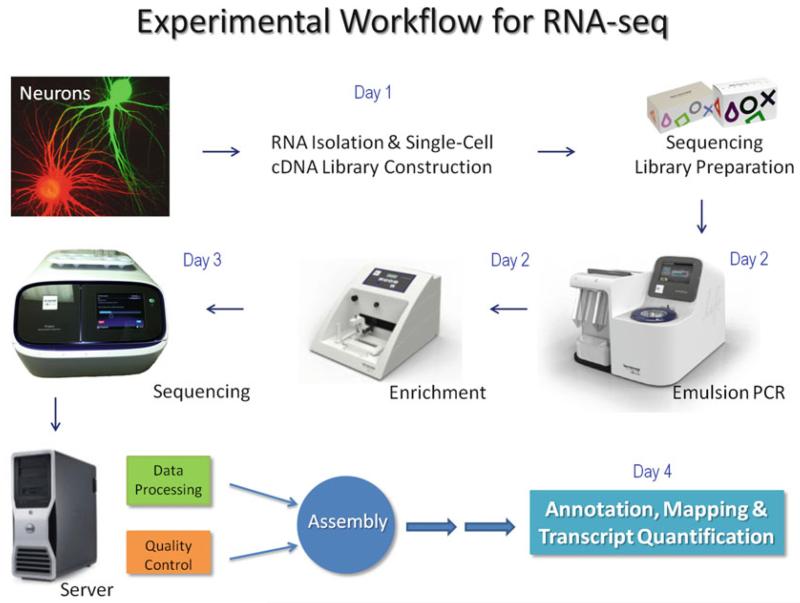
RNA-seq or transcriptome analysis of individual cells and small-cell populations is essential for virtually any biomedical field. It is especially critical for developmental, aging, and cancer biology as well as neuroscience where the enormous heterogeneity of cells present a significant methodological and conceptual challenge. Here we present two methods that allow for fast and cost-efficient transcriptome sequencing from ultra-small amounts of tissue or even from individual cells using semiconductor sequencing technology (Ion Torrent, Life Technologies). The first method is a reduced representation sequencing which maximizes capture of RNAs and preserves transcripts' directionality. The second, a template-switch protocol, is designed for small mammalian neurons. Both protocols, from cell/tissue isolation to final sequence data, take up to 4 days. The efficiency of these protocols has been validated with single hippocampal neurons and various invertebrate tissues including individually identified neurons within a simpler memory-forming circuit of Aplysia californica and early (1-, 2-, 4-, 8-cells) embryonic and developmental stages from basal metazoans.


Figures

Fig. 1
Fig. 1
Principles and elements of semiconductor sequencing. Simpler natural chemistry of sequencing by synthesis is implemented in the Ion Torrent platform. As the second strand of DNA is synthesized, the addition of every new nucleotide leads to a release of H+ (a) which is detected by a silicon pH sensor (b). Several million pH sensors (c) are arranged within a sequencing chip (d). Cross-sectional view (c) shows the ion-sensitive layer in green with the microwells on the top surface (3 μm) and the transistor stack underneath. The present design reduces the complexity of light detection schemes such as the use of modified and fluorescent bases and optical/laser detection. PGM functions by delivering natural unmodified nucleotides one at a time over the surface of the chip. Because nucleotides are unmodified and detection does not require any additional enzyme/amplification cascades, it also eliminates many sources of error, thereby delivering long accurate reads with highly uniform genome coverage. Modified from ref.
Fig. 2
Fig. 2
Semiconductor sequencing chips. The table summarizes statistics for various sequencing runs and their assessments for each chip type: 314, 316, 318 Ion Torrent PGM, and Ion Proton (IP1/IP2/IP3). All runs were based on 200 bp chemistry and OneTouch™ template preparation with Torrent Suite server version 2.2. Q20 refers to 99 % accuracy of a base call. 1Data were obtained in our laboratory at the University of Florida. 2Analysis includes assembly and initial annotation of a given sequencing run using a High Performance Computer Cluster (64 Intel(R) Xeon(R) X7550 2.00GHz CPUs, 512GB of RAM, and 6TB of storage). *All Proton data were provided by Ion Torrent, Life Technologies
Fig. 3
Fig. 3
Experimental workflow for RNA-seq using the Ion Torrent (see details in the text). The equipment set includes OneTouch™ Instrument for templated bead preparation (Subheadings 3.5.1, 3.5.2, and 3.5.3), an Ion OneTouch™ ES robotic system for sample enrichment (Subheadings 3.5.4, 3.5.5, and 3.5.6), Personalized Genome Sequencer™ (Subheading 3.6), and an Ion Torrent server containing Torrent Software Suite for base calling and mapping and web portal access for data review and sharing for sequencing and primary data analysis within hours. Combined, this innovative approach allows us to perform multiple, even single-cell RNA-seq experiments at the lowest possible cost today within 3–4 day’s turnaround time: from cell sampling to sequencing and initial annotation
Fig. 4
Fig. 4
In-line emulsion PCR technology. The schematic diagram illustrates key steps in the process using OneTouch™ instrumentation. (a) The Ion OneTouch™ Instrument has three key technologies that enable automated delivery of templated Ion Sphere™ particles. The first is a reaction filter (A1) that creates millions of microreactors in which clonal amplification occurs. The second is the in-line PCR amplification plate (A2) that enables thermal cycling of the microreactors. The third is the integrated centrifuge (A3), which recovers the templated Ion Sphere™ particles. The green dots represent Biotin that has been incorporated on the primer 5′-end of the template or DNA molecule during the emPCR process. The Biotin is used to isolate only the template-positive ISP by binding to Streptavidin-linked C1 Magnetic Beads (large red dots) during the enrichment step on the Ion OneTouch™ ES. (b) The Ion OneTouch™ ES uses magnetic bead (large red dots) technology to isolate template-positive Ion Sphere™ particles that can be loaded directly onto the Ion semiconductor chip, thus delivering automated, highly reproducible enrichment with every run (Color figure online)
Fig. 5
Fig. 5
Sequencing BenchTop Center. The photo shows the arrangement of key instruments required for semiconductor sequencing in an individual laboratory
Fig. 6
Fig. 6
Preparation of sequencing libraries using a reduced representation protocol. The diagram presents a workflow for library construction and sequencing on Ion PGM. The number of days and corresponding sections are listed in the far left. Tested samples (e.g., hippocampal or Aplysia neurons or developmental/aging cell populations) are prepared for RNA isolation (see Subheadings 3.1 and 3.2) with quality of the RNA checked by a Bioanalyzer (quality control). The insert electropherograms are illustrative examples of RNA isolated from a single Aplysia neuron, 1 day embryos of Pleurobrachia, and rat hippocampal neuronal cluster from the CA3 region (ng amount of total RNA is listed for the entire extraction from each corresponding sample). The library construction process is summarized in Subheading 3.3.1 (see text). Illustrative examples of an E-gel for two libraries are shown in the second insert (here two different markers were run between the samples, and the bright bands are labeled with appropriate sizes). The library quality control assessment is summarized in Subheading 3.4 (see text). The template preparation and sequencing is followed as in Subheadings 3.5 and 3.6 (see text)
Fig. 7
Fig. 7
Preparation of sequencing libraries using template switch from single neurons. The diagram presents a workflow for library construction and sequencing on Ion PGM or Proton. The number of days and corresponding sections are listed in the far left. Tested samples are single mouse hippocampal neurons. The library construction process is summarized in Subheading 3.3.2 (see text). Illustrative example of a TapeStation 2200 analysis from a single CA1 neuron is in the left side insert. The library quality control assessment is summarized in Subheading 3.4 (see text). The template preparation and sequencing is followed as in Subheadings 3.5 and 3.6 (see text)
Fig. 8
Fig. 8
Quality controls for Ion PGM sequencing. (a) Electropherograms of high-quality Bioanalyzer runs of sequencing libraries showing a sharp peak at 200 bp on left. The second electropherogram is an example of overloading that will not give accurate concentrations. (b) Examples of different loading density on an Ion chip. The higher density, indicated by red, gives more sequences. (c) Examples of sequencing read distributions from two different Ion Torrent sequencing runs. The plot on left shows a higher-quality distribution compared to a low-quality distribution of the sequencing reads in the plot on the right. The high-quality plot was from ~30 cells in the CA1 area of the rat hippocampus and the lower-quality plot was from Aplysia californica (Color figure online)

References

    1. Moroz LL, Kohn AB. Single-neuron transcriptome and methylome sequencing for epigenomic analysis of aging. In: Tollefsbol Trygve O., editor. Biological Aging: Methods and Protocols, Methods in Molecular Biology: Methods and Protocols. Vol. 1048. # Springer Science +Business Media; New York: 2013. DOI 10.1007/978-1-62703-556-9_21. 2013. - PMC - PubMed
    1. Evrony GD, Cai X, Lee E, Hills LB, Elhosary PC, Lehmann HS, Parker JJ, Atabay KD, Gilmore EC, Poduri A, Park PJ, Walsh CA. Single-neuron sequencing analysis of l1 retrotransposition and somatic mutation in the human brain. Cell. 2012;151:483–496. - PMC - PubMed
    1. Tang F, Lao K, Surani MA. Development and applications of single-cell transcriptome analysis. Nat Methods. 2011;8:S6–S11. - PMC - PubMed
    1. Moroz LL, Kohn AB. Do different neurons age differently? Direct genome-wide analysis of aging in single identified cholinergic neurons. Front Aging Neurosci. 2010;2:1–18. - PMC - PubMed
    1. Navin N, Kendall J, Troge J, Andrews P, Rodgers L, McIndoo J, Cook K, Stepansky A, Levy D, Esposito D, Muthuswamy L, Krasnitz A, McCombie WR, Hicks J, Wigler M. Tumour evolution inferred by single-cell sequencing. Nature. 2011;472:90–94. - PMC - PubMed

Publication types