. 2013 Nov 1;100(2):231-40.
doi: 10.1093/cvr/cvt191. Epub 2013 Aug 8.

Super-resolution fluorescence microscopy of the cardiac connexome reveals plakophilin-2 inside the connexin43 plaque

Affiliations

Super-resolution fluorescence microscopy of the cardiac connexome reveals plakophilin-2 inside the connexin43 plaque

Esperanza Agullo-Pascual et al. Cardiovasc Res. .

Abstract

Aims: Cell function requires formation of molecular clusters localized to discrete subdomains. The composition of these interactomes, and their spatial organization, cannot be discerned by conventional microscopy given the resolution constraints imposed by the diffraction limit of light (∼200-300 nm). Our aims were (i) Implement single-molecule imaging and analysis tools to resolve the nano-scale architecture of cardiac myocytes. (ii) Using these tools, to map two molecules classically defined as components 'of the desmosome' and 'of the gap junction', and defined their spatial organization.

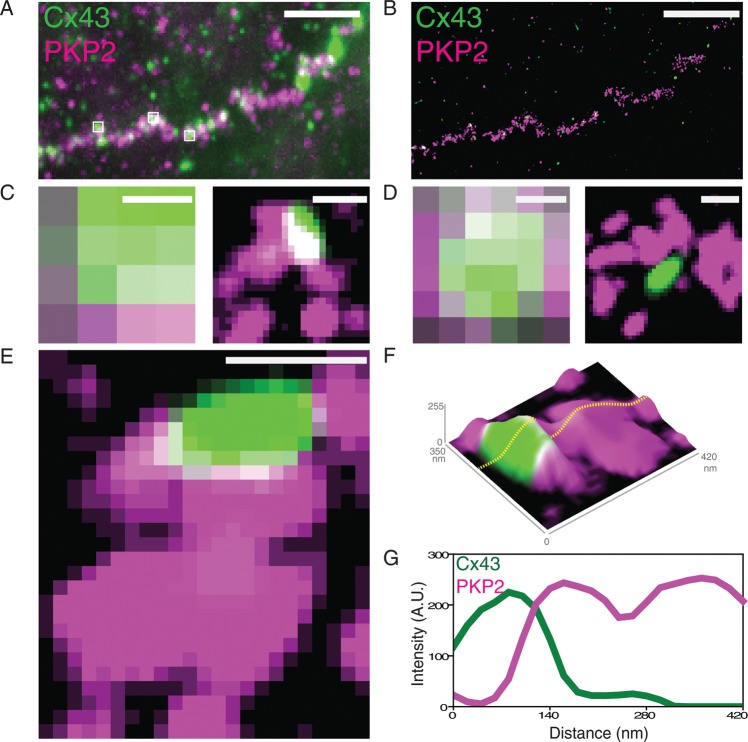
Methods and results: We built a set-up on a conventional inverted microscope using commercially available optics. Laser illumination, reducing, and oxygen scavenging conditions were used to manipulate the blinking behaviour of individual fluorescent reporters. Movies of blinking fluorophores were reconstructed to generate subdiffraction images at ∼20 nm resolution. With this method, we characterized clusters of connexin43 (Cx43) and of 'the desmosomal protein' plakophilin-2 (PKP2). In about half of Cx43 clusters, we observed overlay of Cx43 and PKP2 at the Cx43 plaque edge. SiRNA-mediated loss of Ankyrin-G expression yielded larger Cx43 clusters, of less regular shape, and larger Cx43-PKP2 subdomains. The Cx43-PKP2 subdomain was validated by a proximity ligation assay (PLA) and by Monte-Carlo simulations indicating an attraction between PKP2 and Cx43.

Conclusions: (i) Super-resolution fluorescence microscopy, complemented with Monte-Carlo simulations and PLAs, allows the study of the nanoscale organization of an interactome in cardiomyocytes. (ii) PKP2 and Cx43 share a common hub that permits direct physical interaction. Its relevance to excitability, electrical coupling, and arrhythmogenic right ventricular cardiomyopathy, is discussed.

Keywords: Ankyrin-G; Connexin43; Plakophilin-2.


Figures

Figure 1
Figure 1
TIRF vs. SRFM. NRVMs stained for Cx43 and PKP2. (A) and (B) show same region of intercellular contact visualized by TIRF (A) and by super-resolution microscopy (B). Small white squares in (A) are enlarged in (C–E). (C) and (D) show improved resolution after reconstruction (right). (E) Cx43 cluster surrounded by PKP2, also shown in (F) as a topological image (z-axis: signal intensity). Dotted line across image is plotted in (G) to show intersection of both signals. Scale bars: 5 μm (A and B) and 200 nm (C–E).
Figure 2
Figure 2
Cx43 cluster analysis. (A) Cx43 (green) and PKP2 (purple), with an area of overlap (white). Yellow dotted line demarcates area of Cx43 cluster while blue dotted line demarcates area of PKP2 cluster. (B) Histogram of area occupied by each Cx43 cluster. Note two primary Gaussian peaks centred at 13 313 ± 328 and 25 035 ± 226 nm2. (C) Cluster circularity index; a value of 1.0 indicates perfect circle. (D) Correlation between area and perimeter. (E) Correlation between perimeter and circularity; note that smaller clusters have a more circular shape. (F) Average profile of Cx43 fluorescence intensity along the diameter of Cx43 clusters with circularity index >0.8. n = 136 clusters of six images analysed.
Figure 3
Figure 3
Analysis of Cx43-PKP2 subdomain. (A) Example of Cx43 (green) and PKP2 (purple) localization, with an area of overlap (white). Histograms in (B) and (C) show distances between a Cx43 cluster and the closest PKP2 cluster. (B) Untreated cells. (C) Cells treated with a control oligonucleotide that does not prevent protein expression. In both histograms, largest number of events (41.9 and 57.6%, respectively), correspond to cases where Cx43 and PKP2 overlap (represented by first bar left of ‘0 nm’ point). (D) Scatter plot correlates the Cx43 cluster area with area covered by Cx43-PKP2 subdomain. Grey shade illustrates area between identity line (solid diagonal line) and its 50% reference (dotted diagonal line); blue area highlights clusters with a co-localization of <10 000 nm2. n = 124 and 66, respectively.
Figure 4
Figure 4
Cx43 cluster dimensions in AnkG-silenced cells. (A) distribution of Cx43 cluster areas in AnkG-silenced cells (red histogram) and comparison with Gaussian functions defining Cx43 cluster areas in control (black lines). (B) Cluster circularity index in AnkG-silenced cells. n = 424 clusters of 12 images analysed. (C) Cx43-PKP2 subdomain in cells treated with AnkG-shRNA. Grey and blue areas defined for control cells (D) are shown for reference. n = 128 clusters.
Figure 5
Figure 5
Analysis of the Cx43-PKP2 subdomain by Monte–Carlo simulations. (A) Sample image for a simulation of Cx43 and PKP2 clusters drawn as randomly distributed ellipses over a 30 000 × 2000 nm box. (B) and (C) Correlation Cx43-PKP2 subdomain and Cx43 cluster area of control cells and AnkG-silenced cells, respectively, in experimental data (red) and modelled data (blue). Data are separated in three different groups: >50% overlap, 10–50% overlap or <10% overlap. (D, E) and (F, G) probability density for co-localization between Cx43 and PKP2 as a function of a ‘co-localization factor’, i.e. increased Cx43-PKP2 attraction. (D) Untreated cells, >50% overlap. (E) AnkG-silenced cells, >50% overlap. (F) Untreated cells, 10–50% overlap. (G) AnkG-silenced cells, 10–50% overlap.
Figure 6
Figure 6
(A) Cx43-PKP2 interaction in rat heart tissue, detected by a proximity ligation assay (Duolink). Cx43-PKP2 cross-reactivity by PLA is shown in blue. Cx43 alone is depicted in green. Scale bar = 10 μm. (B) Proposed model of Cx43 plaque organization. The gap junction is surrounded by an area defined as the perinexus where Cx43 hemichannels interact with ZO-1; this interaction regulates the transition of connexons to the gap junction. We speculate that AnkG is localized at the border of the perinexus; we further speculate that AnkG and ZO-1 are mutually exclusive and in this manner, AnkG restricts plaque size. When AnkG is silenced (right panel), the area of influence of ZO-1 increases, expanding the perinexal area at the expense of the actual pore-forming gap junction, yielding larger Cx43 plaque sizes and yet, a reduced channel-forming domain.

References

    1. Born MW, E. Principles of Optics: Electromagnetic Theory of Propagation, Interference and Diffraction of Light. Cambridge: Cambridge University Press; 1997.
    1. Heilemann M, van de Linde S, Schuttpelz M, Kasper R, Seefeldt B, Mukherjee A, et al. Subdiffraction-resolution fluorescence imaging with conventional fluorescent probes. Angew Chem Int Ed Engl. 2008;47:6172–6176. doi:10.1002/anie.200802376. - DOI - PubMed
    1. Baddeley D, Jayasinghe ID, Lam L, Rossberger S, Cannell MB, Soeller C. Optical single-channel resolution imaging of the ryanodine receptor distribution in rat cardiac myocytes. Proc Natl Acad Sci U S A. 2009;106:22275–22280. doi:10.1073/pnas.0908971106. - DOI - PMC - PubMed
    1. Soeller C, Baddeley D. Super-resolution imaging of EC coupling protein distribution in the heart. J Mol Cell Cardiol. 2013;58:32–40. doi:10.1016/j.yjmcc.2012.11.004. - DOI - PubMed
    1. Wong J, Baddeley D, Bushong EA, Yu Z, Ellisman MH, Hoshijima M, et al. Nanoscale distribution of ryanodine receptors and caveolin-3 in mouse ventricular myocytes: dilation of T-tubules near junctions. Biophys J. 2013;104:L22–L24. doi:10.1016/j.bpj.2013.02.059. - DOI - PMC - PubMed

Publication types