

Dynamic expression profiling of type I and type III interferon-stimulated hepatocytes reveals a stable hierarchy of gene expression
- PMID: 23929627
- PMCID: PMC3938553
- DOI: 10.1002/hep.26657
Dynamic expression profiling of type I and type III interferon-stimulated hepatocytes reveals a stable hierarchy of gene expression
Abstract
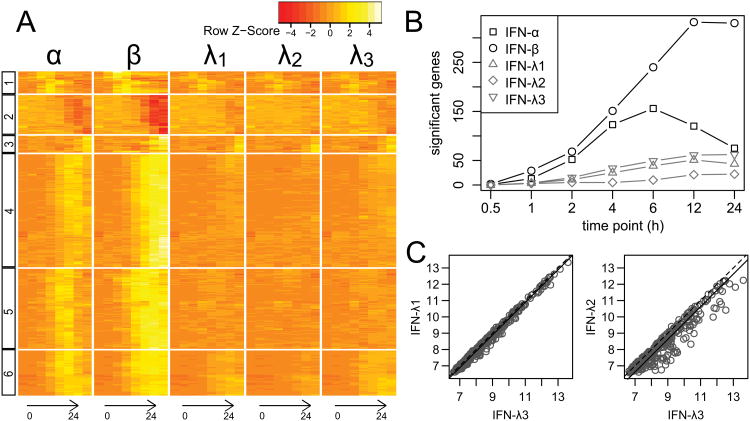
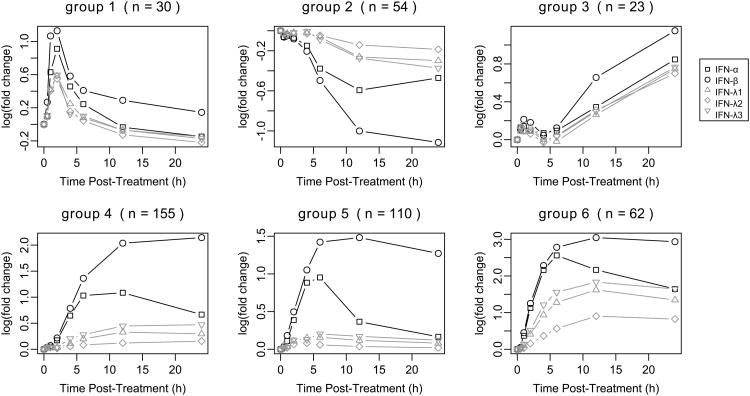
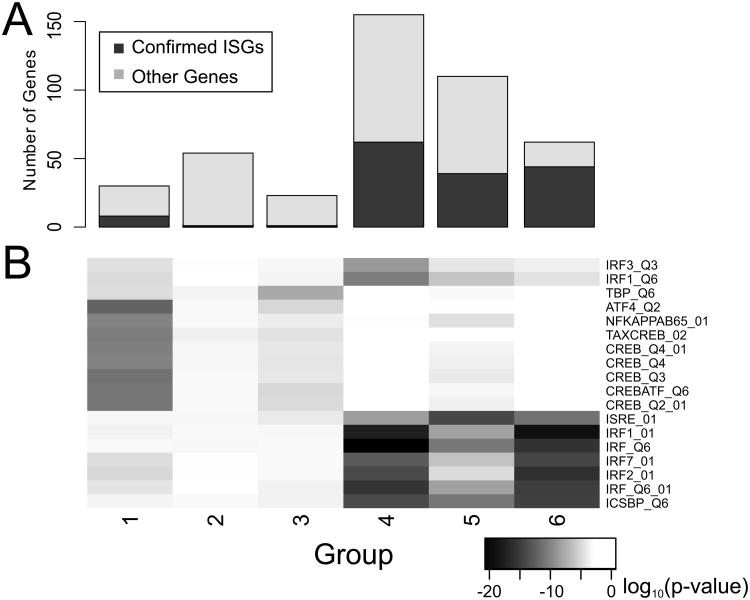
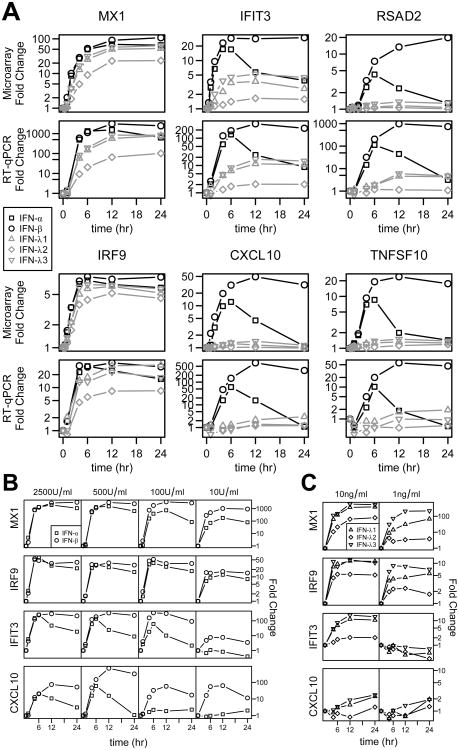
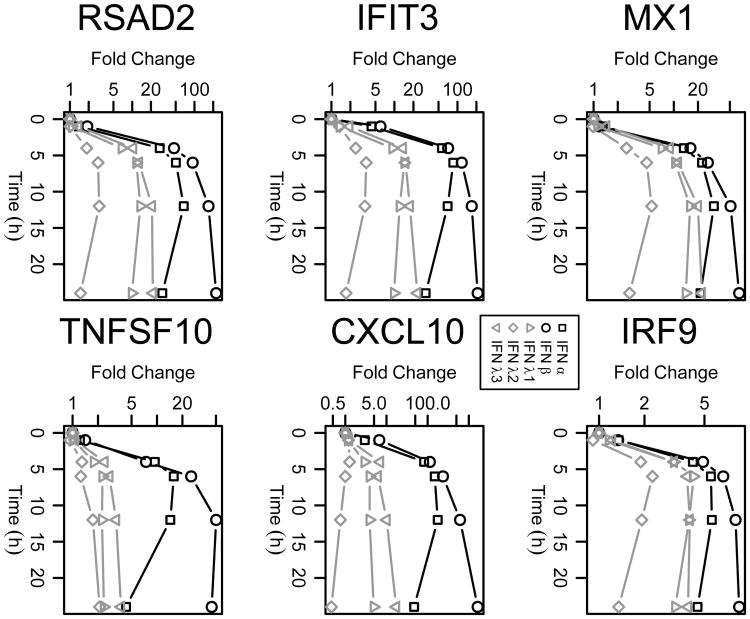
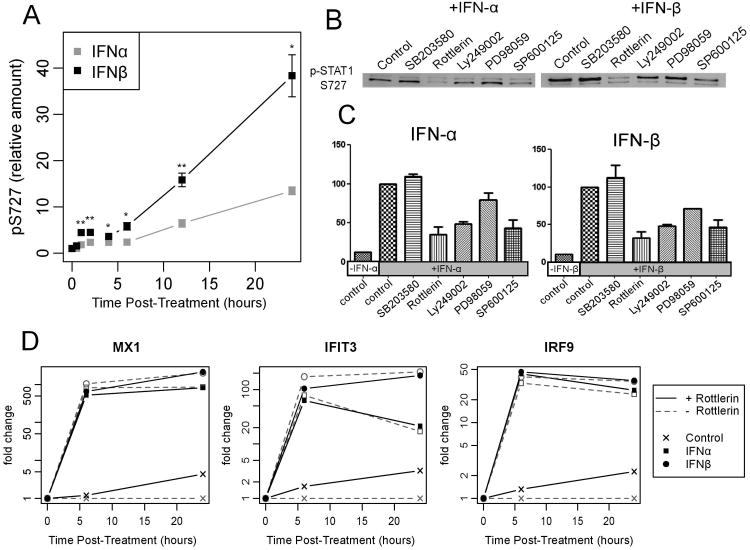
Despite activating similar signaling cascades, the type I and type III interferons (IFNs) differ in their ability to antagonize virus replication. However, it is not clear whether these cytokines induce unique antiviral states, particularly in the liver, where the clinically important hepatitis B and C viruses cause persistent infection. Here, clustering and promoter analyses of microarray-based gene expression profiling were combined with mechanistic studies of signaling pathways to dynamically characterize the transcriptional responses induced by these cytokines in Huh7 hepatoma cells and primary human hepatocytes. Type I and III IFNs differed greatly in their level of interferon-stimulated gene (ISG) induction with a clearly detectable hierarchy (IFN-β > IFN-α > IFN-λ3 > IFN-λ1 > IFN-λ2). Notably, although the hierarchy identified varying numbers of differentially expressed genes when quantified using common statistical thresholds, further analysis of gene expression over multiple timepoints indicated that the individual IFNs do not in fact regulate unique sets of genes. The kinetic profiles of IFN-induced gene expression were also qualitatively similar with the important exception of IFN-α. While stimulation with either IFN-β or IFN-λs resulted in a similar long-lasting ISG induction, IFN-α signaling peaked early after stimulation then declined due to a negative feedback mechanism. The quantitative expression hierarchy and unique kinetics of IFN-α reveal potential specific roles for individual IFNs in the immune response, and elucidate the mechanism behind previously observed differences in IFN antiviral activity. While current clinical trials are focused on IFN-λ1 as a potential antiviral therapy, the finding that IFN-λ3 invariably possesses the highest activity among type III IFNs suggests that this cytokine may have superior clinical activity.
© 2014 by the American Association for the Study of Liver Diseases.
Figures
Comment in
-
Type I and type III interferon-induced immune response: it's a matter of kinetics and magnitude.Hepatology. 2014 Apr;59(4):1225-8. doi: 10.1002/hep.26959. Epub 2014 Feb 28. Hepatology. 2014. PMID: 24677190 No abstract available.
References
-
- Sheppard P, Kindsvogel W, Xu W, Henderson K, Schlutsmeyer S, Whitmore TE, et al. IL-28, IL-29 and their class II cytokine receptor IL-28R. Nat Immunol. 2003;4:63–68. - PubMed
-
- Kotenko SV, Gallagher G, Baurin VV, Lewis-Antes A, Shen M, Shah NK, et al. IFN-lambdas mediate antiviral protection through a distinct class II cytokine receptor complex. Nat Immunol. 2003;4:69–77. - PubMed
-
- Doyle SE, Schreckhise H, Khuu-Duong K, Henderson K, Rosler R, Storey H, et al. Interleukin-29 uses a type 1 interferon-like program to promote antiviral responses in human hepatocytes. Hepatology. 2006;44:896–906. - PubMed
-
- Meager A, Visvalingam K, Dilger P, Bryan D, Wadhwa M. Biological activity of interleukins-28 and -29: comparison with type I interferons. Cytokine. 2005;31:109–118. - PubMed
Publication types
MeSH terms
Substances
Grants and funding
LinkOut - more resources
Full Text Sources
Other Literature Sources
Molecular Biology Databases
Research Materials
Miscellaneous